
Abstract
Purpose:
We examined the association of adipose tissue distribution with type 2 diabetes (T2D) in breast cancer patients.
Methods:
Participants (N = 238) diagnosed with breast cancer at 20-75 years old who received breast cancer treatment at a major hospital from January 1, 2012, to December 31, 2017, with at least one completed and identifiable abdominal or pelvic computed tomography (CT) scan and data regarding race and ethnicity were included. Thirty-two breast cancer patients were identified as T2D patients after their breast cancer diagnoses. The adipose tissue distribution (visceral fat area [VFA], subcutaneous fat area [SFA], and the ratio of VFA to SFA [VFA/SFA]) was quantified on CT images of the third lumbar vertebra. T2D status was retrieved from patients’ electronic medical records. The association of adipose tissue distribution with T2D in women with breast cancer was examined using multivariable logistic regression.
Results:
Participants with T2D had significantly smaller SFA compared to those without T2D (odds ratio [OR] = 0.88, 95% confidence interval [95% CI] = 0.81-0.96, per 10 cm2 SFA). A positive association of VFA/SFA ratio with T2D was observed (OR = 19.57, 95% CI = 3.26-117.42, per unit VFA/SFA), although the estimate was imprecise.
Conclusions:
The amount of subcutaneous adipose tissue was inversely associated with T2D, and the ratio of the amount of visceral adipose tissue to the amount of subcutaneous adipose tissue was positively associated with T2D in breast cancer patients.
Introduction
Approximately 16% of breast cancer patients have type 2 diabetes (T2D), 1 and previous research has suggested that T2D is associated with a worse prognosis of breast cancer. 2 This association can be explained by the evidence that T2D is characterized by insulin resistance, which can result in the excessive secretion of insulin, and high levels of insulin are mitogenic for breast cancer cells. 3
Although obesity is an established risk factor of T2D, to what extent the distribution of fatness is associated with T2D is less clear. Obesity is commonly defined by body mass index (BMI). 4 Nevertheless, this aggregate body mass measurement may not accurately reflect body fatness or adiposity because it is influenced by other body components such as bone and muscle. 5 For instance, high BMI does not always represent high adiposity because BMI can be masked by muscularity. 6 Moreover, some studies revealed that different types of excess fat, such as visceral adipose tissue (VAT) and subcutaneous adipose tissue (SAT), were different in several aspects. 7 For example, VAT has a greater ability to release free fatty acids that can increase blood glucose, whereas SAT more avidly absorbs free fatty acids. 8 Thus, although measuring BMI is more convenient, adipose tissue distribution is more accurate for assessing obesity. 9 Currently, both computed tomography (CT) and magnetic resonance imaging (MRI) provide high accuracy and reproducibility for measuring the distribution of adipose tissue.10-12 Compared with MRI, the operation time of CT is shorter, which can help to obtain clearer images of organs and tissues in action. 13
The purpose of this study was to explore the association of adipose tissue distribution with T2D in a sample of breast cancer patients. Although previous studies suggested that adipose tissue distribution was associated with the occurrence of T2D,14-18 they did not specifically examine breast cancer patients as their metabolism might be different from those without breast cancer. 19 Our hypothesis was that the amount of VAT, but not SAT, was positively associated with T2D in breast cancer patients.
Materials and Methods
Study population
After obtaining approval from the Institutional Review Board of the University of Florida (IRB201800102), women diagnosed with breast cancer who received breast cancer treatment at the University of Florida Health Shands Hospital from January 1, 2012, to December 31, 2017, were identified for this cross-sectional study by using the electronic medical record system. Breast cancer diagnosis was defined using the International Classification of Diseases, Ninth Revision (ICD-9) and Tenth Revision (ICD-10) codes (174 and C50, respectively). Participants were limited to be 20-75 years old at the time of diagnosis and have at least one abdominal or pelvic CT scan taken after the diagnosis of breast cancer in the archive. For patients with multiple scans, the scan taken closest to the breast cancer diagnosis was selected. From 296 patients meeting these criteria, we further excluded those with incompletely recorded CT images at the third lumbar vertebra (L3) (n = 15), unidentifiable L3 CT images (n = 19), and missing demographic information, including race and ethnicity (n = 2). Breast cancer patients who had T2D before their diagnoses of breast cancer and whose CT scans were taken after the diagnosis of T2D were also excluded (n = 22). The final sample included 238 women, of whom 32 patients had a new onset of T2D and 206 patients were free of T2D since the breast cancer diagnosis (Figure 1).
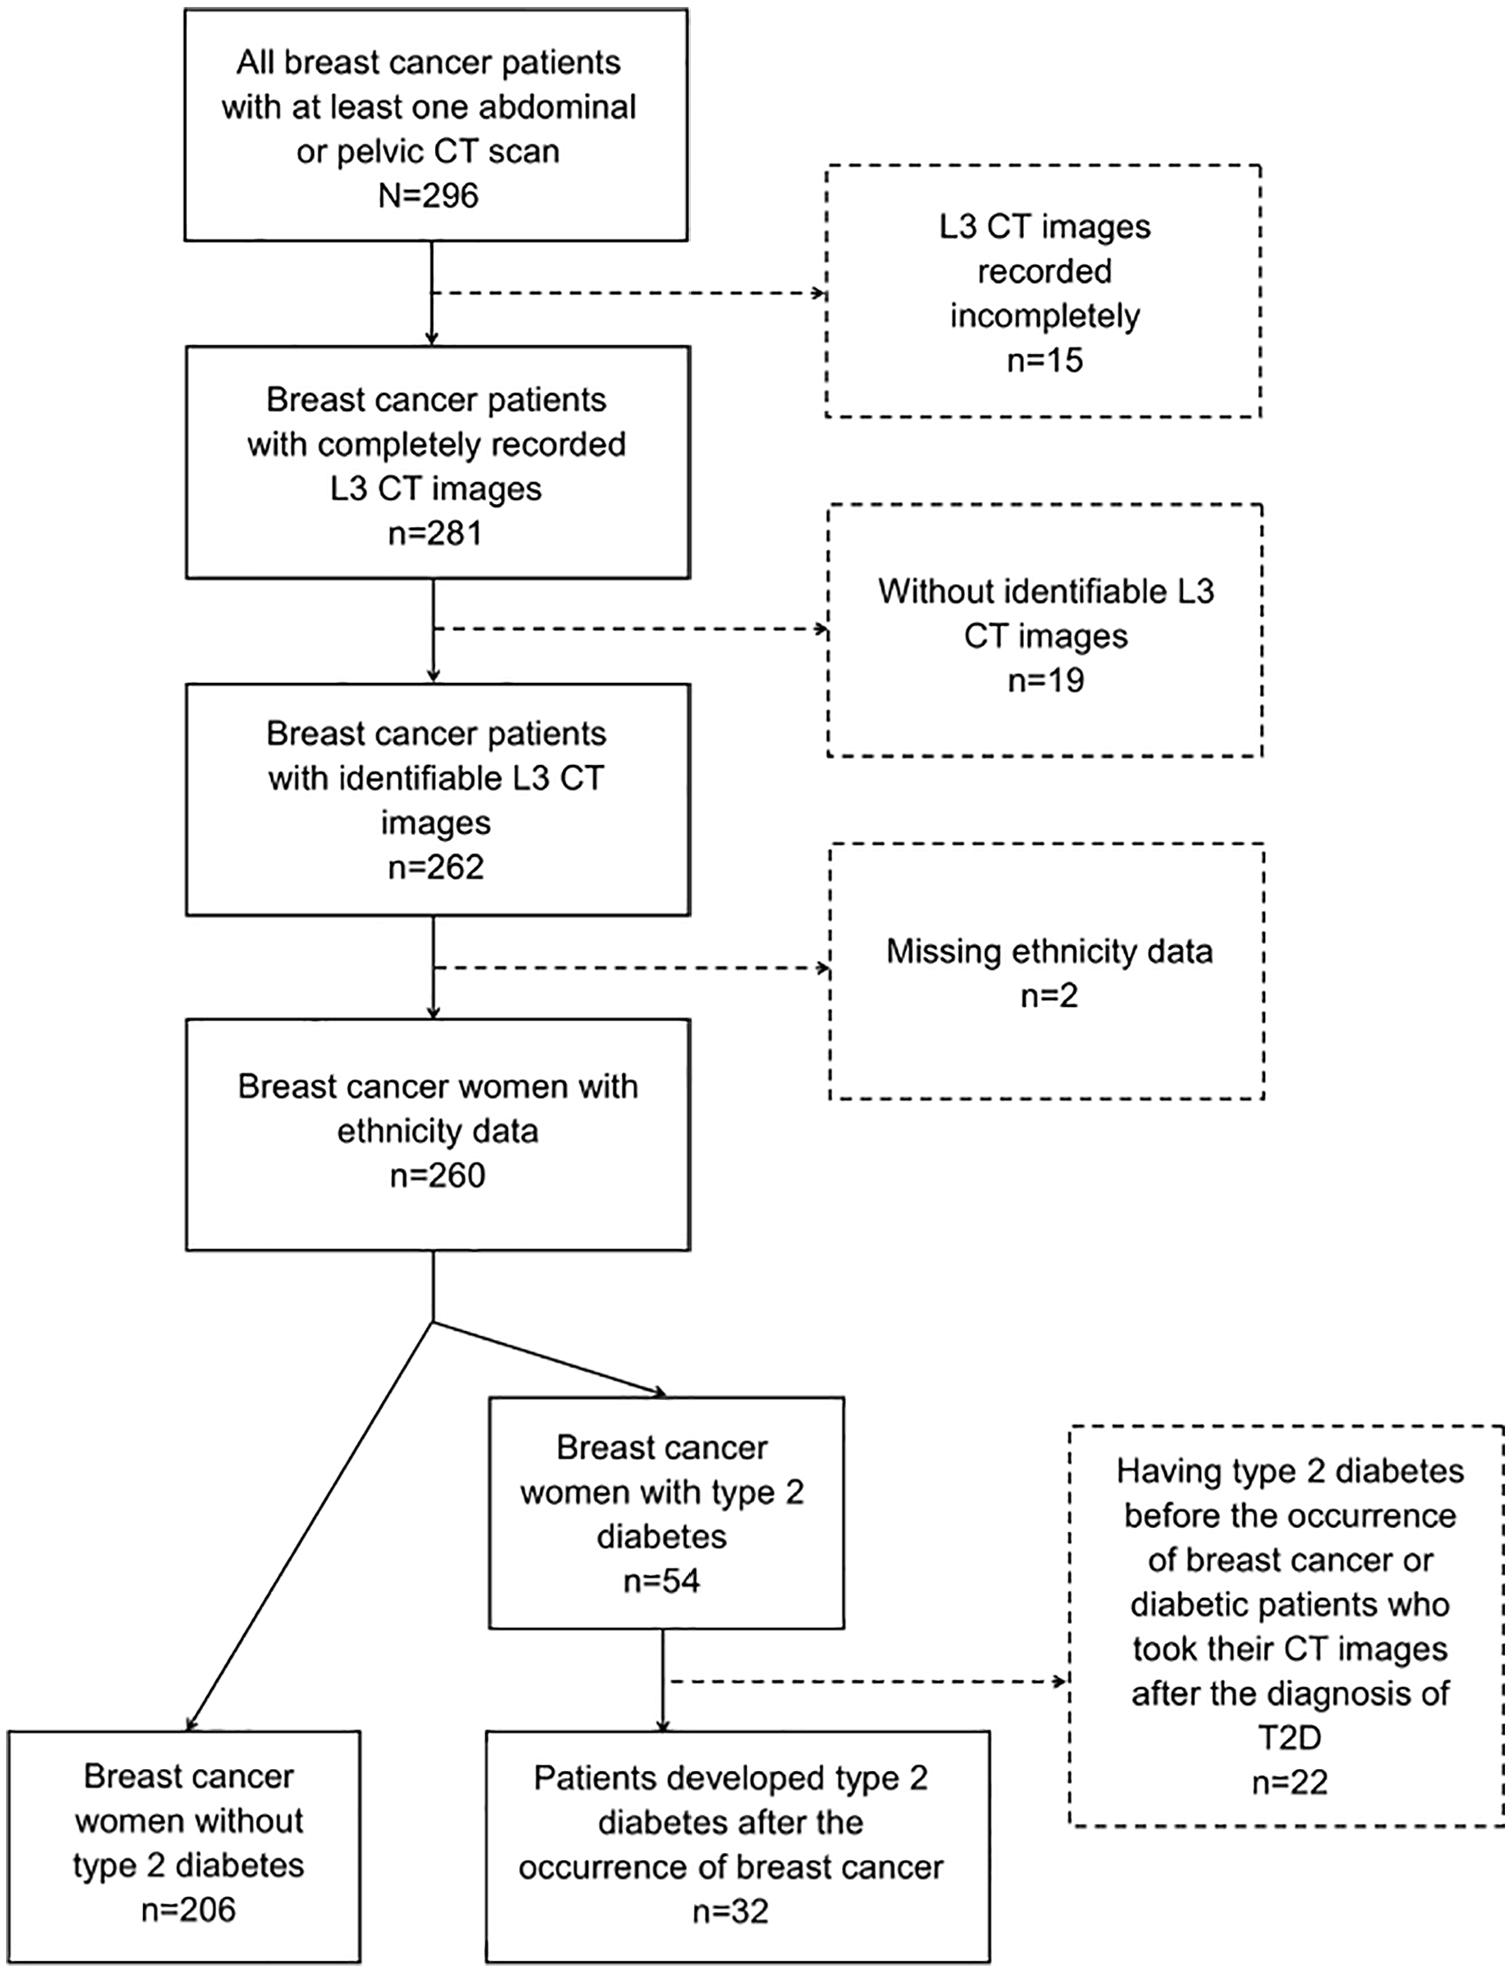
Subject selection diagram.
Adipose tissue distribution measurement
As independent variables in this study, visceral fat area (VFA) and subcutaneous fat area (SFA) were measured by a single investigator blinded to participants’ demographic information and T2D status. As the amount of adipose tissue and skeletal muscle derived from the L3 area are representative of the amount in the whole body (Pearson correlation coefficient [r] = 0.927 for adipose tissue and 0.855 for skeletal muscle), 20 L3 CT images were visually selected from patients’ whole abdominal or pelvic CT scans for image segmentation and measurement using the Sante DICOM Viewer (version 8.1.8, OnePacs, Palo Alto, California). For patients who had more than one CT scan during their breast cancer treatment, the CT scan taken closest to the time of breast cancer diagnosis was selected. Slice-O-Matic (version 5.0, TomoVision, Magog, Quebec, Canada) was used to perform adipose tissue segmentation. Adipose tissue was identified by tissue-specific Hounsfield Units (HU) from –190 HU to –30 HU, 21 and VAT and SAT were visually distinguished according to the cutoff lines of abdominal muscle. Then, VFA in cm2 and SFA in cm2 were calculated (Figure 2). To test the reproducibility of the adiposity measurement method, in a random subset of the study sample (n = 49), adiposity was quantified by 2 raters (a medical doctor and a trained technician). The interobserver reliability was excellent (r = 0.992 for VFA and 0.999 for SFA). As previous studies suggested that the ratio of the amount of VAT to the amount of SAT (VFA/SFA) was a risk factor for T2D, 22 VFA/SFA was also treated as an independent variable in this study.
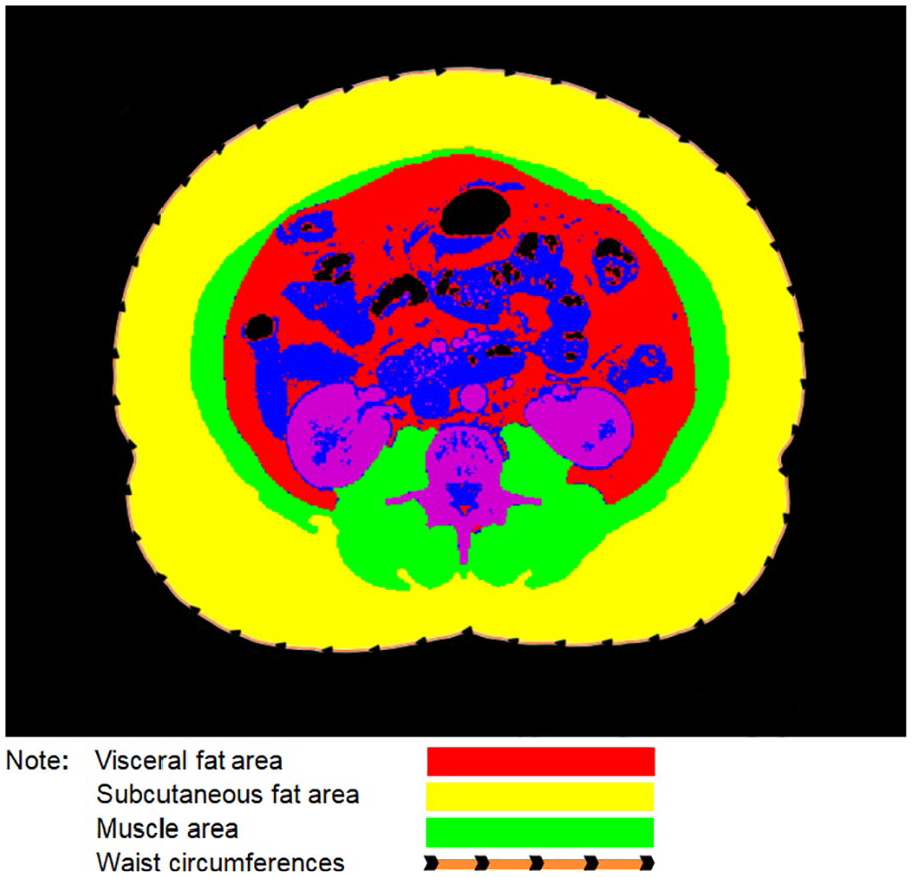
CT image segmentation and measurement (created by using Slice-O-Matic [version 5.0, TomoVision, Magog, Quebec, Canada]).
Type 2 diabetes status
The outcome data of interest, T2D status, were retrieved from patients’ electronic medical records. As all participants had been required to test for T2D, T2D patients were directly identified using the ICD codes of T2D diagnosis.
Covariates
Several characteristics of breast cancer patients were considered as potential confounders in this study. Age, race (African American/black or white) and ethnicity (Hispanic or non-Hispanic) were directly retrieved from patients’ electronic medical records. Muscle areas (MAs) in cm2 were measured based on patients’ L3 CT images using the CT segmentation method, and muscle tissue-specific HUs were measured from –29 HU to 150 HU. 21 As participants’ waist circumferences (WCs) had not been recorded in the electronic medical record system, they were also measured on the L3 CT images.
Statistical analysis
To examine the representativeness of the study sample, we compared the distributions of the demographic characteristics and tumor stage of the study sample and all female breast cancer patients (n = 1632) who were included in the University of Florida Tumor Registry from January 1, 2012, to December 31, 2017, with the data on race, ethnicity, and age (between 20 and 75 years old) at the time of diagnosis. Chi-square test or Fisher exact test was used for categorical variables, including race, ethnicity, and tumor stage (if any cell had an expected count less than 5, Fisher exact test was used). T test was used for the comparison of age distributions between these 2 groups.
Distributions of the demographic characteristics and body measurements of breast cancer patients with and without T2D in the study sample were compared using χ2 test or Fisher exact test for categorical variables, including race and ethnicity, depending on their statistical characteristics. T test was used for the comparison of numerical variables, including age, WC, MA, VFA, SFA, and VFA/SFA. The correlation coefficients between body measurements (WC, MA, VFA, SFA, and VFA/SFA) were assessed using Pearson correlation.
Multivariable logistic regression was used to estimate odds ratios (ORs) and 95% confidence intervals (CIs) for T2D in relation to VFA, SFA, and VFA/SFA. As 1 cm2 was too small to have clinical significance, analyses were conducted with a 10-unit increase (10 cm2) in VFA and SFA. Further analyses were conducted with adipose tissue measures categorized into quartiles, in which Wald χ2 test was applied to examine linear trends. As previous studies reported that age, race, ethnicity, WC, and MA were associated with both adipose tissue distribution and T2D,23-27 these variables were all included in logistic regression models to control for potential confounding. Previous research has indicated that race might modify the relationship between adipose tissue distribution and T2D. 25 Thus, this potential effect modifier was tested using likelihood ratio test. All tests were 2-sided, and their statistical significance was judged at 5%. Statistical analyses were performed using the Statistical Analysis System (SAS, version 9.4, SAS, Cary, North Carolina).
Results
This study included 238 women with breast cancer. The comparisons of the demographic characteristics and tumor stage distributions between the study sample and general breast cancer patients are shown in Table 1. The participants in the study sample were significantly older than the general breast cancer patients (60.3 vs 57.7 years, P < .0001), and their racial distribution was significantly different from that of the general breast cancer patients (P = .0093). The difference in tumor stage distributions between these 2 groups was also statistically significant (P < .0001). Regarding breast cancer patients who had information on tumor stage, the majority of the participants in the study sample were in stage I and stage II breast cancer (16.0% for both stages), while the majority of general breast cancer patients were in stage I (36.4%). Moreover, the proportions of women in the study sample who were in stage III and stage IV were larger than that of the general breast cancer patients (9.7% vs 4.7%, 13.9% vs 6.4%, respectively).
Comparisons of demographic characteristics and tumor stage distributions between the study sample and general breast cancer patients.

T test.
χ2 test.
The distributions of demographic characteristics of the study sample by T2D status are shown in Table 2. There was a statistically significant difference in the racial distributions between participants with T2D and participants without T2D (P = .0329). Although the majority of both groups were white women (71.9% and 87.9%), the proportion of black breast cancer patients with T2D was larger than that in individuals without T2D (28.1% vs 12.1%). In terms of age and ethnicity, the participants with T2D and those without T2D had similar baseline distributions (P = .1872 and P = .1352, respectively).
Demographic characteristics and body measurements of participants by type 2 diabetes status.

Abbreviations: MA, muscle area; SFA, subcutaneous fat area; VFA, visceral fat area; WC, waist circumference.
T test.
χ2 test.
Fisher exact test.
The distributions of body measurements by T2D status are also shown in Table 2. Breast cancer patients with T2D had significantly larger WCs than those without T2D (104.5 vs 98.7 cm, P = .0354). Moreover, significantly different from participants without T2D, women with T2D had larger VFAs and VFA/SFAs (169.8 vs 132.5 cm2, P = .0143, and 0.6 vs 0.5, P = .0151, respectively). The distributions of MA and SFA were not significantly different between these 2 groups (P = .0862 and P = .5475, respectively).
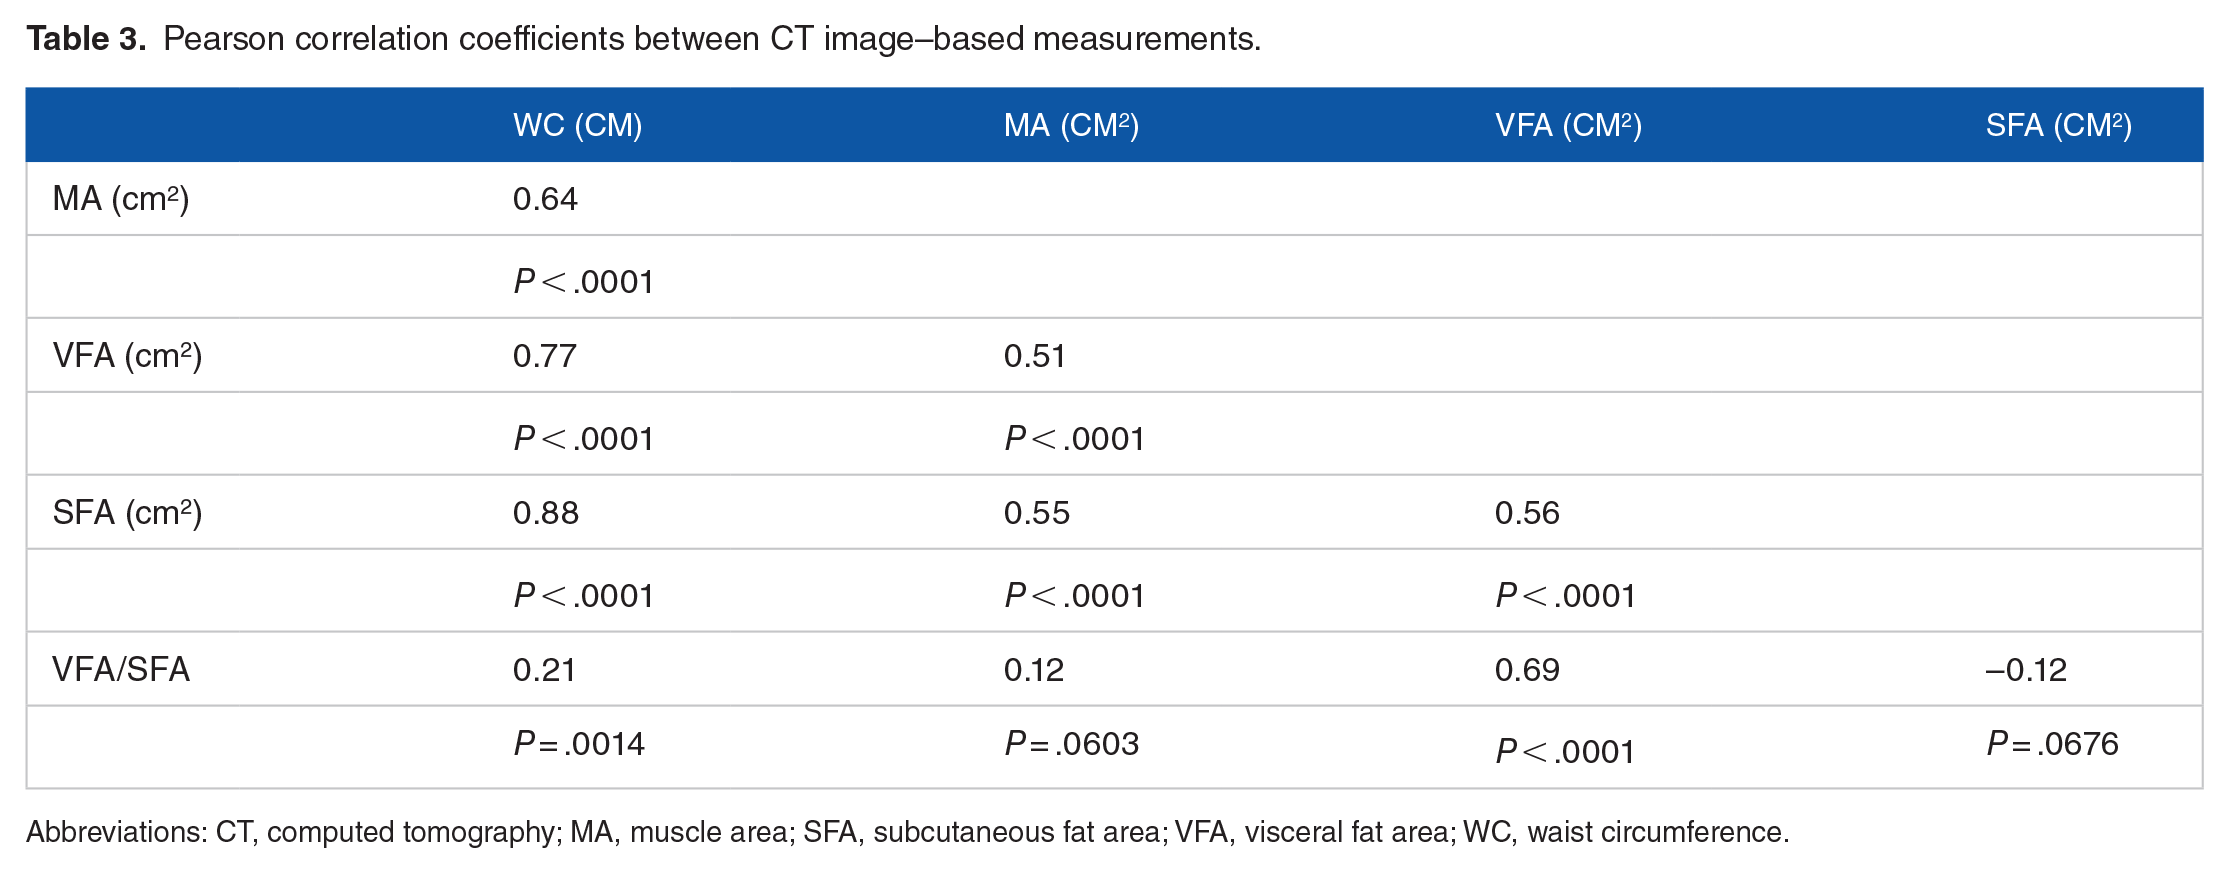
Except for VFA/SFA, which was correlated with only WC and VFA, all body measurements correlated with each other (Table 3).
Pearson correlation coefficients between CT image–based measurements.
Abbreviations: CT, computed tomography; MA, muscle area; SFA, subcutaneous fat area; VFA, visceral fat area; WC, waist circumference.
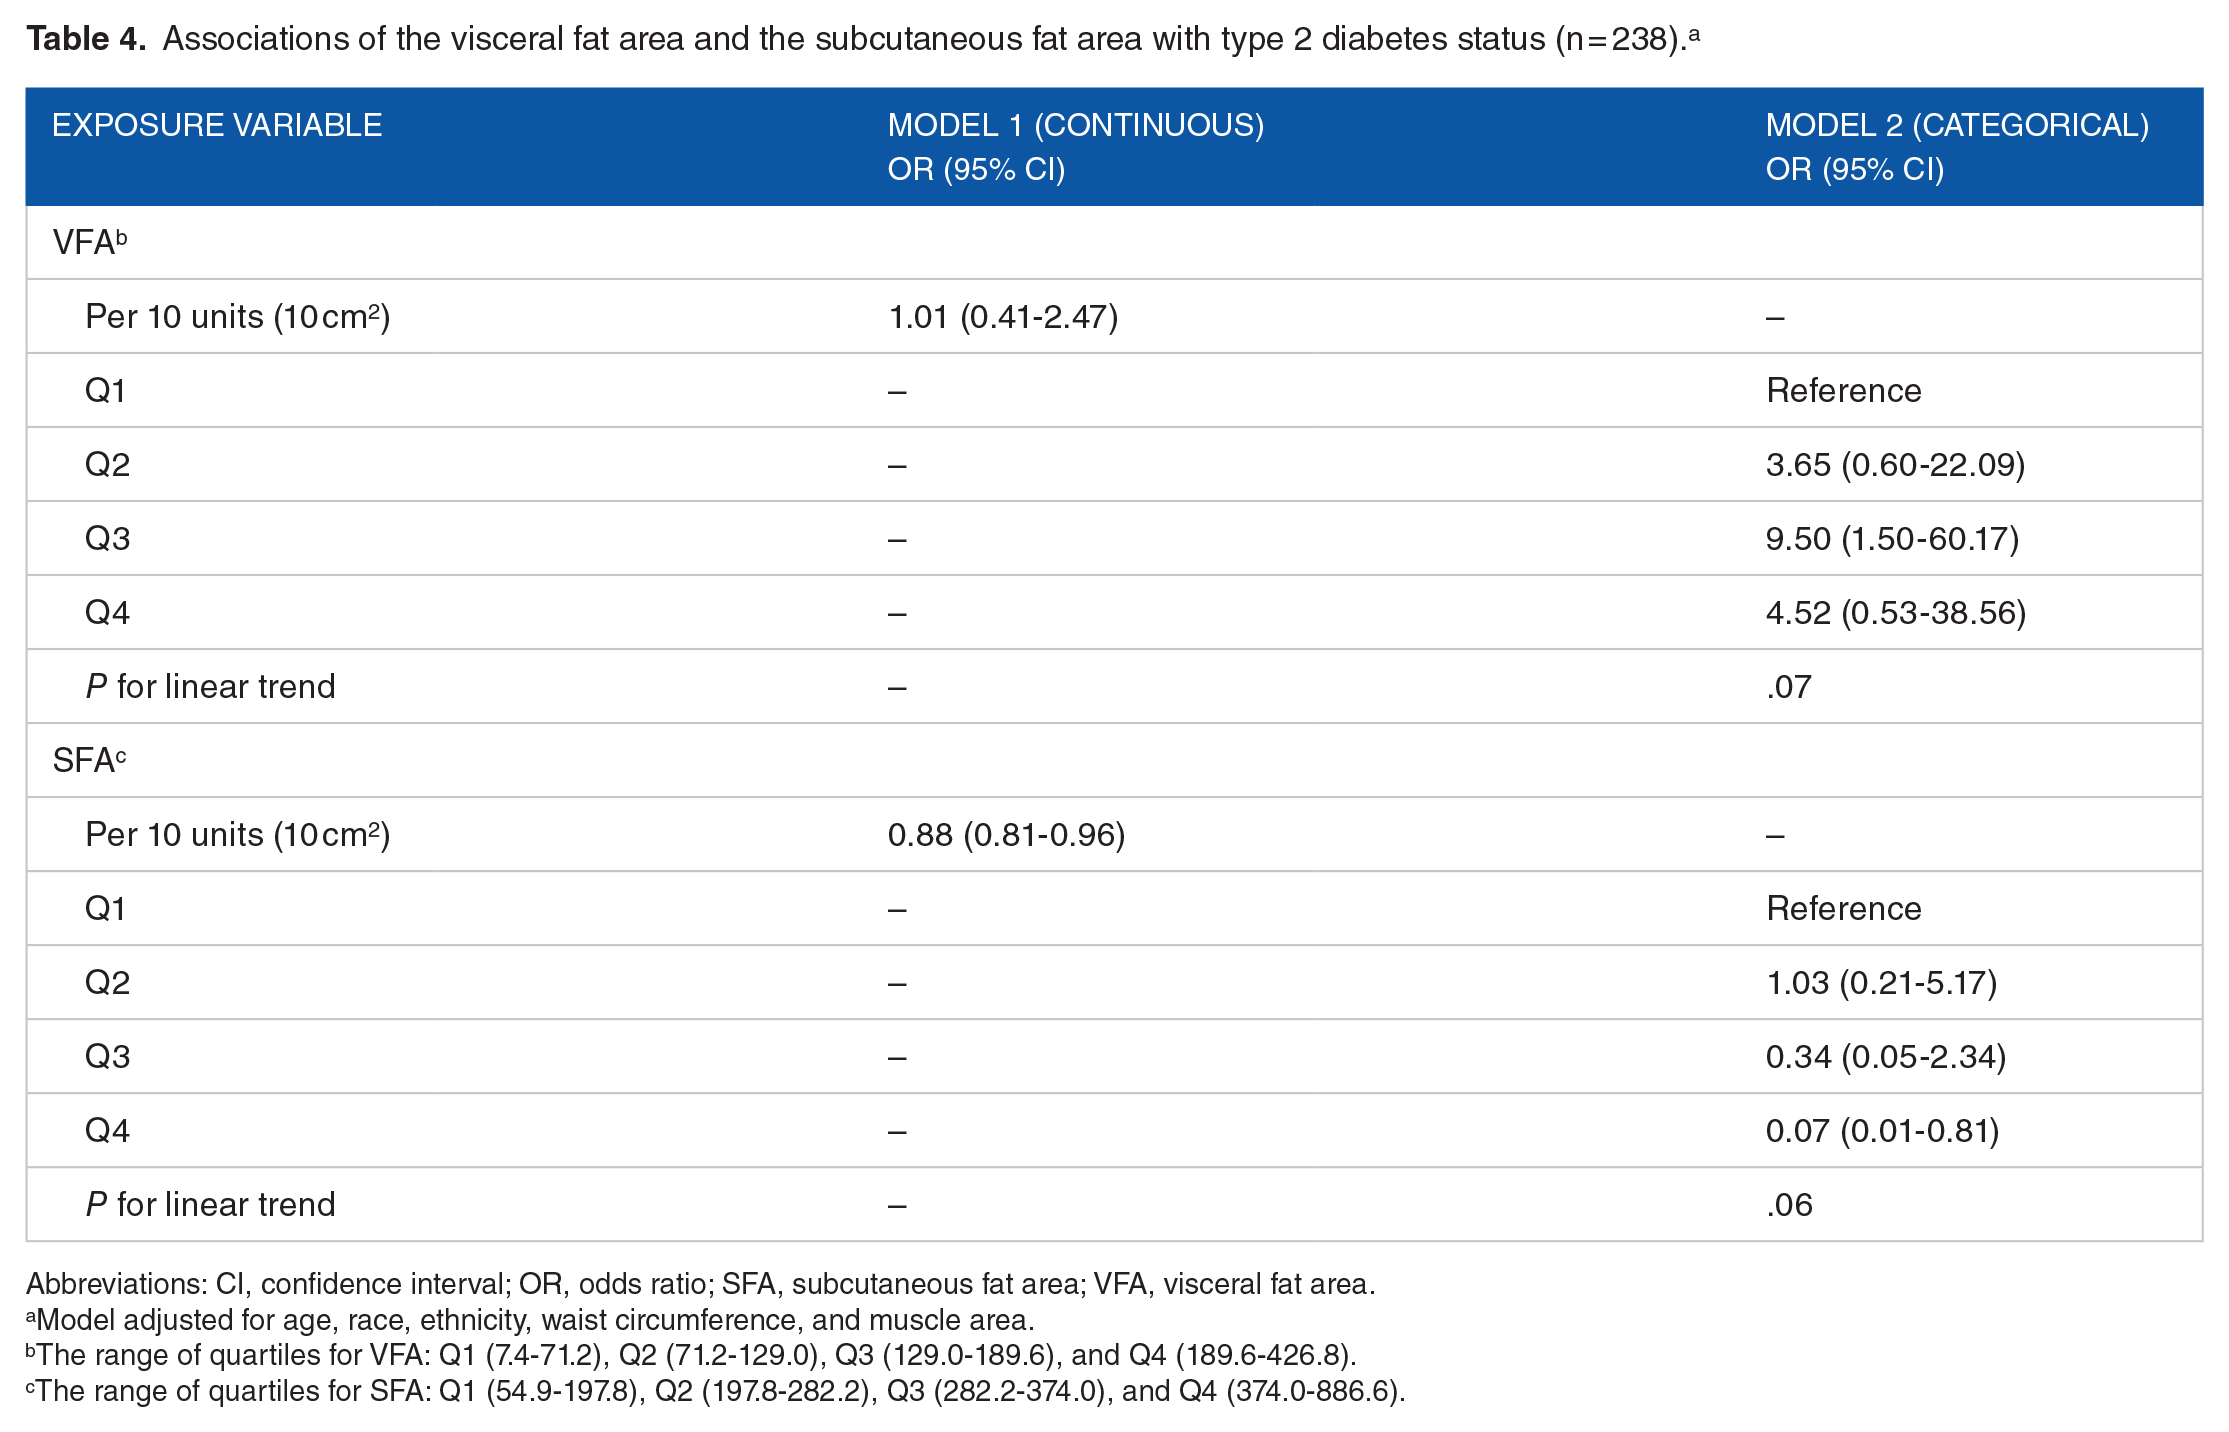
Table 4 shows the results of multivariable regression examining the associations of VFA and SFA with T2D. After adjusting for age, race, ethnicity, WC, MA, and VFA, on average, participants who had T2D were 0.88 times as likely to have a 10 cm2 larger SFA compared to breast cancer patients without T2D and this association was statistically significant (OR = 0.88, 95% CI = 0.81-0.96) (Model 1). In the model with the categorical variables of VFA and SFA, patients with versus without T2D were 0.07 times as likely to have SFA within Q4 than Q1 (OR = 0.07, 95% CI = 0.01-0.81) (Model 2) There was no association of VFA with T2D (see full models in Supplemental Table 1).
Associations of the visceral fat area and the subcutaneous fat area with type 2 diabetes status (n = 238). a
Abbreviations: CI, confidence interval; OR, odds ratio; SFA, subcutaneous fat area; VFA, visceral fat area.
Model adjusted for age, race, ethnicity, waist circumference, and muscle area.
The range of quartiles for VFA: Q1 (7.4-71.2), Q2 (71.2-129.0), Q3 (129.0-189.6), and Q4 (189.6-426.8).
The range of quartiles for SFA: Q1 (54.9-197.8), Q2 (197.8-282.2), Q3 (282.2-374.0), and Q4 (374.0-886.6).
Table 5 shows the results of multivariable regression examining the association of VFA/SFA with T2D. Compared to breast cancer patients without T2D, patients with T2D were significantly 19.57 times more likely to have a one-unit higher VFA/SFA (OR = 19.57, 95% CI = 3.26-117.42) (Model 1). In the model of categorical variables, breast cancer patients with T2D were 6.34 times as likely to have VFA/SFA within Q4 than Q1 (OR = 6.34, 95% CI = 1.65-24.31) (Model 2) (see full models in Supplemental Table 2).
Association of the ratio of visceral fat area to the subcutaneous fat area with type 2 diabetes status (N = 238). a

Abbreviations: CI, confidence interval; OR, odds ratio; SFA, subcutaneous fat area; VFA, visceral fat area.
Model adjusted for age, race, ethnicity, waist circumference, and muscle area.
The range of quartiles for VFA/SFA: Q1 (0.1-0.3), Q2 (0.3-0.4), Q3 (0.4-0.6), and Q4 (0.6-1.6).
We observed that participants with T2D were likely to have larger WCs and likely to be black than white and Hispanic than non-Hispanic individuals (Supplemental Tables 1 and 2). The results of the likelihood ratio test suggested that race was not an effect modifier for the adiposity measurements and T2D (all P values for interaction >.05, data not shown).
Discussion
By using the CT scan segmentation technique, this study examined the association of adipose tissue distribution with T2D in breast cancer patients. We observed that for breast cancer patients, SAT was inversely associated with T2D, and VAT/SAT was positively associated with T2D.
Previous studies reported that VAT was positively associated with T2D,14-18 but our study did not find any significant association of VAT with T2D. This inconsistency could be due to the metabolism of breast cancer patients being different from that of people without breast cancer. 19 Researchers have found that VAT secretes retinol-binding protein 4, which can result in insulin resistance. 28 Cortisol accelerates the breakdown of the protein. 29 In healthy people, cortisol levels are usually highest before awakening and decrease during the day, but breast cancer patients’ cortisol levels are consistently high. 20 This difference in cortisol metabolism between people with and without breast cancer may explain why we did not find any significant association of VAT with T2D in breast cancer patients. Mechanistic studies are needed to confirm this hypothesis. Other findings from our study were consistent with previous research. A cross-sectional study assessing adipose tissue in MRI scans found an inverse association between SAT and T2D. 30 The inverse association could be explained by the fact that SAT can absorb free fatty acids to decrease blood glucose. 8 In the Framingham Offspring and Third Generation cohorts, higher versus lower ratio of VAT/SAT was associated with insulin resistance and risk of T2D. 31 The biological plausibility behind this association might be that VAT/SAT could be positively associated with lipodystrophy, 32 and this lipid metabolism disorder would be followed by insulin resistance and T2D. 33
Our finding in the positive relationship of WC and black and Hispanic race/ethnicity34,35 with diabetes is consistent with the literature. Previous studies also supported the positive association of WC with insulin resistance and T2D,27,36,37 although the research in breast cancer patients is limited. It is to note that the WC measurement in our study was based on CT images in which a patient was resting. The WC measurement could differ from that taken in a standing position. However, any bias that could be introduced due to the difference should be minimal because supine WC and standing WC were highly correlated. 38
Our study was among the first examining the association of adipose tissue distribution with T2D specific to women with breast cancer. The strengths of the study included that the CT scan segmentation technique used to measure adipose tissue distribution in our study had high accuracy and reliability. Moreover, to maintain the accuracy and objectivity of this research, CT scan measurement was performed by a single investigator blinded to participants’ demographic information and T2D status.
However, several limitations of this study should also be considered. First, the sample size of this study was small. The findings should be considered preliminary, and replications with a larger sample size are warranted. In addition, the study sample was selected depending on the availability of clinical CT scans; thus, it was not probabilistically selected. The distributions of age, race, ethnicity and tumor stage of the participants in the study sample were different from those of the general breast cancer patients. Therefore, the generalizability of this study was limited. Another shortcoming was that BMI and tumor characteristics were not adjusted for in the regression models because both variables had a large proportion of missing data. Thus, the validity of the findings might be influenced by potential confounding. Moreover, because of the limitation of our data, we were unable to distinguish incident and recurrent breast cancer patients. Furthermore, information on treatments of breast cancer and diabetes, some of which can cause weight loss, 39 was unavailable. Because of these limitations, the findings of our study should be considered preliminary.
In conclusion, we observed that SAT was inversely associated with T2D and that the VAT/SAT ratio was positively associated with T2D in female breast cancer patients. Further studies are warranted to explore these associations in larger population-based studies with a prospective design and more comprehensive data. Our findings, if confirmed, will be important for T2D prevention and prognosis improvement in breast cancer patients.
Supplemental Material
sj-pdf-1-bcb-10.1177_1178223420972369 – Supplemental material for Association of Adipose Tissue Distribution With Type 2 Diabetes in Breast Cancer Patients
Supplemental material, sj-pdf-1-bcb-10.1177_1178223420972369 for Association of Adipose Tissue Distribution With Type 2 Diabetes in Breast Cancer Patients by Jia Qi, Hui Hu, Lusine Yaghjyan, Lejun An, Harris A Kalim, Erinn O Cooke and Ting-Yuan David Cheng in Breast Cancer: Basic and Clinical Research
Footnotes
Acknowledgements
We would like to acknowledge Integrated Data Repository team, part of the Clinical and Translational Science Institute (CTSI) at the University of Florida, for assisting the project.
Funding:
The author(s) disclosed receipt of the following financial support for the research, authorship, and/or publication of this article: This study was funded by National Institutes of Health (NIH) and National Cancer Institute (NCI) (grant number K07 CA201334). The study concept and training were in part provided by the NIH TREC (Transdisciplinary Research on Energetics and Cancer) Training Workshop (grant number R25 CA203650).
Declaration of conflicting interests:
The author(s) declared no potential conflicts of interest with respect to the research, authorship, and/or publication of this article.
Author Contributions
J.Q. designed the study, collected data, analyzed data, drafted the manuscript, and had primary responsibility for final content; T.-Y.D.C. provided essential materials and funding; H.A.K. and E.O.C. assisted data collection; H.H., L.Y., L.A. provided critical comments on study design, statistical methods, and manuscript preparation. All authors read and approved the final manuscript.
Ethical Approval
All procedures performed in studies involving human participants were in accordance with the ethical standards of the Institutional Review Board of the University of Florida (reference number: IRB201800102) and with the 1964 Helsinki declaration and its later amendments or comparable ethical standards.
Informed Consent
The requirement of informed consent was waived by the Institutional Review Board of the University of Florida.
Supplemental Material
Supplemental material for this article is available online.
References
Supplementary Material
Please find the following supplemental material available below.
For Open Access articles published under a Creative Commons License, all supplemental material carries the same license as the article it is associated with.
For non-Open Access articles published, all supplemental material carries a non-exclusive license, and permission requests for re-use of supplemental material or any part of supplemental material shall be sent directly to the copyright owner as specified in the copyright notice associated with the article.