
Abstract
Long non-coding RNAs (lncRNAs) can function as competing endogenous RNAs (ceRNAs) that rewire post-transcriptional regulation in glioblastoma (GBM). Previous GBM studies have focused on either single lncRNA ceRNA axis in isolation or used in silico predictions with small patient cohorts (< 200). In this study, we integrated RNA-seq data from 372 TCGA-GBM tumors, 5 matched adjacent TCGA-normal brain and 2 931 GTEx-normal brain (n = 3 308) samples to build an experimentally informed ceRNA atlas. Limma-voom differential analysis, intersection with 2 experimentally supported interaction databases (ENCORI and miRTarBase) distilled 517 high-confidence lncRNA–miRNA–mRNA triplets. Twelve hub lncRNAs coordinated 3 downregulated miRNAs and 262 target mRNAs enriched for cell-cycle, p53 signaling and homologous recombination pathways. Two co-expressed hubs, CYTOR and MIR4435-2HG, were significantly over-expressed in GBM tumors in comparison with normal brain tissue and independently predicted poor overall survival (log-rank P < .01). Their shared 25 targets include oncogenic YBX1, MDM4 and TGFBR1 mRNAs, underscoring the redundant regulation of oncogenic pathways, suggesting the need to explore combination lncRNA inhibition strategies. This population-scale analysis prioritizes CYTOR and MIR4435-2HG for functional interrogation and offers a framework for exploring biomarkers and RNA-targeted strategies in GBM.
Keywords
Introduction
Glioblastoma multiforme (GBM) remains one of the most aggressive and lethal forms of brain tumors, with a median survival of approximately 12-15 months despite improvements in surgical resection, radiotherapy, and chemotherapy.1-3 Poor prognosis can be attributed to the heterogeneity, invasive growth patterns, and resistance to conventional therapies.1-3 GBM’s diversity and rapid resistance to existing treatments mean many patients stop responding, so finding new therapeutic targets is essential. 2 In recent years, noncoding RNAs, especially long non-coding RNAs (lncRNAs), have emerged as pivotal regulators of gene expression in GBM, involved in complex post-transcriptional networks that regulate various hallmarks of cancer, including cell division, angiogenesis, and invasion.4-6 Recent studies have shown that lncRNAs can act via the competing endogenous RNA (ceRNA) mechanism, in which RNA transcripts containing shared microRNA response elements (MREs) can compete for miRNA binding, thereby modulating gene stability and translation.7-9 By acting as molecular sponges, lncRNAs, such as HOTAIR, MALAT1, and NEAT1, have been shown to sequester tumor-suppressive miRNAs, leading to derepression of key drivers such as FGF1, SOX2, and CD73.10-12
Despite these advances, most studies focused on individual ceRNA axis in isolation in GBM, either in cell lines (A172 and U87-MG) or small patient cohorts, failing to integrate experimental interaction data.13-15 In this study, we systemically constructed and validated a comprehensive GBM-specific ceRNA network by integrating large-scale RNA-seq data from 372 TCGA-GBM patients (primary tumors), 5 adjacent normal brain tissues of the TCGA-cohort, and 2931 normal brain samples from GTEx.16,17 By leveraging experimentally validated interaction databases (ENCORI for lncRNA-miRNA pairs and miRTarBase for miRNA-mRNA pairs) and applying stringent correlation and differential-expression workflows, we pinpointed critical lncRNA-miRNA-mRNA triplets.18,19 To further prioritize candidates, we overlaid clinical associations, examining expression versus patient survival, for our top lncRNAs, thereby highlighting those that likely drive GBM progression. This integrative approach not only enhances power and robustness over previous GBM ceRNA studies but also delivers a prioritized shortlist of functional ceRNA axes for future mechanistic and therapeutic exploration.
Methods
Data acquisition and processing
Raw RNA sequencing gene expression counts for GBM and normal brain tissue were obtained from TCGA and the GTEx projects. TCGA-GBM data (Primary Tumor n = 372, Solid Tissue Normal n = 5) were retrieved using the TCGAbiolinks package (v.2.34.1). Clinical metadata were retrieved in the same query. To maximize statistical power, GTEx-normal brain RNA sequencing data were accessed for 2931 normal brain samples spanning all 13 GTEx brain subregions via the recount3 package (project “BRAIN”). For both data sets, Ensembl gene IDs were harmonized by removing version numbers, and only genes present in all the data sets were retained for downstream analysis. GENCODE v38 (GRCh38.p13) gene annotation was downloaded and parsed using the R package, rtracklayer, to extract biotype and external gene names, enabling classification of transcripts as protein-coding mRNAs or lncRNAs.
Data normalization and filtering
For gene expression, raw counts were combined across TCGA-GBM tumor, TCGA-, and GTEx-normal brain samples, specifically utilizing STAR-count data. The dimensions of the matrix were 57 562 genes × 3308 samples. An edgeR DGEList object was created, supplying both counts and library information for filtering low-expressed genes, Trimmed Mean of M-values (TMM) normalization, and batch-corrected quality assessments prior to limma modeling. The combined matrix was filtered to retain genes expressed as counts per million (CPM) > 1. Normalization and library size correction were performed using the TMM method with the edgeR package. Voom precision weights were calculated in limma (v3.60.2). For miRNA expression, TCGA-GBM miRNA sequencing data (read counts) were normalized using the same TMM approach. To address potential technical variation arising from different sequencing platforms and tissue preservation methods between TCGA and GTEx data sets, we incorporated batch as a covariate in our linear model. The design matrix explicitly included both biological group (Tumor vs Normal) and technical batch (TCGA vs GTEx):
Differential expression analysis
Differential gene and miRNA expression analyses were performed using the limma-voom pipeline. For genes (lncRNAs and miRNAs), a design matrix was fitted with lmfit followed by empirical Bayes moderation (eBayes) to compare GBM tumors versus all normal brain samples, accounting for batch effects. The batch covariate (TCGA vs GTEx) was included in the linear model to statistically adjust for platform-specific technical variation while preserving biological differences. Differentially expressed genes (DEGs) were defined as log2 fold-change (FC) > 1 with Benjamini-Hochberg false discovery rate (FDR) < 0.05. miRNA differential analysis employed an analogous pipeline (miRNA_group factor: Tumor vs Normal).
Integration of experimentally validated interactions
ENCORI (StarBase v3.0, “CLIP-replicates across ⩾ 10 experiments”) database with high-confidence CLIP-supported human lncRNA-miRNA interaction pairs were downloaded. LncRNA gene names were mapped to Ensembl IDs using GENCODE annotation. Mature miRNA names were converted to precursor IDs via miRbaseConverter for harmonization with expression data. miRTarBase v9.0 (support type = reporter assay / western blot) was used to obtain validated miRNA-mRNA pairs. Human-specific interactions were retained, and gene names were mapped to Ensembl gene IDs. Mature miRNA names were also converted to precursor IDs for compatibility.
Construction of the GBM-specific ceRNA network
Differentially expressed (DE) lncRNAs (upregulated), DE miRNAs (downregulated) and DE mRNAs (upregulated) were intersected with the validated interaction sets to generate the ceRNA network—“up-lncRNA → down-miRNA → up-mRNA” triplets.
Survival analysis
Overall survival (OS) data for 372 patients with complete follow-up were extracted from TCGA data sets. For each identified hub lncRNA, a Kaplan-Meier curve was generated using median expression (survival v3.6-4, survminer v0.4.9); significance was assessed by 2-sided log-rank test (P < .05).
Expression analysis
Normalized log2 CPM expression values for hub lncRNAs were calculated from raw counts in TCGA-GBM tumor, TCGA-normal brain, and GTEx-normal brain sample data. Expression differences between groups were visualized using boxplots (R, ggplot2), and statistical significance was tested with Wilcoxon rank-sum and Kruskal–Wallis tests. Significance was set at P < .05.
Functional enrichment analysis
Entrez IDs of each hub-specific mRNA set were submitted to clusterProfiler (v4.10.0). Gene Ontology Biological Process (GO-BP) and KEGG pathways were considered significant at q < 0.05. Dot-plots and bar-plots of the top terms were exported as high-resolution JPEGs.
Statistical analysis and software environment
All computations were performed in R 4.4.0 on macOS 14.4 (Apple M2 Pro, 32 GB RAM). Figures were created using ggplot2 v3.5.1 and ggpubr v0.6.0.
Results
Data acquisition, normalization and quality control for downstream analysis
TCGA-GBM tumor (Primary Tumor = 372 and Adjacent Normal = 5) and GTEx data set (n = 2931 samples) were integrated, retaining 57 562 genes for transcriptomic analysis. In addition, 1881 miRNAs were used from TCGA-GBM data set (Primary Tumor = 240 and Adjacent Normal = 37) for downstream analysis. The counts for each of these genes were normalized using the edgeR-voom pipeline. To ensure robust and comparable downstream analyses, we assessed the quality and distribution of RNA-seq data following harmonization and batch correction of 3308 samples spanning 372 TCGA-GBM tumors, 5 TCGA-normal brain, and 2,931 GTEx-normal brain tissues (Figure 1A and B). As shown in Figure 1A, the sample-wise median log2-CPM values and interquartile range (IQR) were observed for mRNA/lncRNA and miRNAs between normal and brain tissues (Figure 1A to D), depicting that the distribution of log2-CPM is uniform between the different sources. A summary of the combined and harmonized data sets used for subsequent analyses is provided in Figure 1E. After filtering, a total of 57 562 genes were quantified across 3308 samples (372 TCGA-GBM tumor, 5 TCGA-normal brain and 2931 GTEx-normal brain), while 1881 miRNAs were quantified in 277 samples (240 TCGA-GBM tumor, 37 TCGA-normal brain). This indicates successful harmonization and batch correction across heterogeneous sources, resulting in comparable global expression profiles and minimized technical variation.

Assessment of RNA-seq data quality and sample distribution across TCGA-GBM and normal brain cohorts. (A) Boxplot showing the distribution of sample-wise median log2 CPM values for mRNA/lncRNA across TCGA-GBM tumor samples, TCGA-adjacent normal brain, and GTEx-normal brain tissues. Median and interquartile range (IQR) are annotated for each group. (B) Boxplot summarizing the sample-wise IQR of log2 CPM for each group, reflecting global expression variability. (C) Sample-wise median log2 CPM for miRNAs in TCGA-normal and tumor samples. (D) Boxplot of sample-wise IQR of log2 CPM for miRNAs in TCGA-normal and tumor groups. (E) Summary table of the harmonized and combined data sets, indicating the number of genes and samples for each RNA biotype and subset used in downstream differential expression analyses.
Differential expression analysis of genes between different databases
Building on these harmonized data, we applied a stepwise ceRNA workflow that combines differential expression with experimentally validated lncRNA-miRNA-mRNA interactions to pinpoint GBM-specific ceRNA regulatory triplets (Figure 2). DE analysis was performed using the limma pipeline to compare mRNAs, lncRNAs, and miRNAs between TCGA-GBM tumor and normal brain samples (TCGA and GTEx). Figure 3 shows heatmaps illustrating the distinct expression patterns of DE genes of the whole transcriptome (Figure 3A; gene-level] and significantly downregulated miRNAs across all samples (Figure 3B; miRNA-level]. While the gene-level heatmap demonstrates clear segregation between tumor and normal samples, reflecting extensive transcriptional dysregulation characteristic of GBM, the miRNA-level heatmap reveals greater heterogeneity among tumor samples, with certain tumors exhibiting expression patterns like normal. Such heterogeneity is more likely biological rather than technical, as global quality metrics (median log2-CPM, IQR) confirmed comparable data quality across cohorts (Figure 1 C and D]. Differentially expressed lncRNA, mRNA and miRNA were visualized as volcano plots (Figure 4). In the mRNA and lncRNA panels (Figure 4A and B), both upregulated and downregulated transcripts were detected in GBM, indicating broad transcriptomic reprogramming in tumors. For lncRNA DE analysis, 516 lncRNAs were upregulated, whereas 433 lncRNAs were downregulated. mRNA DE analysis revealed that 2541 mRNAs were upregulated, whereas 3097 mRNAs were downregulated. In contrast, 4 miRNAs were found to be downregulated in tumor samples in comparison with normal brain samples (Figure 4D). These findings underscore the widespread molecular alterations in GBM and support further integrative analysis of both coding and non-coding RNA classes.

Funnel overview of the GBM ceRNA workflow.

Unsupervised clustering of normalized expression data in GBM and normal brain samples. (A) Gene-level heatmap: Hierarchical clustering of z-score normalized log2 CPM expression values for all differentially expressed mRNAs and lncRNAs across TCGA-GBM primary tumor samples (orange), TCGA adjacent normal brain samples (blue), and GTEx-normal brain samples (green). Rows represent genes, columns represent samples. Distinct segregation between tumor and normal samples reflects extensive transcriptional dysregulation in GBM, while the tight clustering of normal samples highlights their relative homogeneity. (B) miRNA-level heatmap: Hierarchical clustering of z-score normalized log2-CPM values for all significantly differentially expressed miRNAs in TCGA-GBM tumors (orange) and TCGA-normal brain samples (blue). Rows represent miRNAs, columns represent samples. Increased heterogeneity is observed among tumor samples, with a subset displaying miRNA expression patterns similar to normal brain tissue, consistent with the diverse molecular subtypes of GBM. Key DE miRNAs are annotated.
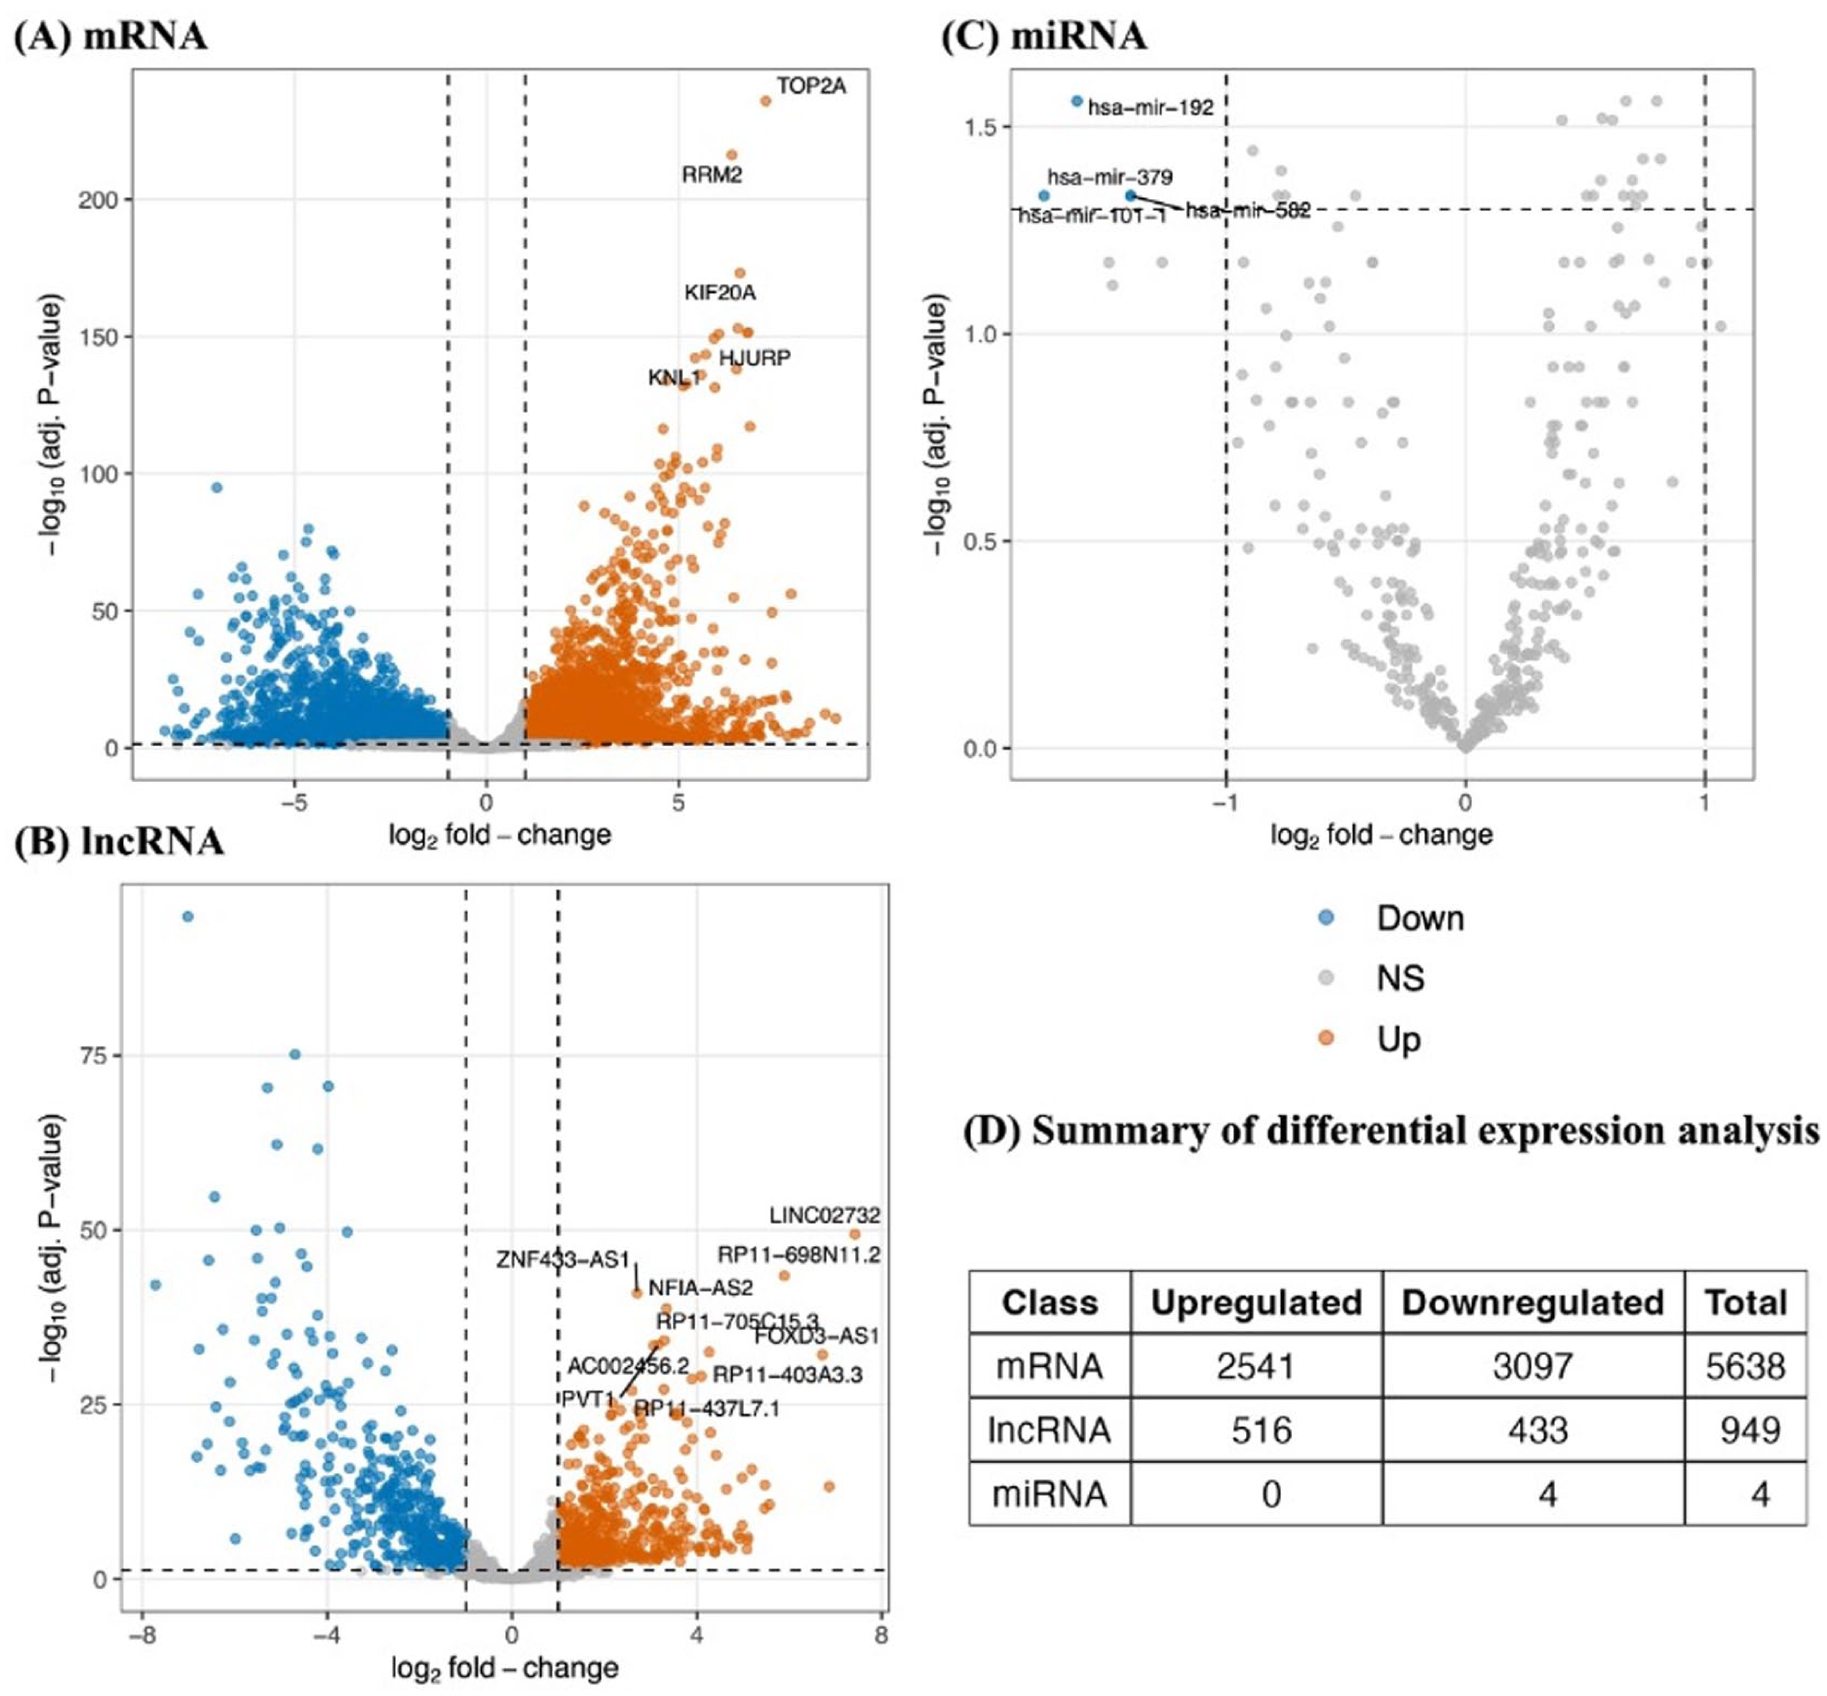
Overview of differential expression analysis in TCGA-GBM versus normal brain (TCGA-normal brain and GTEx-normal brain). Volcano plot for (A) protein-coding genes, (B) lncRNAs, and (C) miRNAs, showing log2 fold-change (x-axis) against log10 adjusted P-value (y-axis). Each point represents a transcript; colors indicate upregulation (orange), downregulation (blue), or not significant (gray), based on thresholds of log2 FC > 1 and FDR < 0.05. Top significantly dysregulated transcripts are labeled in each panel. (D) Summary table listing the total number of upregulated and downregulated transcripts detected for each RNA class using the same significance criteria as panels A-C.
The diagram tracks each major processing step from raw multi-cohort RNA-seq input (top) through normalization, differential-expression filtering, and experimental-validation layers to the final set of validated lncRNA-miRNA-mRNA triplets and prognostic hub lncRNAs (bottom).
ceRNA triplet (lncRNA -| miRNA -> mRNA) construction
After the differentially expressed genes were identified, upregulated mRNAs (Figure 5A] were overlapped with miRTarBase-validated mRNAs, yielding 1984 genes (13.1%) present in both sets. Similarly, among lncRNAs, 96 genes (9.7%) were shared between the set of upregulated lncRNAs and those supported by ENCORI (Figure 5B]. For miRNAs, only 3 downregulated miRNAs were identified as common to all 3 groups: differentially expressed, ENCORI-validated, and miRTarBase-validated sets (Figure 5 C]. The pipeline summary highlights each filtering step: from the initial pool of differentially expressed genes, through validation with ENCORI and miRTarBase, to the final intersection, resulting in a network of 12 lncRNAs, 3 miRNAs, and 262 mRNAs that assembled into 517 unique ceRNA triplets (Figure 5D]. This integrative approach maximizes both the biological relevance and experimental support of the inferred ceRNA interactions in GBM.

Construction of the GBM ceRNA network using integrated differential expression and experimentally validated interactions. (A) Venn diagram showing overlap between upregulated mRNAs in GBM and experimentally supported mRNA targets from miRTarBase. (B) Overlap between upregulated lncRNAs and ENCORI-validated lncRNAs. (C) Venn diagram illustrating the intersection of downregulated miRNAs, ENCORI-supported miRNAs, and miRTarBase-validated miRNAs. (D) Summary table of the ceRNA network construction pipeline, including the number of lncRNAs, miRNAs, and mRNAs at each filtering step and the total number of final ceRNA triplets.
Pathway enrichment analysis using GO and KEGG databases
To gain functional insights into the biological relevance of mRNAs regulated through the GBM ceRNA network, we performed pathway enrichment analysis using both GO and KEGG databases. GO biological process analysis revealed a strong enrichment for cell cycle-associated terms, including regulation of cell cycle phase transition, chromosome segregation, mitotic nuclear division, and DNA-templated replication (Figure 6A). These processes are consistent with the hyperproliferative nature of GBM and reflect the central role of post-transcriptional regulation in maintaining mitotic control. KEGG pathway enrichment further supported these findings, with top-ranked pathways including cell cycle, homologous recombination, proteoglycans in cancer, and the p53 signaling pathway (Figure 6B). These pathways underscore the involvement of ceRNA-regulated mRNAs in key tumorigenic processes such as genomic instability, extracellular matrix remodeling, and evasion of cell cycle checkpoints. Together, these data suggest that the ceRNA network plays a functional role in promoting GBM malignancy by modulating post-transcriptional regulation of genes critical to cell division and cancer progression.

Pathway enrichment analysis of mRNAs within the GBM ceRNA network. (A) GO-biological process enrichment of ceRNA-associated mRNAs. The top 15 significantly enriched terms are shown, ranked by adjusted P-value. Bar color reflects the gene ratio (ie, the proportion of mRNAs involved in each process). Prominent processes include cell cycle phase transition, chromosome segregation, and mitotic nuclear division, reflecting active proliferation and genomic instability in GBM. (B) KEGG pathway enrichment analysis of the same mRNAs. The top enriched pathways include cell cycle, homologous recombination, proteoglycans in cancer, and the p53 signaling pathway, indicating the involvement of ceRNA-regulated mRNAs in tumor progression, DNA damage repair, and cell cycle dysregulation.
Expression and survival analysis of ceRNA hub lncRNAs
We further evaluated the prognostic relevance of the lncRNAs involved in the identified ceRNA network using expression and survival analysis (Figure 7 and 8). For each lncRNA, expression (log2 CPM) was compared across TCGA-GBM tumor samples (red), TCGA-normal brain samples (blue), and GTEx-normal brain samples (green) (Figure 7). Boxplots demonstrate that lncRNAs exhibited highly significant differential expression between tumor and normal tissues. Seven out of 12 lncRNAs were markedly upregulated in tumor samples compared to both TCGA- and GTEx-normal brain tissue. This was followed by Kaplan-Meier survival analysis on 12 hub lncRNAs using TCGA-GBM primary tumor data (Figures 8 and 9). The overall survival between high- and low-expression groups was compared using log-rank tests (P-value < 0.05). Among the tested lncRNAs, MIR4435-2HG (P = .0024) and CYTOR (P = .0032) showed statistically significant differences in survival, with high expression levels associated with poorer prognosis. Notably, these lncRNAs also exhibited a significantly higher expression in GBM samples in comparison with normal tissues, warranting further functional validation and clinical exploration (Figure 8).

Expression profiles of representative ceRNA network lncRNAs across sample groups.
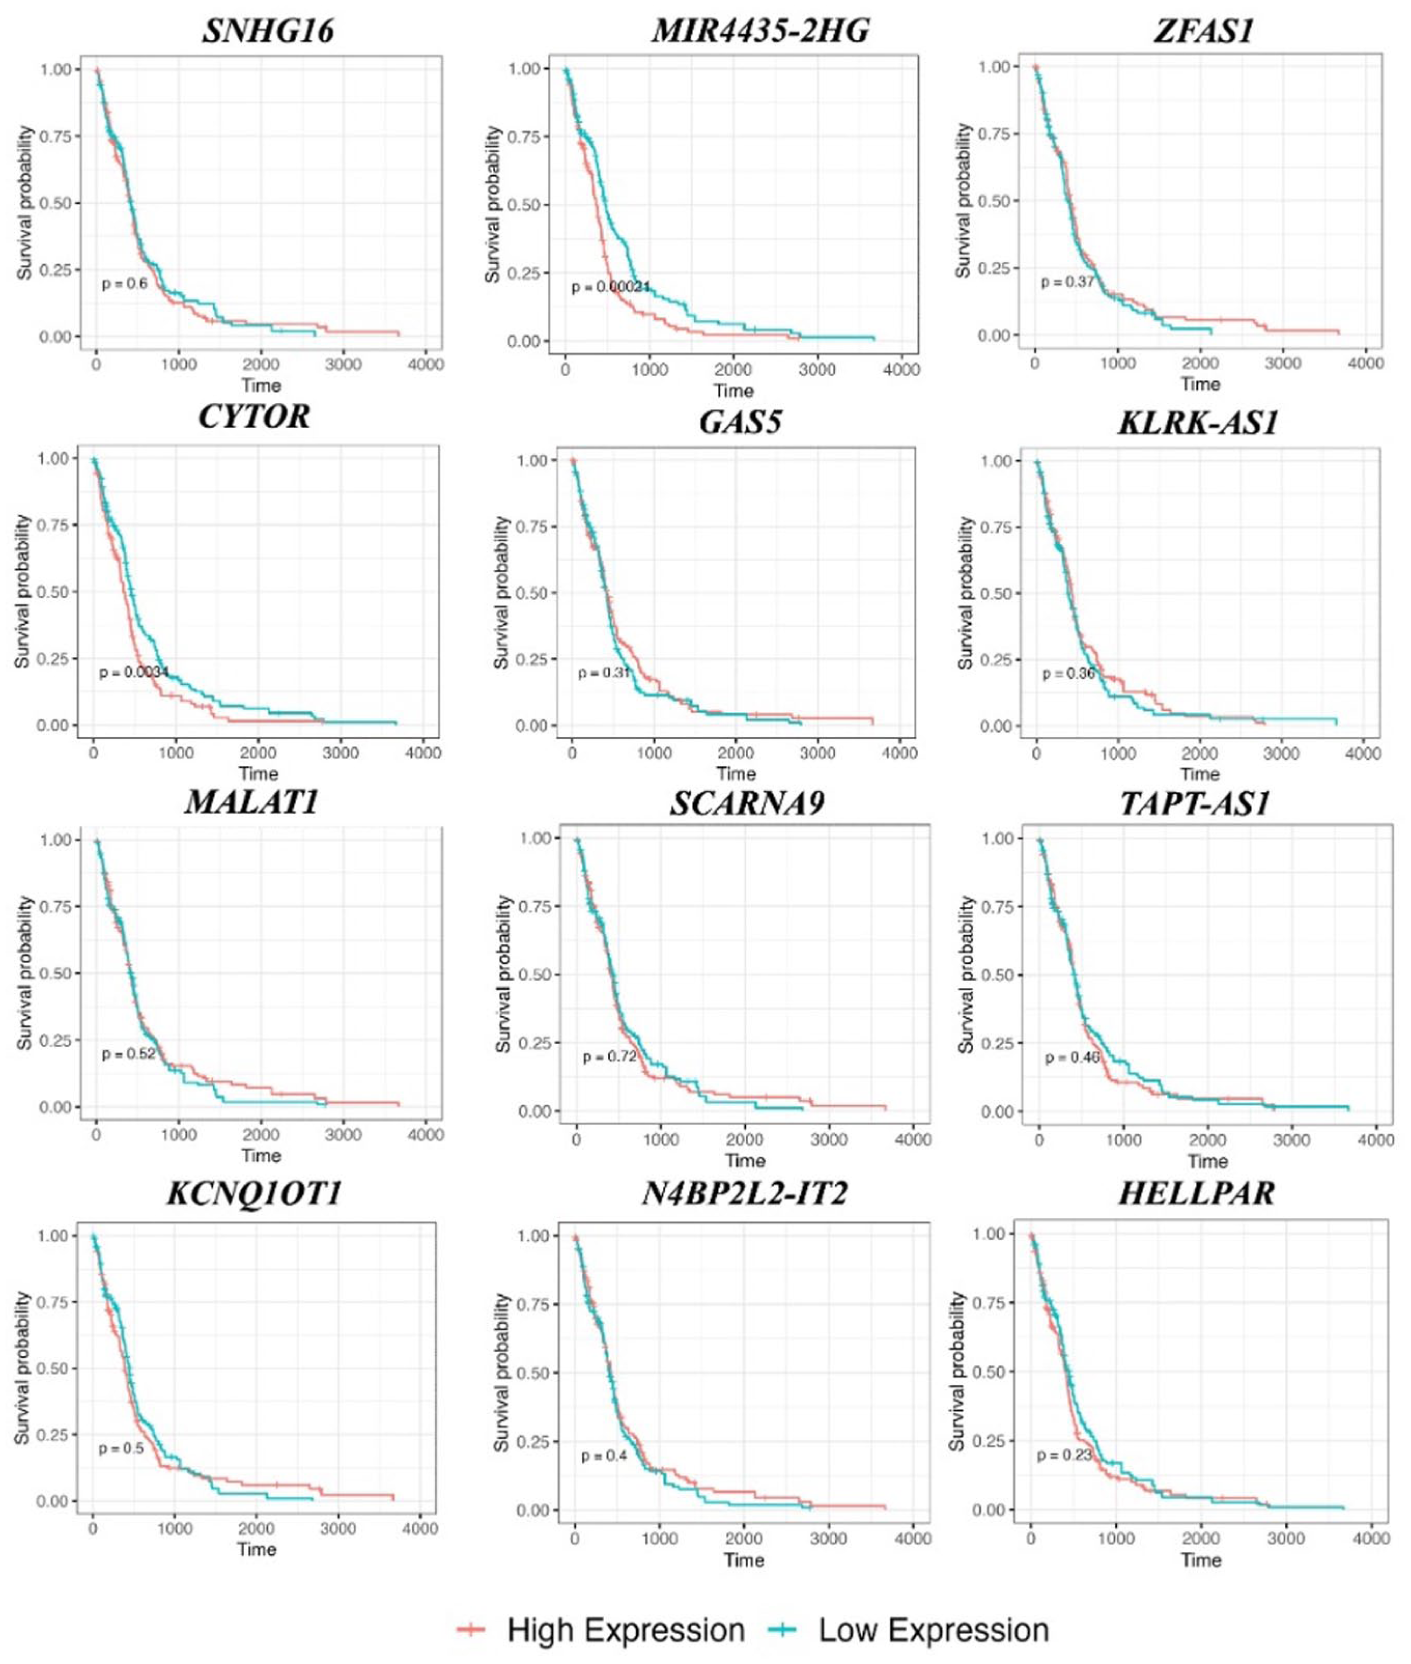
Kaplan-Meier survival curves for hub lncRNAs identified in the GBM ceRNA network.

Univariate Cox regression analysis of hub lncRNAs associated with overall survival in TCGA-GBM.
Shared mRNA regulation between hub lncRNAs (CYTOR and MIR4435-2HG) with a prognostic potential
The constructed ceRNA network revealed a notable set of mRNAs that are co-regulated by CYTOR and MIR4435-2HG (Figure 10A and Table 1). These mRNAs are targeted by the same miRNA that interact with both lncRNAs based on the experimentally validated ENCORI and mirTarBase databases, suggesting a shared regulatory axis. Functional annotation of these shared mRNA targets indicates convergence on key oncogenic pathways relevant to GBM, including cell proliferation, immune modulation, invasion, and angiogenesis. Several of these mRNAs, such as YBX1, TGFBR1, HOXA10, and CD44, have previously been implicated in GBM pathogenesis and are associated with poor patient prognosis (Table 1). STRING protein-protein interaction analysis of the 25 shared mRNA targets identified 7 experimentally supported interactions (average confidence score: 0.636), revealing functionally coherent modules centered on key oncogenic drivers. CD44 emerged as the most connected hub (3 interactions), showing strong interactions with TGFBR1 (score = 0.849) and THBS1 (score = 0.767), both critical for TGF-β signaling and extracellular matrix remodeling in GBM. A second module linked translation-related proteins METTL1, RPL7, and YBX1 (score = 0.836). While the network shows moderate overall connectivity, the clustering of interactions around established GBM drivers—including CD44 (stemness), YBX1 (mTOR/MAPK signaling), and TGFBR1 (invasion)—supports functional convergence of ceRNA-regulated targets (Figure 10B]. The dual regulation by CYTOR and MIR4435-2HG highlights these mRNAs as potential network hubs and underscores their importance as effectors of lncRNA-mediated gene regulation in GBM.

Focused ceRNA and protein-protein interaction networks for CYTOR and MIR4435-2HG in GBM. (A) The ceRNA subnetwork centers on CYTOR and MIR4435-2HG, which both interact with hsa-miR-379 targeting multiple oncogenic mRNAs. Blue, orange, and red-orange nodes represent lncRNAs, the miRNA, and mRNAs, respectively. Node size indicates biological relevance, highlighting GBM-associated targets such as YBX1, MDM4, CD44, and TGFBR1. Arrows denote regulatory direction (lncRNA → miRNA → mRNA). (B) PPI network derived from panel (A) showing hub proteins (⩾ 2 connections; red) and other interactors (blue). Edge thickness reflects interaction strength. Key hubs—TGFBR1, CD44, YBX1, THBS1, and METTL1- suggest convergence of the ceRNA axis on central oncogenic regulators in GBM.
Shared mRNA targets of CYTOR and MIR4435-2HG within the GBM ceRNA network.

Co-expression analysis between CYTOR and MIR4435-2HG in TCGA-GBM cohort
As both the lncRNAs regulated the same mRNAs and, therefore, may share a regulatory axis, we conducted a correlation analysis between these lncRNAs in TCGA-GBM tumor samples to further probe their relationship. A Pearson correlation analysis revealed a strong positive association between CYTOR and MIR4435-2HG expression (r = .846, R2 = 0.716, P < 2e−16; Figure 11). Next, the genomic location of these two lncRNAs was mapped to chromosome 2, with the exact coordinates of CYTOR being chr2:87454781-87630751 and MIR4435-2HG being chr2:111006015-111495070. This high degree of co-expression and proximity on chromosome 2 suggests potential co-regulation or shared upstream regulatory mechanisms and supports their cooperative involvement within the ceRNA network in GBM.

Correlation between CYTOR and MIR4435-2HG expression in GBM tumor samples.
Discussion
Our integrative analysis unites the largest publicly available GBM and normal-brain RNA-seq compendium to date with 2 experimentally supported interaction atlases, revealing a GBM-specific ceRNA landscape that is both experimentally anchored and clinically annotated. Consistent with the poor outcomes that still characterize GBM even after temozolomide-based chemoradiation, we found widespread transcriptomic rewiring across mRNAs, miRNAs, and lncRNAs. 1 The uniform global quality control metrics across TCGA and GTEx samples argue that these differences are overwhelmingly biological rather than technical, providing data for robust downstream network construction.
While our ceRNA network construction utilized 2 gold-standard databases (miRTarBase 2025 and ENCORI) with stringent experimental validation criteria, we acknowledge that cross-validation with additional databases such as LncBase or DIANA-LncBase could provide complementary evidence.19,53,54 However, DIANA-LncBase v3 (released 2019/2020) has not been updated in over 5 years, while our selected databases provide the most current experimentally validated interactions, with ENCORI requiring ⩾ 10 independent CLIP-seq experiments. This stringency ensures high confidence ceRNA interactions, and future validation using orthogonal databases or independent patient cohorts would further strengthen these findings.
Most published GBM ceRNA studies focus on a single lncRNA-miRNA-mRNA axis and are limited to small patient cohorts often under 200 tumors, with key findings based on cell lines or in silico predictions. This highlights the need for, and the strength of, a transcriptome-wide ceRNA approach grounded in experimental evidence, as implemented in our pipeline.12,14,15 We executed the pipeline at a population scale: 3308 brain specimens, stringent DE filters, and dual-database interaction validation (ENCORI and miRTarBase).19,54 This strategy funneled > 57 000 measured genes down to a network of 517 triplets linking 12 hub lncRNAs to 262 mRNAs through 3 repressed miRNAs. GO- and KEGG-pathway analysis revealed that mRNAs present in the ceRNA network played a role in cell cycle,- DNA-replication and p53-signalling terms, complementing the aggressiveness, unchecked proliferation and genomic instability of GBM. 3 Enrichment of homologous-recombination genes also supports emerging evidence that GBM cells exploit DNA-repair pathways to survive genotoxic stress, potentially explaining the limited durability of alkylating chemotherapy. 3 Overall, our study distills a large, well-validated data set into a concise list of lncRNA-centered ceRNA interactions that are most relevant to GBM biology and therapy development.
Among the twelve lncRNA hubs, CYTOR and MIR4435-2HG were chosen for further analysis for 4 reasons: (1) marked over-expression in tumors versus 2 normal-brain cohorts, (2) strong effect on prognosis as suggested by the survival curves, (3) co-expression (Pearson r = .85) in GBM samples, and (4) they reside ~23 Mb apart on chromosome 2 suggesting a similar upstream mechanism. Their shared repression of 3 miRNAs funnels de-repression to 25 convergent mRNA targets, including YBX1, MDM4 and TGFBR1, each with established oncogenic functions in GBM. For example, YBX1 drives mTORC1/2 activation and GBM growth, 21 while MDM4 amplification disables p53 checkpoint activity and portends poor outcome. 22 The dual-lncRNA control of these nodes suggests a “redundant safeguard” whereby loss of one sponge may be buffered by the other, suggesting the need to explore possible combinatorial lncRNA inhibition strategies. Beyond cell cycle- genes, the network captured transcripts that remodel tumor metabolism and the niche. ABHD5, a co-activator of ATGL, links lipid-droplet catabolism to energy homeostasis and has recently been tied to GBM growth under nutrient stress. 23 SPRY4, another hub-controlled lncRNA, promotes VEGFA-driven angiogenesis through a miR-101-3p/EZH2 axis, 25 while RNF144B although classically viewed as a p53-induced tumor suppressor has been reported to regulate endothelial-cell signaling and could, when over-expressed in the GBM vasculature, promote angiogenesis. 26 Together, these findings indicate that ceRNA crosstalk intersects not only intrinsic tumor-cell programs but also metabolic adaptation and pro-angiogenic cues, reinforcing that lncRNA-targeted therapies might exert multi-pronged anti-tumor effects.
The strong co-expression between CYTOR and MIR4435-2HG (r = .85, P < 2 × 10-) 16 combined with their location on the same chromosome (~23 Mb apart on chromosome 2) suggests they may be regulated together. To test whether their proximity drives coordinated expression, future studies could use chromatin conformation data (Hi-C) to see if they occupy the same regulatory neighborhoods (topologically associating domains), or ChIP-seq to identify shared enhancers or transcription factor binding sites. This would clarify whether their co-expression results from shared local regulatory elements or from responding independently to the same cancer signals. While the data sets needed for these analyses are currently limited in GBM, understanding how these 2 lncRNAs coordinate could reveal new regulatory mechanisms in glioblastoma.
Prognostic modeling underscored CYTOR and MIR4435-2HG as robust survival markers, but 5 additional hubs trended toward poorer outcome, warranting validation in prospective cohorts and functional assays. Limitations include reliance on bulk RNA seq- (unable to resolve cell-type-specific ceRNA wiring) and a lack of experimental perturbation to confirm directionality of repression. Future work should integrate single-cell or spatial transcriptomics to localize ceRNA interactions, employ CRISPR interference, siRNA or ASO knockdown to test lncRNA causality, and explore synthetic-lethal combinations that jointly disrupt multiple sponge nodes.
Beyond their roles in proliferation and survival, CYTOR and MIR4435-2HG may influence the immune microenvironment of GBM, as shown by their modulation of TGFBR1, CD44, SOCS1, and CD226. Although the central nervous system was once considered immune-privileged, recent evidence shows that GBMs are highly infiltrated by microglia and bone-marrow-derived macrophages that sustain an immunosuppressive milieu. 55 MIR4435-2HG exhibits context-dependent immune regulation: in colorectal cancer it acts as a tumor suppressor within the immune stroma, where its loss increases polymorphonuclear myeloid-derived suppressor cells and impairs fatty-acid metabolism, whereas in hepatocellular and gastric cancers it promotes M2 macrophage polarization and immune-checkpoint up-regulation (CTLA4, PDCD1), fostering immune evasion.56,57 Similarly, CYTOR has been shown to correlate with immune-cell infiltration, cytokine signaling, and checkpoint expression across multiple tumor types, including melanoma, where its expression was associated with improved response to anti-PD-1 therapy and enrichment of immune-related pathways. 58 These observations suggest that both lncRNAs could contribute to macrophage-mediated immunosuppression or checkpoint-linked immune escape in GBM. Future studies integrating immune-cell deconvolution, single-cell RNA-seq, or spatial transcriptomics will be instrumental in clarifying their roles in shaping the GBM immune landscape.
In conclusion, our population scale—experimental database-anchored ceRNA atlas nominates a concise panel of clinically actionable lncRNAs, headed by CYTOR and MIR4435-2HG, which, through pathway analysis, suggest an effect on proliferative, metabolic, and angiogenic programs in GBM. These hubs, together with their shared miRNA and mRNA partners, form a rational starting point for RNA-targeted therapeutic development and biomarker-driven patient stratification.
Footnotes
Acknowledgements
The authors thank Dr Jessie King for her assistance in proofreading the manuscript.
Ethical Considerations
Not applicable; study uses only publicly available human RNA-seq data sets (TCGA, GTEx).
Author Contributions
Funding
The authors received no financial support for the research, authorship, and/or publication of this article.
Declaration of Conflicting Interests
The authors declared no potential conflicts of interest with respect to the research, authorship, and/or publication of this article.