
Abstract
Glioblastoma multiforme (GBM) is the most common malignant brain tumor. GBM samples are classified into subtypes based on their transcriptomic and epigenetic profiles. Despite numerous studies to better characterize GBM biology, a comprehensive study to identify GBM subtype-specific master regulators, gene regulatory networks, and pathways is missing. Here, we used FastMEDUSA to compute master regulators and gene regulatory networks for each GBM subtype. We also ran Gene Set Enrichment Analysis and Ingenuity Pathway Analysis on GBM expression dataset from The Cancer Genome Atlas Project to compute GBM- and GBM subtype-specific pathways. Our analysis was able to recover some of the known master regulators and pathways in GBM as well as some putative novel regulators and pathways, which will aide in our understanding of the unique biology of GBM subtypes.
Keywords
Introduction
Glioblastoma multiforme (GBM) is the most lethal form of brain cancer with a median survival of 14 months.1,2 There have been numerous studies to generate high-throughput datasets to better understand and characterize these tumors at the genomic, genetic, and epigenetic levels.1,3–8 Among these studies, The Cancer Genome Atlas Project (TCGA) has generated a vast amount of genomic data for about 500 GBM samples.5,7
GBM samples are classified into molecular subtypes based on their transcriptomic and epigenetic profiles. Verhaak et al classified GBM samples based on gene expression into four subtypes, namely classical, mesenchymal, neural, and proneural. 7 GBM samples are further classified into two major subtypes based on their DNA methylation profiles, namely glioma-CpG island methylator phenotype (G-CIMP) positive and G-CIMP negative. 8 A majority of the G-CIMP positive samples are also proneurals, 8 which allows splitting proneural group into proneural G-CIMP positive and proneural G-CIMP negative subtypes (hereafter, proneural+ and proneural-, respectively).
Various studies have characterized GBM subtypes based on individual mutations, genetic alterations, and pathways associated with each subtype. Specifically, in mesenchymal subtype, genes in the tumor necrosis factor superfamily pathway and NF-kB pathway, such as TRADD, RELB, and TNFRSF1A are highly expressed. 7 In classical samples, genes in Notch (NOTCH3, JAG1, and LFNG) and Sonic hedgehog (SMO, GAS1, and GLI2) signaling pathways are highly expressed. 7 Also, EGFR amplification is common in both neural and classical samples. 7 In proneural+ samples, IDH1 mutation is common. 9
Several studies have evaluated the master regulators of GBM subtypes. Carro et al reported CEBP and STAT3 as the master regulators of the mesenchymal subtype. 10 Bhat et al also reported mesenchymal-specific regulators such as MAFB, HCLS1, TAZ, and YAP. 11
Despite these findings, there is still no study that gives a comprehensive report of GBM- and GBM subtype-specific master regulators, regulatory networks and pathways. In this study, we have two main objectives: (i) to compute GBM-and GBM subtype-specific master regulators and regulatory networks of GBM at the transcriptional level, (ii) to compute GBM- and GBM subtype-specific pathways. We used two different pathway enrichment algorithms and looked at the overlapping significantly enriched pathways for each GBM subtype. We also used FastMEDUSA to compute putative master regulators and regulatory networks of each subtype. Our analysis identified some existing master regulators and putative novel regulators of each GBM subtype. We also identified several GBM- and GBM subtype-specific pathways. Our results provide testable hypotheses to further investigate potential therapeutic targets for GBM subtypes.
Materials and Methods
Preprocessing of Expression Dataset
We downloaded the TCGA exon expression level 3 dataset of 500 GBM and 10 normal brain tissue samples at TCGA Data Portal (https://tcga-data.nci.nih.gov/tcga, accessed in March 2012). We obtained the molecular subtype and G-CIMP calls of these samples from the data freeze package by TCGA analysis working group (https://wiki.nci.nih.gov/download/attachments/39921481/dataFreeze_9_3_2011.tar.bz2?version=1&modificationDate=1315077027000). We filtered out 61 samples that were reference samples or samples without an assigned subtype. We filtered out about 600 low-signal genes whose log-transformed signal intensity was less than 4. We also detected samples that were either outliers within their subtype or had similar expression profiles to the samples of another subtype. To detect these samples, we computed pairwise Pearson correlation between the expression profiles of all samples and removed 87 samples, which had
Analysis of gene Expression Dataset
We performed batch effect control based on two covariates, namely
Computing Significant Pathways and IPA Networks
We utilized QIAGEN's Ingenuity® Pathway Analysis (IPA®, QIAGEN Redwood City, www.qiagen.com/ingenuity) and Gene Set Enrichment Analysis (GSEA)
13
tools to compute GBM- and GBM subtype-specific significant pathways. GSEA is a computational method to determine whether an a priori defined set of genes with an interpretable function shows statistically significant differences between two biological states.
13
We ran GSEA using GBM expression dataset to identify upregulated and downregulated expression signatures associated with individual subtypes. The source of the gene sets used in this study was the c2.all.v3.0.symbols.gmt collection from the Broad Institute Molecular Signatures Database (http://www.broadinstitute.org/gsea/msigdb/collections.jsp#C2), which contains canonical pathways; gene sets derived from experimental data with chemical and genetic perturbation, as well as gene sets derived from the reactome pathway database (www.reactome.org). All comparisons of the five subtypes were performed by mapping all gene sets with size ranging from 10 to 500 in MsigDB v3.0 c2 curated database to the ranked gene expression profiles. The enrichment scores were calculated by walking down the ordered list, and the statistical significance of nominal
To analyze data in IPA, we uploaded the DEGs with fold changes for each subtype as input. After running the core analysis, we selected canonical pathways that were statistically significant (FDR ≤0.05). Then, we computed the overlap between significant pathways computed by GSEA and IPA. Computing common pathways between IPA and GSEA outputs was not straightforward since pathway nomenclature is different in these two systems and gene lists in proprietary IPA pathways are not readily available. Thus, we developed a pipeline to compare the results. First, we exported the list of DEGs that were present in each significant IPA pathway (IPA does not allow to export all genes in pathways but does allow to export DEGs). We also obtained a list of all genes in significant GSEA pathways. We first converted all gene names to HUGO gene symbols, then compared gene sets of each GSEA and IPA pathway pair-wise. We selected pathway matches whose overlap comprised 50% of genes in GSEA and 25% of DEGs in IPA pathways for manual verification. During manual verification, we eliminated false positive matches.
To further annotate overall relationship between some genes based on literature, we also built IPA networks using these genes. Given a set of input genes, IPA uses a heuristic algorithm to construct networks iteratively while optimizing the interconnectivity and number of input genes in the network under a constraint of a maximal network size, which is 35 by default. IPA first builds networks from input genes iteratively based on their connectivity, then merges these networks and grows them to the maximum size by adding other genes in its global network iteratively.
Computing Significant Master Regulators and Gene Regulatory Networks
We utilized FastMEDUSA 14 to compute significant transcription factors (TFs) and TF–gene interactions that were common and unique to each GBM subtype. FastMEDUSA is a machine learning algorithm that builds a predictive model based on the expression states of genes and motif presence in their promoter regions. 14 FastMEDUSA incorporates discretized gene expression, promoter sequence data, and a list of candidate TFs as input. We obtained the list of candidate TFs from Genomatix software (Genomatix, www.genomatix.de). We obtained 1000 bases upstream of 5′ UTR of genes from University of California, Santa Cruz (UCSC) Genome Browser database. 15 For the genes that did not exist in UCSC genome browser, we obtained their promoter sequences from Genomatix and Biomart. 16
To discretize gene expression data, we computed fold change of expression signal of a gene in a sample to the gene's median expression across normal samples. We called a gene in a sample

Venn diagram for (
We first ran FastMEDUSA with cross-validation mode to determine a number of optimal boosting steps. We set the number of boosting iterations to 1300 as it was optimal based on the error ratio curve that was obtained to predict the expression state of the test set (Supplementary Fig. 2). Then, we ran FastMEDUSA five times on the entire data for 1300 iterations and selected top significant TFs as following: for each FastMEDUSA run, we computed the significance score of each TF by computing the prediction score of genes of interest on the original model and on the model after removing that TF and all subtrees rooted by that TF as described before. 18 TFs were ranked by their maximum prediction score, which was computed by adding up all scores of nodes containing the TF, and top 30 TFs were selected. Among the top 30 TFs, the ones with a ratio of their prediction score to their maximum score higher than 0.35 were chosen as the top TF list of that FastMEDUSA run. Finally, TFs that were in the top list in three out of five FastMEDUSA runs were selected as the final significant TF list.
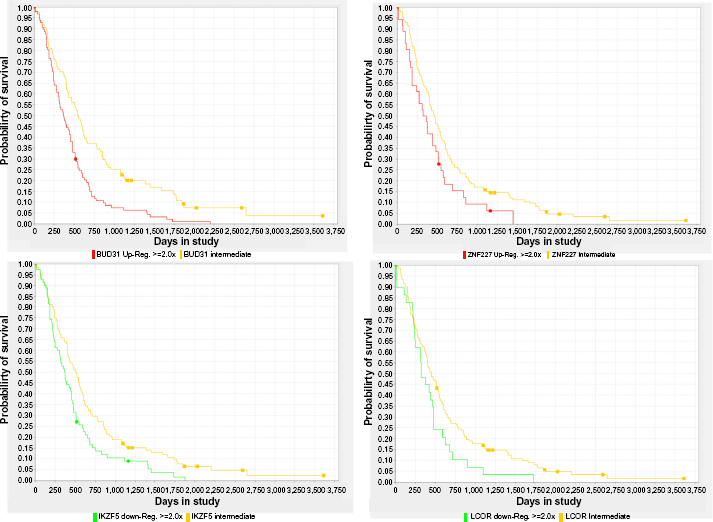
Kaplan–Meier survival plots based on the expression status of four master regulators of GBM subtypes computed by FastMEDUSA. Each regulator name is below the survival plot. Log-rank
Assuming that the majority of TFs would be positively correlated with their downstream target, we computed prediction score of upregulated (downregulated) TFs by choosing upregulated (downregulated) DEGs as target genes of interest. In order to compute gene regulatory networks, we computed the same score for each TF–gene pair in each subtype and filtered out the low-scored pairs and plot the remaining TF-gene pairs in Cytoscape. 19 We used NIH Biowulf cluster to run FastMEDUSA in parallel. We used 200–300 cores and got the results for each run in about 13 hours.
Survival Analysis
To further explore potential master regulators of GBM subtypes, we used REMBDRANDT (https://caintegrator.nci.nih.gov/rembrandt/home.do) to check survival of GBM patients based on the expression status of these TFs. TFs that stratify patients in low and high survival groups based on their expression could be potential biomarkers. We chose a twofold change threshold to determine the expression category of genes and chose the maximum intensity probe to determine the expression of the gene.
Gene Ontology (GO) Enrichment Analysis
We used DAVID's functional annotation chart 20 pipeline to compute the GO term enrichment of genes in gene regulatory networks computed by FastMEDUSA. We chose GOTERM_BP_FAT, GOTERM_CC_FAT, and GOTERM_MF_FAT categories in DAVID, which refers to biological process, cellular component, and molecular function, respectively. We applied Benjamini Hochberg FDR ≤0.05 as threshold to select significant GO terms.
Results
Removing Batch Effect and Computing DEGs
We computed the source of variation in the expression data by establishing a three-way ANOVA model, where subtype, institution ID, and batch ID were the covariates. We found out that 4.94% of the variation was due to the batch ID, and the source of variation due to institution ID was negligible (Supplementary Fig. 3). We removed batch effect that was due to the batch ID by using the batch effect removal module in Partek Genomics Suite. We applied one-way ANOVA to compute DEGs for each subtype with respect to normal samples using Partek (FDR ≤0.05 and fold change = 1.5). Figure 1 shows the Venn diagram of upregulated and downregulated genes for each subtype.
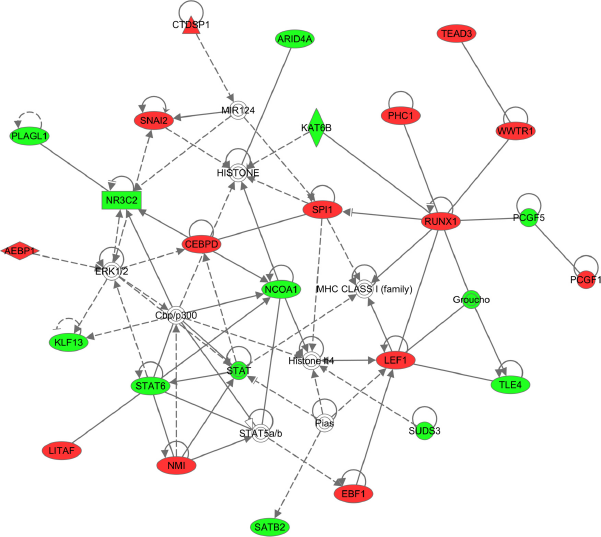
IPA network built from master regulators of GBM subtypes computed by FastMEDUSA. Colored nodes are the master regulators (Red: upregulated, Green: downregulated).
Subtype-specific Master Regulators Computed by FastMEDUSA
In order to run FastMEDUSA, we first excluded DEGs that were differentially expressed in all subtypes. For the remaining DEGs, we obtained 1000 bases upstream of their 5′ UTR from UCSC Genome Browser database. For about 30 genes whose promoter sequences were not available in UCSC Genome Browser database, we obtained their promoter sequences from Genomatix and BioMart. In total, we had promoter sequences of 5141 out of 5167 DEGs. Among these DEGs, 499 of them were used as candidate TFs based on Genomatix annotation.
We ran FastMEDUSA five times with a unique random seed each time and obtained five different models. We post-processed these models to compute significant TFs (ie, master regulators) (see Materials and Methods section). The lists of significant upregulated and downregulated master regulators for each subtype are shown in Tables 1 and 2, respectively. Among these TFs, some of them are known previously to have a role in GBM such as CEBPD, 21 RUNX1, 21 LEF1, 22 HES6, 23 ASCL1, 24 EBF1,25,26 SP100, 27 and AEBP1. 28 To check the effects of these TFs on survival, we computed survival plots of these TFs based on GBM gene expression data in REMBRANDT database and found out that some of these TFs have significant survival difference based on their expression status (Fig. 2 and Supplementary Fig. 4).

Gene regulatory network of mesenchymal subtype computed by FastMEDUSA. The network shows the association of upregulated TFs with upregulated gene. Each rectangle node is a TF and each oval node is a gene. The width of the edge is proportional to the TF–gene significance score. The inset figure shows the zoomed view of central area.
List of upregulated master regulators for each GBM subtype.

List of downregulated master regulators for each GBM subtype.

To examine biological relationship among these TFs based on literature, we uploaded the master regulators into IPA and ran core analysis to build networks from these regulators. The top-scoring network was associated with functions of gene expression, cellular function and maintenance, and cellular growth and maintenance (Fig. 3).
Subtype-specific Gene Regulatory Networks
We also computed TF–gene significance score and computed gene interaction networks (see Fig. 4 for the mesenchymal subtype and Supplementary Figs. 5–8 for the other subtypes). We observed that some of the hub TFs (ie, TFs with high connectivity) in these networks were also master regulators (eg, RUNX1, SP1, and HES6). There were also some hub TFs that were not in the master regulator list, but occurred in all networks, particularly STAT5A and WWTR1.
We checked the functional enrichment of genes in each network and plotted the enrichment

Heatmap of GO term enrichment of genes in FastMEDUSA gene regulatory networks. Only the significant
To further annotate these genes, we also uploaded them into IPA and examined networks with similar functions as found by GO terms. The network for the mesenchymal subtype is shown in Figure 6 and other networks are shown in Supplementary Figure 9.

IPA network built from genes in gene regulatory network of the mesenchymal subtype. Colored nodes are the genes in the mesenchymal gene regulatory network (Red: upregulated, Green: downregulated).
Identify Abnormal Pathways in GBM Subtypes by IPA and GSEA analysis
We ran IPA core analysis on DEGs of TCGA gene expression dataset with respect to normal samples and found 246 canonical pathways that were statistically significant in at least one subtype (FDR ≤0.05). There were 157, 177, 225, 154, and 105 canonical pathways enriched in classical, neural, mesenchymal, proneural- and proneural+ samples, respectively (Supplementary Table 1). We also computed IPA networks that have enrichment of DEGs. Some of these networks contained significant TFs found by FastMEDUSA (Supplementary Fig. 10).
We also ran GSEA on the gene expression dataset. Figure 7 shows the number of shared upregulated and downregulated pathways found in each subtype. We observed that mesenchymal and proneural- groups had about 100 unique significant upregulated pathways. The majority of downregulated pathways were shared by all subtypes, whereas there were only nine upregulated pathways shared by all subtypes.

Venn diagram of (A) upregulated and (B) downregulated GSEA pathways enriched in GBM subtypes (
We compared IPA and GSEA pathway results to find common pathways. In this comparison, we tended to use a less-stringent threshold for each subtype (

Venn diagram of number of common pathways of each subtype. Common pathways are the significant pathways found by both GSEA and IPA.
Number of subtype-specific significant pathways in IPA and GSEA, and number of common significant pathways. The last row shows the number of pathways common to both IPA and GSEA.

The list of significant common pathways found by GSEA and IPA and that were significantly enriched in all subtypes. The pathway names in GSEA database are listed.

There were 15 significant pathways uniquely enriched in the mesenchymal subtype (Table 5). All these pathways except for KEGG_VEGF_SIGNALING_PATHWAY were upregulated. We observed that immune response-related pathways comprised the vast majority of the list as in the mesenchymal gene-regulated network computed by FastMEDUSA. The higher rate of immune response activity in mesenchymal GBMs has been reported recently. 29 The VEGF signaling pathway was enriched in the mesenchymal subtype uniquely. VEGF activity is associated with angiogenesis, 30 which was one of the GO terms associated with mesenchymal gene networks in FastMEDUSA results (Fig. 5). There were also apoptosis-related pathways.
List of significant common pathways found by IPA and GSEA that were enriched in mesenchymal subtype only.

Two pathways, namely BIOCARTA_STRESS_PATHWAY and ST_INTEGRIN_SIGNALING_PATHWAY were enriched uniquely in the classical subtype. The BIOCARTA_STRESS_PATHWAY, which was upregulated in the classical subtype, involves two cell surface receptors, TNFR1 and TNFR2, to regulate apoptotic pathways 31 and activate stress-activated protein kinases. 32 The ST_INTEGRIN_SIGNALING_PATHWAY, which was downregulated in the classical subtype, involves integrins as primary sensors of the extracellular matrix (ECM) environment for cell migration, growth, and survival. 33
In the neural subtype, BIOCARTA_SHH_PATHWAY, BIOCARTA_TCR_PATHWAY, and KEGG_FC_EPSILON_RI_SIGNALING_PATHWAY were uniquely and significantly downregulated, and KEGG_ONE_CARBON_POOL_BY_FOLATE pathway was upregulated. In the BIOCARTA_SSH_PATHWAY, Sonic HedgeHog (SSH) plays a distinct and crucial role in development such as proliferation of neuronal precursor cells in the developing cerebellum and other tissues.34,35 The BIOCARTA_TCR_PATHWAY (T-cell receptor pathway) plays a key role in the immune system. The KEGG_FC_EPSILON_RI_SIGNALING_PATHWAY (Fc epsilon RI-mediated signaling pathway) in mast cells are initiated by the interaction of antigen (Ag) with IgE bound to the extracellular domain of the alpha chain of Fc epsilon RI. The activated mast cells release especially histamines and heparin. Genes in the neural gene regulator network were enriched in GO terms related to hemopoiesis, which is modulated by histamine receptor signaling. 36 The KEGG_ONE_CARBON_POOL_BY_FOLATE pathway is in the category of metabolic pathways. Metabolic process-related GO terms were enriched in genes in neural gene regulatory network.
In the proneural- subtype, KEGG_MISMATCH_REPAIR, KEGG_PYRIMIDINE_METABOLISM, REACTOME_ACTIVATION_OF_THE_PRE_REPLICATIVE_COMPLEX, and REACTOME_G2_M_CHECKPOINTS pathways were uniquely and significantly upregulated. The KEGG_MISMATCH_REPAIR and the REACTOME_G2_M_CHECKPOINTS pathways play a key role in correcting DNA mismatches during DNA replication, thus maintains genomic stability. The REACTOME_ACTIVATION_OF_THE_PRE_REPLICATIVE_COMPLEX is associated with initiation of DNA replication, and the KEGG_PYRIMIDINE_METABOLISM pathway has been studied in human gliomas for its relation to chromosomal aberrations. 37
In proneural+ subtype, REACTOME_DOUBLE_STRAND_BREAK_REPAIR and BIOCARTA_KERATINOCYTE_PATHWAY were uniquely enriched. REACTOME_DOUBLE_STRAND_BREAK_REPAIR pathway, which has a key role in DNA repair, was upregulated, and BIOCARTA_KERATINOCYTE_PATHWAY, which has a role in inducing differentiation and inhibiting apoptosis, was downregulated.
Discussion
In this work, we analyzed the gene expression dataset of TCGA GBM samples to compute master regulators and gene regulatory networks for each subtype, namely classical, mesenchymal, neural, proneural+, and proneural-. We also performed pathway analysis by using GSEA and IPA. We found some master regulators that are known previously to play a role in GBM biology, as well as some other potentially important regulators. In pathway analysis, we focused on subtype-specific and GBM-specific pathways by taking the intersection of IPA and GSEA results.
We ran FastMEDUSA five times on the expression and promoter sequence dataset to compute master regulators and gene regulatory networks for each subtype. Some of the master regulators were reported to play a role in GBM biology, such as CEBPD, 21 RUNX1, 21 LEF1, 22 HES6, 23 ASCL1, 24 EBF1,25,26 SP100, 27 and AEBP1. 28 Some of the master regulators were common to several subtypes; for instance, BUD31, EN2, LTF, and RUNX1 were computed as a master regulator for each subtype except for proneural+, UXT was a master regulator for proneural—, proneural+, and neural subtypes only, and PRIC285 was a master regulator for classical and mesenchymal subtype only. There were also subtype-specific master regulators. For instance, HES6 was a master regulator for proneural+ subtype (Table 1) and it was also a hub TF in the gene regulatory network of proneural+ subtype (Supplementary Fig. 8). HES6 expression is known to be associated with proneural group (Supplementary Fig. 11) and could play a role in cell proliferation and migration. 23
Gene regulatory networks computed by FastMEDUSA do not necessarily demonstrate direct interactions between TFs and genes. Due to the complexity of GBM biology, and high dimensionality and noise of the data, FastMEDUSA gene regulatory networks are not completely accurate. However, these networks would give an overall representation of the subtype biology. For instance, we observed that some of the hub TFs in these networks were also identified as master regulators (Table 1, Fig. 4, Supplementary Figs. 5–8). We used IPA to retrieve existing literature data to build networks from these genes in these regulatory networks (Fig. 6 and Supplementary Fig. 9). We also observed that the GO term enrichment of these networks recapitulate the overall subtype biology. Thus, we believe that FastMEDUSA gene regulatory networks encode a significant number of useful interactions that merit further experimental validation.
There were two TFs, STAT5A and WWTR1, that were not reported as master regulators, but were hub TFs in all gene regulatory networks. WWTR1 (TAZ) has a role in regulating the mesenchymal differentiation in GBMs 11 and has been reported as master regulator of glioblastoma in a previous computational study, 38 and STAT5 is known to regulate glioma cell invasion. 38 Another interesting TF was TLE3, which was a hub TF in proneural+ gene regulatory network (Supplementary Fig. 8). TLE3 (transducin-like enhancer of split 3) encodes a transcriptional co-repressor protein that belongs to the transducin-like enhancer family of proteins. Its expression is known to be associated with sensitivity to taxane treatment in ovarian carcinoma. 39 There is no current study to discuss the association of TLE3 with proneural+, so it merits the further exploration of the role of TLE3 in proneural+ biology.
Performing pathway analysis in GSEA and IPA and taking the intersection of the findings, we found some GBM-and GBM subtype-specific pathways. As expected, we found glioma and notch signaling pathways as GBM specific. We also observed that the methylation subtype was enriched in immune response-related pathways as reported recently. 29 The proneural+ group was enriched in DNA repair-related pathways, which could explain the better survival of proneural+ samples. 8 The pathway analysis did not reveal a clear unique pathway for classical samples. This could be because classical samples could be split into the remaining subtypes found by Verhaak et al 7 when the classification scheme by Phillips et al. 40 is followed. 41
Author Contributions
Conceived and designed the experiments: SB, AL, HAF. Analyzed the data: SB, AL, MB, HAF. Wrote the first draft of the manuscript: SB. Contributed to the writing of the manuscript: AL, MB, HAF. All authors reviewed and approved of the final manuscript.