
Abstract
Moyamoya disease (MMD) is a rare, chronic cerebrovascular disorder of uncertain etiology. Although abnormal glucose metabolism has been implicated, the contribution of glycosylation-related genes in MMD remains elusive. In this study, we analyzed 2 transcriptome data sets (GSE189993 and GSE131293) from the Gene Expression Omnibus (GEO) database to identify 723 differentially expressed genes (DEGs) between MMD patients and controls. Intersection genes with known glycosylation-related genes underwent Gene Ontology (GO) and Kyoto Encyclopedia of Genes and Genomes (KEGG) enrichment analyses. We utilized machine learning to select key hub genes, followed by immune cell infiltration and correlation analyses. In-depth immune cell analysis indicated that both CFP and MGAT5B were closely tied to various immune components, suggesting potential crosstalk between glycosylation pathways and immune regulation. Notably, CFP was positively associated with pDCs, HLA, and CCR, whereas MGAT5B correlated with B-cells, check-points, and T helper cells but showed a negative relationship with Tregs, hinting at an immunoregulatory mechanism influencing MMD progression. Motif-TF annotation highlighted csibp_M2095 as the motif with the highest normalized enrichment score (NES: 6.57). Reverse microRNA (miRNA)-gene prediction identified 75 miRNAs regulating these focus genes, along with 126 miRNA-miRNA interconnections. Connectivity Map (Cmap) analysis revealed that Chenodeoxycholic acid, MRS-1220, Phenytoin, and Piceid were strongly negatively correlated with MMD expression profiles, suggesting potential therapeutic candidates. Enzyme-linked immunosorbent assays confirmed elevated CFP and MGAT5B and reduced PTPN11 in MMD, aligning with our bioinformatic findings. Moreover, PTPN11 knockdown in human brain microvascular endothelial cells (HBMECs) significantly enhanced tube formation, indicating a role in vascular remodeling. Collectively, these results emphasize the importance of glycosylation-related genes and immune dysregulation in MMD pathogenesis. These findings broaden our understanding of MMD’s underlying mechanisms and underscore the necessity of continued research into glycosylation-driven pathways for improved disease management.
Introduction
Moyamoya disease (MMD) is a rare and chronic cerebrovascular disorder presented with stenosis or obstruction of the supraclinoid internal carotid artery and moyamoya-like vessel network at the skull base. 1 This uncommon cerebral vascular disease has a higher prevalence in East Asia descendants and shows an increasing prevalence and incidence in either East Asia countries or the United States. 2 Clinical symptoms include ischemic and hemorrhagic strokes, transient ischemic attack, speech disorders, sensory disorders, and intellectual disability were common in patients of MMD, according to a study based on national registry data in Japan. 3 However, the detailed mechanisms of the MMD occurrence and progression remain unclear, which caused the lack of effective diagnostic biomarkers and therapeutic targets for MMD. 1 The pathological findings from an autopsy case of MMD showed a narrowed lumen, fibrocellular intimal thickening, which is composed of smooth muscle cells. 4 Recent studies revealed that upregulated cytoskeletal proteins promoted endothelial proliferation and angiogenesis, which induced the abnormal vascular formation in MMD. 5 But the underlying mechanisms remain to be clarified.
Glycosylation is a form of protein modification in the biological process that adds sugar chains into macromolecules including proteins, DNA, and lipids, which leads to the mutation or inactivation of the modified molecules. 6 Abnormal glycosylation in cancer could affect key processes related to tumor progression and metastasis, which might induce malignant phenotypes.7,8 The characteristic glucose hypometabolic pattern in MMD patients with vascular cognitive impairment was reported, which indicated that abnormal brain glucose metabolism was related to cognitive impairment in MMD. 9 Previous studies have reported the association between dysregulated lipid and glucose metabolism with MMD. Non-targeted gas chromatography-mass spectrometry was performed to identify differently expressed serum metabolites in MMD, including L-isoleucine and urea. 10 Moreover, lipidomic analysis also found that levels of complex membrane glycosphingolipids are decreased in MMD. 11 Moreover, glycosylation-related genes were associated with immune infiltration, 12 which was dysregulated and involved in the pathogenesis of vascular stenosis in MMD. 13 However, the expression and role of glycosylation-related genes in MMD has not been studied.
Here, we attempted to identify the potential relationship between glycosylation and MMD to reveal the role of glycosylation in the pathogenesis of MMD. We hypothesized that differential expression of glycosylation in MMD compared with controls might involve the pathogenesis of MMD abnormal vascular stenosis in several ways including immune dysfunction and interaction with other related genes. We used the least absolute shrinkage and selection operator (LASSO) regression and support vector machine (SVM) algorithm to identify the glycosylation-related signature in MMD. We identified the association between focus genes and immune infiltration in MMD. The signaling pathways and the transcription regulation analyses were also applied to explore the role of focus genes in MMD. Moreover, we studied the correlation between focus glycosylation-related genes and MMD-related genes from the GeneCards database (https://www.genecards.org/). The study explored the association between glycosylation and MMD for further study. The systematic analyses provide novel and complete insights into the molecular pathology mechanisms of MMD.
Methods
Data acquisition
The study has been approved by the Ethics Committee of Beijing Tiantan Hospital (KY-2023-2024-02). Microarray databases including 2 transcription profiles (GSE189993 and GSE131293) were downloaded from the NCBI GEO database (https://www.ncbi.nlm.nih.gov/geo/). The matrix data file of GSE189993, annotated as GPL16999, included the expression profile data of 32 participants (21 MMD patients and 11 non-MMD patients), which was obtained from samples of the middle cerebral artery (MCA). The matrix file data file of GSE131293, annotated as GPL570, consisted of 3 MMD patients and 3 healthy controls. The transcription profile was obtained from the vascular smooth muscle cells (VSMCs) differentiated from induced pluripotent stem cells (iPSCs) of each participant. Cell differentiation of VSMCs was performed using neural crest stem cells differentiated from the feeder-free iPSCs with a modification of the culture medium composition, which could better mimic the pathology changes of MMD. 14 We used the “Combat” function for controlling batch effects, which was a common method in the R package SVA for adjusting the data of different batches. Principal component analysis (PCA) demonstrated that the batch effect among the microarrays was reduced after correction using the R package SVA.
Differential expression analysis
We performed differential expression analysis using the R package “Limma” to identify the differentially expressed genes (DEGs) with the values of P < .05 and |log2FC| > 1 between MMD and controls. Volcano maps and clustering heatmaps were applied to visualize the differences by the R packages “ggplot2.” In total, 317 glycosylation-related genes were obtained from the GeneCards database (https://www.genecards.org/) after selecting the genes with a relevance score >5. We took the intersection between DEGs and glycosylation-related genes for subsequent analysis.
Functional enrichment analysis
We performed functional enrichment analysis on differentially expressed glycosylation-related genes in MMD using the R package “ClusterProfiler” based on the Gene Ontology (GO) database and the Kyoto Encyclopedia of Genes and Genomes (KEGG) database. The P-values and q-values of less than .05 were considered to be statistically significant.
Focused gene selection using least absolute shrinkage and selection operator regression and support vector machine algorithm
The LASSO regression and SVM algorithm were used to select focus genes as potential diagnostic biomarkers of MMD. We performed LASSO regression by the R package “glmnet” and constructed an SVM model using the R package “e1071.” The statistical approach of LASSO regression was set as family = “guassian.” And we used 10-fold cross-validation, with the seed number set to 10. Support vector machine-recursive feature elimination (SVM-RFE), as a machine learning algorithm, was used to remove feature vectors to obtain the best vector. We performed the SVM algorithm with 5-fold cross-validation. The number of features is selected as 100, and the number of seeds is set as 10.
Immune cell infiltration analysis
We quantified the immune cells in the transcription profiles and deduced the relative proportions of the 29 kinds of immune cells with the single-sample gene set enrichment analysis (ssGSEA) algorithm. Moreover, we identified the correlation between the expression level of the focus genes and immune cell proportion with the Spearman correlation analysis.
Gene set enrichment analysis of the expression profile
Gene set enrichment analysis (GSEA) was used to analyze the enriched gene sets and rank enriched genes by their differential expression levels between comparison groups. We compared the differences in the signal pathway between the high-expression group and low-expression group to explore the molecular mechanisms of focus genes in MMD with GSEA. The number of phenotype substitutions was set to 1000, and P < .01 was considered to be significant.
Transcription regulatory analysis of focus genes
The R package “RcisTarget” was used to predict the transcription factors of focus genes. All the calculations in the package “RisTarget” were based on motif. Moreover, we inferred further annotation files according to the gene sequences and the similarity of motifs. We calculated the area under the curve (AUC) of each pair of motif-motif sets and obtained the normalized enrichment score (NES) of each motif.
Construction of microRNA network of focus genes
We predicted the miRNA targeting the focus genes to identify the regulation mechanisms in MMD based on the miRcode database. Moreover, we identified whether there were some miRNAs regulating the transcription or degradation of focus genes. We visualized the miRNA network using the software Cytoscape.
Moyamoya disease-related gene correlation analysis
The MMD-related genes were obtained from the GeneCards database. Differential expression analysis was performed using the R package “Limma” to compare the expression level of MMD-related genes between disease and controls. Moreover, the relationship between MMD-related genes and focus genes was visualized by a bubble chart using the Pearson correlation analysis.
Connectivity map prediction analysis
The connectivity map (Cmap) is a gene expression database supported by the Broad Institute, which contains microarray data from 5 kinds of human cell lines before and after treatment with 1309 small molecule drugs. It reveals the functional relationships among small molecule genes, compounds, and diseases. We selected the top 150 upregulated and downregulated differential genes, respectively, and predicted potential targeted drugs with DEGs in MMD.
Statistical analysis
The R software (version 4.2.2) was used for all bioinformatic analyses, and P < .05 was considered as statistically significant.
Participants and sample preparation
We enrolled 3 Chinese and Han individuals who underwent digital subtraction angiography (DSA) to check for MMD at the Department of Neurosurgery, Beijing Tiantan Hospital, Capital Medical University from July 1, 2023, to December 31, 2024. 15 We performed detailed consultations and physical examinations on patients with MMD to ensure that they did not have any underlying diseases, such as hypertension, diabetes, hyperlipidemia, hyperthyroidism, and surgical history, that could affect the results of this study. Supplemental Table S1 shows their clinical and demographic characteristics. In addition, we recruited 3 healthy controls (HCs; age range = 18-45 years). Written informed consent was obtained from all participants. The study obtained the consent of the participants in accordance with the Declaration of Helsinki and was approved by the Ethics Committee of the Beijing Tiantan Hospital (KY-2023-2024-02). We collected 2 mL blood samples from all patients with MMD and centrifuged them at 5000 rpm for 10 minutes at room temperature, followed by storage at −80°C for analysis.
Enzyme-linked immunosorbent assay
We obtained the serum of 6 participants after centrifugation, and we prepared the standard solution according to the instructions with the concentration of MGAT5B as 20, 10, 5, 2.5, 1.25, 0.625, 0.313 ng/mL, PTPN11 as 20, 10, 5, 2.5, 1.25, 0.625, 0.313 ng/mL, and CFP as 100, 50, 25, 12.5, 6.25, 3.125, 1.562 ng/mL. The Human CFP enzyme-linked immunosorbent assay (ELISA) Kit (EH1217), Human PTPN11 ELISA Kit (EH11523) (Fine Bio Tech, Wuhan, China), and Human MGAT5B ELISA Kit (abx381437) (Abbexa, Houston, Texas, USA) were obtained to perform the assays. We set standard wells, blank wells, and sample wells, respectively, in the ELISA kits. We added 100 μL of diluted standard solution to the standard wells, 100 μL of standard diluent buffer to the blank wells, and 100 μL of the sample to the remaining wells, which were incubated at 37°C for 1 hour. After adding 100 μL of detection reagent A and detection reagent B to each well with suction and washing, we added 90 μL of substrate to each well, which was then sealed and incubated at 37°C in the dark for 20 minutes. Then, we added 50 μL stop solution to each well and measured the Optical Density (OD) value at 450 nm. The data were analyzed and visualized using GraphPad Prism 9 (Version 9.4.0), and Adobe Illustrator (26.3.1) was used to organize and combine the figures. All data are expressed as mean ± SD. Statistical differences between groups were tested using 1-way analysis of variance (ANOVA). P-values less than 0.05 were considered significant differences.
Plasmid construction and transfection
To verify the effects of hub genes in vitro, we knocked down gene PTPN11 in human brain microvascular endothelial cells (HBMECs) using plasmid transfection. The HBMECs (CP-H124) (Pricella, Wuhan, China) were subcultured in Extracellular Matrix (ECM) medium containing penicillin (final concentration: 100 U/mL), streptomycin (final concentration: 100 μg/mL), 5% Fetal Bovine Serum (FBS), and 1% Endothelial Cell Growth Supplement (ECGS). The target sequence was designed targeting the PTPN11 gene based on the principle of RNAi sequence design. We designed 4 kinds of plasmids including shRNA-PTPN11#1, shRNA-PTPN11#2, shRNA-PTPN11#3, and shRNA-NC (Supplemental Table S2), and the vector is shown in Supplemental Figure S1. After colony cultivation, polymerase chain reaction (PCR) was performed to select the positive clone plasmid and prepare it for transfection. The results of transfection were verified using Western blot and PCR assays. We also extracted mRNA from each group transfected by different plasmids, and the density and concentration were measured by NanoDrop 2000.
Tube formation assay
Before the day of assay, Matrigel glue was transferred from −20°C to 4°C for 1 night and all the pipetting gun heads were cooled at −20°C. In total, 50 μL of melted Matrigel glue was transferred to each well of the 96-well plate, and the plate was stored at 37°C for 30 minutes. The HBMECs were added to a 96-well plate and were confirmed to spread evenly under a microscope. The plate was incubated at 37°C for 6 hours. The formation of lumens was observed after 2 hours of incubation, and after the lumens were completely formed after 6 hours of incubation, the plate was transferred and images were captured. ImageJ software (https://imagej.net/ij/) was used to analyze the length of tubes in each group.
Statistical analysis
All statistical analyses were conducted using R language (version 4.2.2), and P < .05 was statistically significant. The comparison between 2 groups was performed with the Wilcox test, and the comparison among 3 or more groups was performed using the Kruskal test. P-value < .05 was considered statistically significant.
Results
Differential expression analysis and identification of glycosylation-related genes
GSE189993 and GSE131293 data sets were included, and expression profiles from 40 participants (24 MMD patients and 14 controls) were obtained for further analyses. Principal component analysis demonstrated that the batch effect among the microarrays was reduced after correction using the R package SVA. The PCA visualized the distribution of the data shown in Figure 1A and identified that the batches were at the same level. We used the R package limma to identify DEGs between MMD and control groups with the values of P < .05 and |log2FC| > 1 as the criterion. In total, 723 DEGs were detected including 231 upregulated genes and 492 downregulated genes. The differential expression analysis was depicted in the volcano plot and the heat map (Figure 1B and C). In total, 16 glycosylation-related DEGs were obtained for further analyses after the intersection shown in Figure 1D.
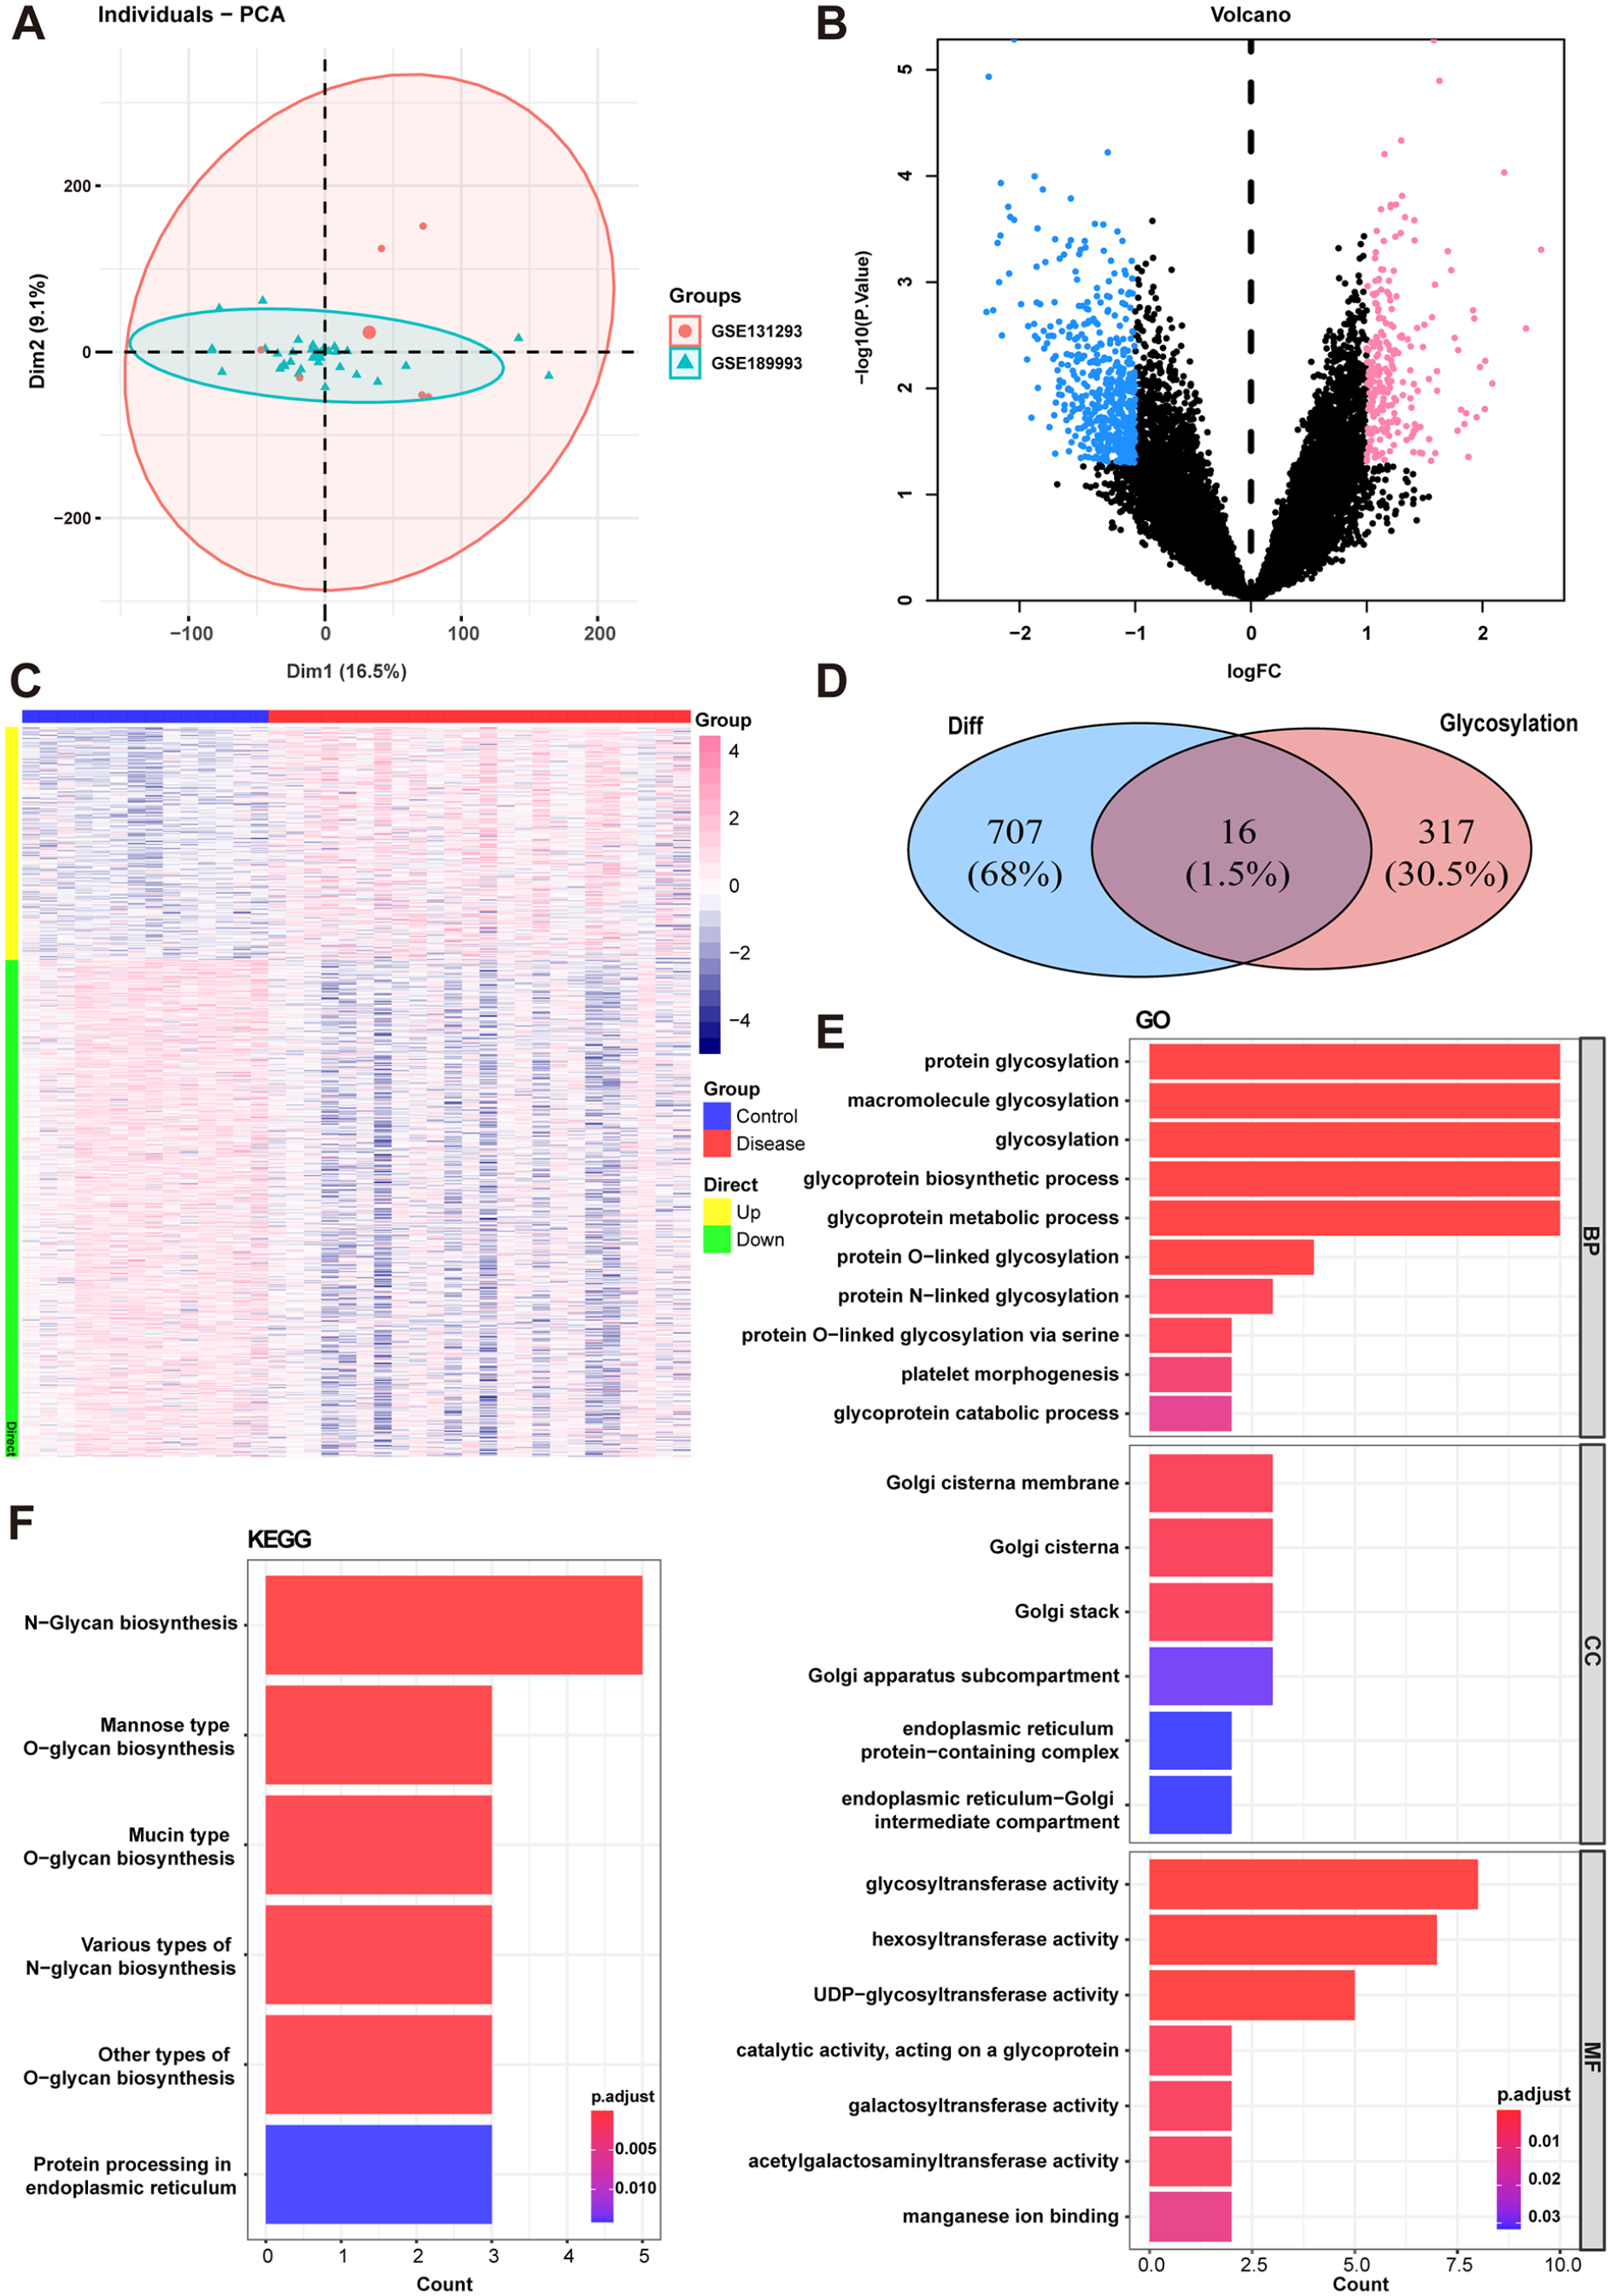
Differential analysis and functional enrichment analysis with gene data sets. (A) Principal component analysis (PCA) plots after correlation. (B) Volcano plot of differentially expressed genes between MMD group and control group. (C) Heatmap of differentially expressed genes in MMD. Different colors presented the expression level in each sample. (D) Venn plots show 16 glycosylation-related DEGs in MMD. (E) GO enrichment analysis of DEGs in MMD. (F) KEGG enrichment analysis of DEGs in MMD.
Gene function enrichment analysis
The GO and KEGG functional enrichment analyses were performed with glycosylation-related DEGs. As shown in Figure 1E and F, the genes are enriched in glycosylation and various types of glycan biosynthesis pathways. Moreover, Golgi apparatus components and glycosyltransferase activity were enriched in MMD.
Identification of focus genes in moyamoya disease using machine learning
The LASSO regression and SVM algorithm were used to select the focus genes in MMD from the intersection genes. The result of LASSO regression identified 9 genes as characteristic genes of MMD, as shown in Figure 2A and B. Moreover, we estimated characteristic genes in MMD using the SVM algorithm and we selected the top 4 genes with the highest accuracy as characteristic genes in MMD (Figure 2C). After the intersection between the genes obtained from LASSO regression and SVM algorithm, we selected 3 genes as focus genes including CFP, MGAT5B, and PTPN11 for further analyses (Figure 2D).

Machine learning analysis and GSEA analysis of differentially expressed genes in MMD. (A, B) LASSO regression indicated 9 characteristic genes for MMD. (C) SVM algorithm identified 4 genes as characteristic genes for MMD. (D) Venn plot between the results of LASSO regression analysis and SVM algorithm. (E) The GSVA result of MGAT5B. (F) The GSVA result of PTPN11.
Signaling pathways of focus genes
To explore the potential molecular mechanisms in MMD progression of focus genes, we studied the specific signaling pathways using GSEA analysis. The GSEA analysis revealed that MGAT5B enriched in linoleic acid metabolism, olfactory transduction pathways, and steroid hormone biosynthesis pathways (Figure 2E). The PTPN11 enriched in RNA degradation, protein export, and propanoate metabolism pathways (Figure 2F), and CFP enriched in the Tricarboxylic Acid Cycle (TCA) cycle, hedgehog signaling pathway, and pentose phosphate pathways.
Correlation of immune infiltration and immunotherapy and focus genes
The correlation analysis between focus genes and immune infiltration of MMD was performed to explore the gene effects on immunity and potential pathogenesis in MMD. The proportion of different immune cells in MMD compared with controls and the relationship between immune cells in MMD are shown in Figure 3A and B. Moreover, we compared the expression of different types of immune cells, which indicated that check-point, APC co-inhibition, CCR, parainflammation, and Tfh were upregulated in MMD compared with controls shown in Figure 3D. We explored further the correlation between focus genes and immune cells, which revealed that CFP showed a positive correlation with pDCs, HLA, and CCR (Figure 3C). The MGAT5B was positively correlated with B cells, check-point, and T helper cells and was negatively correlated with Treg (Figure 3C). The PTPN11 showed a negative correlation with Tumor-Infiltrating Lymphocytes (TIL), Type 1 Interferon (IFN) response.

The immune landscape of MMD compared with controls and the association of immune infiltration and focus genes. (A) The proposition of immune cells between the MMD group and control group. (B) Heatmap of correlation analysis among different immune infiltration cells in MMD patients. (C) The correlation between 3 focus genes and immune infiltration cells. (D) The expression level of different immune infiltration cells in MMD compared with controls.
MicroRNA network analysis of focus genes
Focus genes were set as the gene set for miRNA network analysis, and various transcription factors were identified to regulate focus genes. Enrichment analysis of these transcription factors was visualized using cumulative recovery curves. The results of motif-TF annotation analysis of the focus genes indicated that the highest NES (6.57) was with csibp_M2095. The motifs and related transcription factors are listed in Figure 4. In total, 75 miRNAs and a total of 126 miRNA-miRNA relationship pairs were obtained with the reverse prediction for the focus genes based on the microde database. The results were visualized with a Cytoscape (Figure 5).

Regulatory network analysis of focus genes. (A) Enrichment analysis of the transcription factors related to focus genes. (B) The motif of cisbp_M2095. (C) The motif of cisbp_M6385. (D) The motif of cisbp_M6387.

The miRNA-Genes regulatory network in MMD.
Moyamoya disease-related genes correlation analysis
Differential analysis of MMD-related genes correlation analysis revealed that ADARB2, APOA1, CALCR, ISG15, and so on were differentially expressed in MMD compared with controls shown in Figure 6A. The expression levels of focus genes were also correlated with multiple MMD-related genes (Figure 6B). Especially, MGAT5B showed a positive correlation with SMPDL3B (Pearson r = 0.714), while PTPN11 was negatively correlated with EEF1D (Pearson r = 0.714).
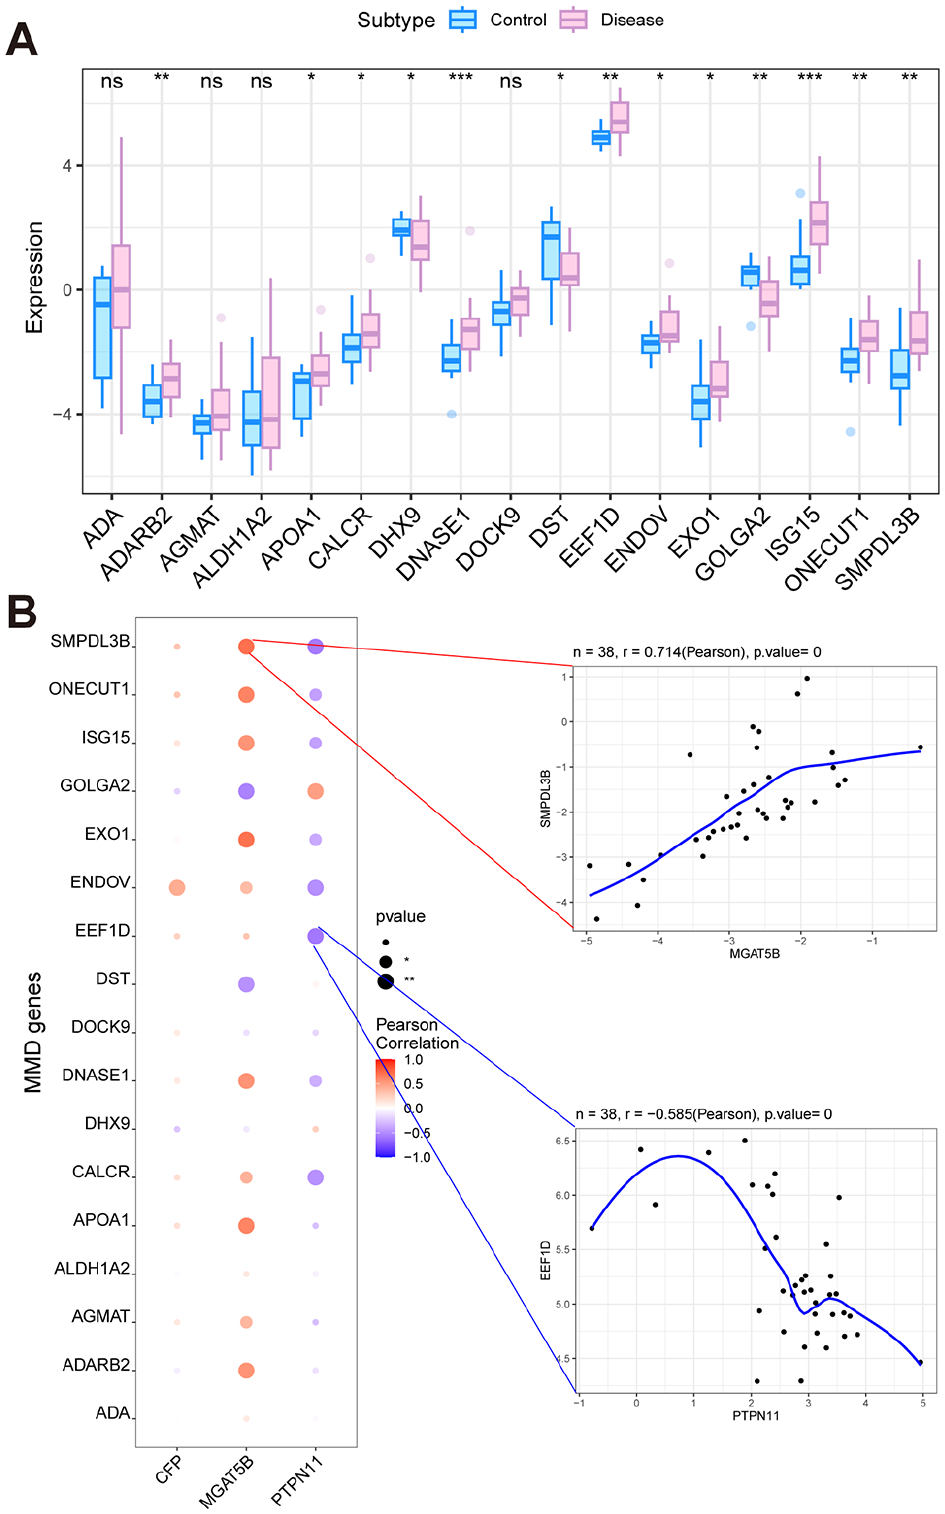
The relationship of focus genes and MMD-related genes. (A) Differential analysis of MMD-related genes between the control group and the disease group. (* represents P < .05, ** represents P < .01, *** represents P < .001). (B) Bubble map for the correlation between 3 focus genes and MMD-related genes.
Prediction of small molecule drugs targeting moyamoya disease expression profiles
The Cmap prediction analysis indicated that the expression profiles treated with Chenodeoxycholic acid, MRS-1220, Phenytoin, and Piceid were negatively related to MMD expression profiles.
Enzyme-linked immunosorbent assay
The result showed that CFP and MGAT5B were increased in MMD, while PTPN11 was decreased in MMD patients compared with HCs, as seen in Figure 7A to C, which was correlated with our results of previous analyses.
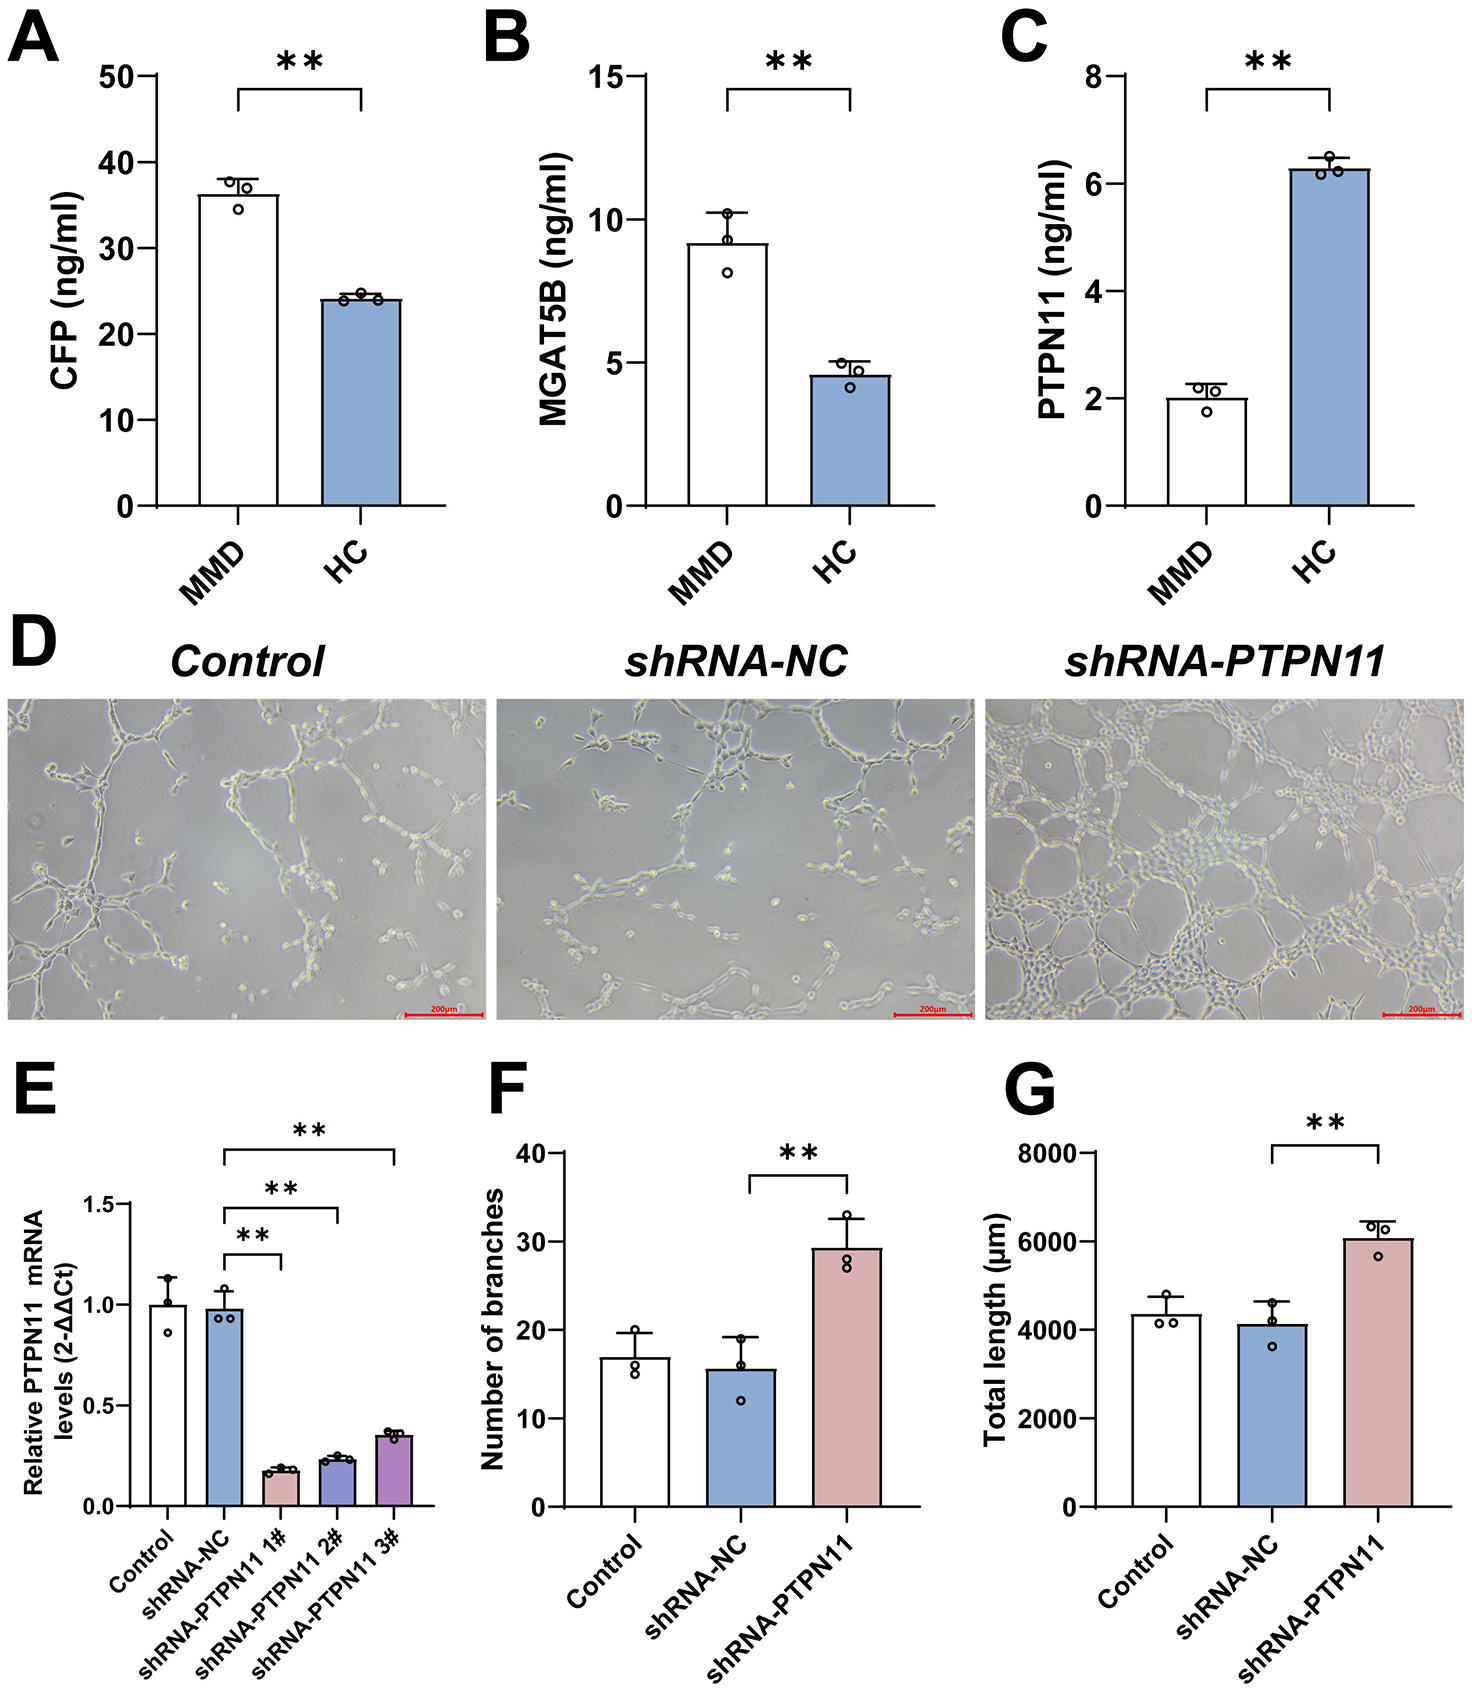
ELISA results and the tube formation assays of PTPN11 knockdown in HBMECs. (A) The result showed that CFP was upregulated in MMD compared with healthy controls. (B) The result showed that MGAT5B was upregulated in MMD compared with healthy controls. (C) The result showed that PTPN11 was downregulated in MMD compared with healthy controls. (D) The images under a microscope of tube formation assays of different groups. (E) The result showed that PTPN11 was expressed lower in shRNA-PTPN11 groups. (F) The result showed that PTPN11 knockdown increased the number of branches in tube formation assays. (G) The result showed that PTPN11 knockdown increased the total length in tube formation assays.
Knockdown of PTPN11 significantly increased human brain microvascular endothelial cell angiogenic capacity
As PTPN11 was most significantly downregulated in differential expression analyses, we chose to knock down PTPN11 to verify the effects of hub genes. We performed PCR assays after plasmid transfection, and the results showed that PTPN11 was downregulated in shRNA-PTPRM groups compared with the shRNA-NC group shown in Figure 7E. Tube formation assays indicated that knockdown of PTPN11 increased the number of branches and total length of lumens in HBMECs compared with the shRNA-control group shown in Figure 7D, F and G.
Discussion
Most prevalent in Asia, MMD has long been studied but still with an unknown etiology and there are no effective drugs for intervention. Bypass surgery is required to prevent strokes in MMD effectively. 16 The association between lipid and glucose metabolism with MMD was reported in previous studies. The characteristic glucose hypometabolic pattern in MMD patients with vascular cognitive impairment indicated that abnormal brain glucose metabolism was related to cognitive impairment in MMD. 9 Geng et al 10 used non-targeted gas chromatography-mass spectrometry to identify differently expressed serum metabolites in MMD, including L-isoleucine and urea. Moreover, lipidomic analysis also found that levels of complex membrane glycosphingolipids are decreased in MMD. 11 The previous studies indicated the potential association between glycosylation and molecular pathogenesis of MMD. In this study, we screened 231 upregulated genes and 492 downregulated genes and identified glycosylation-related mechanisms in MMD patients, which might help determine the pathogenesis of MMD and develop the potential therapeutic target for MMD.
The signature DEGs in MMD included 3 glycosylation-related genes: CFP, MGAT5B, and PTPN11. The CFP, which is also known as properdin, is a kind of glycoprotein that regulates the alternative pathway in complement activation. 17 It was found that CFP was expressed in 50% of choroidal neovascular membranes of patients with age-related macular degeneration. The abnormal expression of CFP might be a response to the disease progression and may indicate chronic inflammation that might cause angiogenesis in age-related macular degeneration. 18 Previous studies have shown that the complement C3 is downregulated in MMD and decreases even further in late-Suzuki stage disease. 19 Within the complement system, CFP stabilizes the C3 convertase complex. The results showed that CFP was upregulated in MMD, which might be correlated with downregulated complement C3. C3 has been demonstrated to lead to both endothelium injury and vascular remodeling in the onset and progression of vasculopathies. 20 Upregulated CFP in MMD might mediate abnormal C3 expression and immune infiltration, which could cause endothelium proliferation and chronic vascular stenosis in MMD.
The MGAT5B is an enzyme involved in protein O-linked glycosylation via serine and is mainly expressed in the brain and testis. Lange et al 21 identified MGAT5B upregulated in prostate cancer and its products were predominantly detectable in metastatic xenografts, which suggested MGAT5B as a biomarker of tumor progression in prostate cancer. Previous studies have suggested that MGAT5B contributes to the malignant phenotype in melanoma by influencing cell adhesion to extracellular matrix components and cell motility. 22 Moreover, differential expression levels of MGAT5B could regulate cell adhesion and cell migration of human neuroblastoma cells in vitro. 23 It was demonstrated that expression levels of soluble adhesion molecules were increased in the cerebrospinal fluid of children with MMD compared with controls. 24 The MGAT5B was identified as upregulated in MMD and might lead to VSMC migration and endothelium proliferation with the dysregulation of cell adhesion, which caused the narrowing of blood vessels.
The PTPN11, also known as SHP2, is a member of the protein tyrosine phosphatase (PTP) family, which is expressed in most tissues and regulates various cell signaling pathways. The PTPN11 regulates cell survival through the P13K/Akt pathway. 25 The SHP2 knockout could result in massive hemorrhage, cardiovascular defects, and thinning of artery walls, which was due to fewer VSMCs and decreased extracellular matrix deposition. The results of the carotid artery ligation model indicated that SHP2 deletion could inhibit the expression of extracellular matrix components, VSMC proliferation, and neointima formation. 26 Zheng et al 27 have identified that the expression level of PTPN11 was lower in patients with carotid atherosclerotic plaques, which could also lead to stenosis of the lumen and severe cardiovascular ischemic events. We also identified that PTPN11 was also downregulated in MMD compared with controls, which was correlated with previous studies. Moreover, we identified the effects of PTPN11 knockdown on the angiogenic capacity of HBMECs. Downregulation of PTPN11 might cause abnormal endothelial cell motility and angiogenesis, which could lead to chronic stenosis of the artery.
Glycosylation has been correlated with cardiovascular diseases, which could regulate leukocyte recruitment and chemokine receptor activities. 28 Our study has demonstrated that chemokine expression was correlated with focus genes and immune cell infiltration was dysregulated in MMD patients. Previous studies have analyzed the immune characteristics and also identified that HLA expression levels were increased in MMD compared with controls. 29 It was indicated that soluble CD163 and CXL5 were increased in MMD patients and correlated with CD163+ M2-polarized macrophages, which might be implicated in the pathogenesis of MMD. 30 Mutations in gene RNF213 were implicated in the previous studies of MMD molecular mechanisms in vascular chronic stenosis.31 -33 Specifically, RNF213 mutations could cause excessive immune activation which might result in the dysregulation of the immune system, leading to the abnormal infiltration of immune cells—including T cells, B cells, and macrophages—into blood vessels. 34 However, we analyzed the expression of RNF213 between MMD and controls and found that no significant differences existed between MMD and controls, which indicated that the gene factors of MMD were complicated and not necessarily related to RNF213.
Immune cells undergo a complex process while passing through the endothelium to the site of inflammation through rolling, cell adhesion, and finally transendothelial migration.35,36 Junctional adhesion molecules that are heavily N-glycosylated are also upregulated with inflammation, via cytokine-induced signaling pathways, such as NF-κB.37 -40 Monocyte adhesion to endothelial cells plays an important role in the initiation and growth of atherosclerotic stenosis.41,42 Previous studies have highlighted the dysregulation of various glycoforms of cell adhesion molecules could control how different subtypes of immune cells transmigrated to specific vascular beds in an immune response.43 -46 The MMD, characterized by chronic stenosis of the carotid artery, showed significant immune dysregulation, which might be a dysfunction of glycosylation in MMD patients.
There are several limitations in this study. Although this study integrates comprehensive bioinformatic analyses with preliminary experimental validation, a major limitation is the absence of more extensive in vitro functional studies and the use of larger cohorts of patient-derived samples. While our ELISA results and endothelial cell assays provide initial support for the involvement of CFP, MGAT5B, and PTPN11 in MMD pathogenesis, further investigations using advanced in vitro models and expanded patient-derived specimens are essential to fully elucidate the biological mechanisms and validate these findings. Future studies will focus on developing disease-relevant cellular models and incorporating clinical samples to strengthen the translational potential of glycosylation-related targets in MMD. As the annual incidence of MMD is 0.5–1.5 per 100 000 individuals in East Asian countries but as low as 0.1 per 100 000 in other regions, including North America, although we have searched for all databases, the sample size was very small with the low prevalence of MMD. 1 The small sample size might increase the risk of overfitting the data and lead to bias in the results, which means that results may not generalize well to larger populations. A larger sample size for studies on glycosylation in MMD is essential. Moreover, the results of some databases were obtained from the MCA samples, which might not be the stenotic vessel of MMD and could not truly reflect the pathological changes in MMD.
Conclusions
Our study identified a total of 723 DEGs in MMD and selected 3 focus genes (CFP, MGAT5B, and PTPN11) that were involved in glycosylation using machine learning algorithms. The results with glycosylation-related genes indicated that glycosylation might play an important role during the pathogenesis of MMD. Immune infiltration analysis demonstrated the potential correlation between the glycosylation expression and immune dysregulation, which might lead to MMD pathogenesis. Moreover, we verified the dysregulation of hub genes and demonstrated that PTPN11 knockdown would lead to increased angiogenic capacity of HBMECs. Our study is the first to explore the correlation between MMD pathogenesis and glycosylation, which may provide new insights, new biomarkers for diagnosis, and potential therapeutic targets for MMD.
Supplemental Material
sj-docx-1-bbi-10.1177_11779322251342412 – Supplemental material for Integrative Machine Learning Approach to Explore Glycosylation Signatures and Immune Landscape in Moyamoya Disease
Supplemental material, sj-docx-1-bbi-10.1177_11779322251342412 for Integrative Machine Learning Approach to Explore Glycosylation Signatures and Immune Landscape in Moyamoya Disease by Cunxin Tan, Jing Wang, Yanru Wang, Shaoqi Xu, Zhenyu Zhou, Junze Zhang, Shihao He and Ran Duan in Bioinformatics and Biology Insights
Footnotes
Acknowledgements
We appreciated the patients and participants enrolled in our studies. Thanks for their contribution to the studies of MMD pathogenesis.
Ethics Approval and Consent to Participate
This study was approved by the Institutional Ethics Committee of Peking Union Medical College Hospital, Beijing, China (I-24YSB0160). No further approval is required for access to the public database.
Consent for Publication
Not applicable.
Author Contributions
Funding
The author(s) disclosed receipt of the following financial support for the research, authorship, and/or publication of this article: This research was supported by Peking University International Hospital Research Grant (no. YN2022ZD04).
Competing Interests
The author(s) declared no potential conflicts of interest with respect to the research, authorship, and/or publication of this article.
Availability of Data and Materials
The original contributions presented in the study are included in the article; further inquiries can be directed to the corresponding author.
Supplemental Material
Supplemental material for this article is available online.
References
Supplementary Material
Please find the following supplemental material available below.
For Open Access articles published under a Creative Commons License, all supplemental material carries the same license as the article it is associated with.
For non-Open Access articles published, all supplemental material carries a non-exclusive license, and permission requests for re-use of supplemental material or any part of supplemental material shall be sent directly to the copyright owner as specified in the copyright notice associated with the article.