
Abstract
Backgrounds:
Distant metastasis in breast cancer patients contributes to increased breast cancer mortality, highlighting the urgent need for effective predictive strategies. Understanding metastasis mechanisms and identifying relevant biomarkers are crucial for improving patient outcomes and informing targeted therapies. This study employed a high-dimensional regression model to identify biomarkers linked to distant metastasis-free survival in breast cancer patients, with the goal of enhancing prognostic accuracy and guiding clinical decisions.
Methods:
We utilized the publicly available breast cancer dataset (GSE2034), which includes gene expression profiles for 22 283 genes across 286 samples. To identify relevant genes, we applied Cox-Boost regression and a random forest (RF) model. We then explored the association between the selected genes and metastasis-free survival outcomes using quantile regression, chosen for its ability to assess the impact of these genes across different survival quantiles (P < .05). This approach complements the Cox-Boost model by providing a more detailed understanding of gene-survival relationships at various points in the survival distribution, thereby strengthening the robustness of our findings.
Results:
We identified 222 significant transcripts using univariate Cox regression models. By applying Cox-Boost, both with and without adjustment for ER+/− status, we identified 7 genes associated with time-to-relapse/metastasis in breast cancer patients: SNU13, CLINT1, ACBD3, NEK2, COL2A1, WFDC1, and RACGAP1. A similar approach was used for ER-positive patients. Patients were classified as high or low risk for metastasis based on the median prognostic index calculated from the identified genes (P < .001). The top-ranked genes associated with high/low risk groups using RF were RACGAP1, NEK2, CCNA2, DTL, ACBD3, ARL6IP5, WFDC1, and PDCD4.
Conclusions:
We identified eleven key genes, including SNU13, CLINT1, ACBD3, NEK2, COL2A1, WFDC1, and RACGAP1, as well as CCNA2, DTL, ARL6IP5, and PDCD4, that are related to the risk of distant metastasis and may be used as biomarkers to predict distant metastasis of breast cancer.
Introduction
Breast cancer (BC) is the most prevalent cancer among women, representing 10.4% of all cancer cases. 1 Its incidence and mortality rates are approximately 30% and 15%, respectively, among females worldwide. 2 Risk factors include lifestyle choices (such as smoking and diet), genetics, and certain health conditions. Breast cancer often develops due to genetic mutations or DNA damage, which can be associated with inherited genetic defects. 3 Although many causes remain unknown, the risk of developing breast cancer increases with age, a family history of the disease, a previous diagnosis of breast cancer or benign lumps, dense breast tissue, exposure to estrogen, hormone replacement therapy, obesity, alcohol consumption, and radiation 4 . Early detection is crucial for effective treatment, which typically includes surgery, radiation therapy, hormone therapy, biological treatments, and chemotherapy. However, despite treatment, some cases have poor prognoses due to unknown molecular factors, and local, regional, or distant recurrence can occur months or even years later as a result of residual cancer cells. 5 In 2020, approximately 2.3 million women worldwide were diagnosed with breast cancer, and by the end of the year, 7.8 million women were living as breast cancer survivors within the past 5 years. 6 Also, a 40% increase from the estimated 1.7 million cases in 2012. 7 The 5-year survival rates for breast cancer after diagnosis vary widely: 85% to 90% in high-income countries such as the United States and the United Kingdom, 66% in India, and 40% in South Africa. 8 Poorer survival rates in developing countries can be attributed to factors such as limited awareness, lack of early detection programs, and insufficient diagnosis and treatment facilities. 9 Furthermore, a longer interval between diagnosis and BC surgery is associated with decreased overall and disease-specific survival. 10
Altered genes, whether inherited or acquired, are significant risk factors for both breast cancer incidence and survival. In breast cancer patients, various cellular activities and signaling pathways are involved, underscoring the importance of understanding the underlying molecular mechanisms. This knowledge could enable the identification of biomarkers that can predict clinical outcomes and treatment responses. 11 Breast cancer is a heterogeneous disease with diverse molecular subtypes and varying clinical behaviors. Understanding the molecular mechanisms that drive breast cancer progression is essential for developing more effective diagnostic, prognostic, and therapeutic strategies. By unraveling the complex signaling pathways and genetic alterations that regulate tumor initiation, growth, and metastasis, researchers can identify novel molecular targets for personalized treatment approaches.12,13 The most well- known genetic risk factors for BC are mutated BRCA1 and BRCA2 which can result in abnormal cell growth and cancer. 14 Other genes, such as ATM, PALB2, TP53, CHEK2, PTEN, and CDH1 influence BC risk, albeit to a lesser extent. 11
Numerous studies have explored prognostic markers, including gene expression signatures that differentiate between tumor and normal tissues, focusing on survival outcomes.15 -17 However, progress in developing diagnostic tools to detect recurrence in breast cancer patients has been limited. Such tools are essential for ensuring that high-risk patients receive appropriate therapy. Although gene expression profiles have been used to classify different breast tumor subtypes, the influence of genetic alterations on breast cancer progression and survival is still not fully understood. Therefore, it is crucial to explore the association between a broad set of gene expression variables and breast cancer incidence and survival, particularly in relation to disease recurrence.
Boosting techniques were originally developed as powerful tools for classification, aimed at enhancing the predictive performance of weak learners by combining them into a single strong learner. This iterative ensemble method works by sequentially applying a learning algorithm, re-weighting data points to focus on those misclassified in earlier iterations. Over time, boosting has expanded beyond classification to address various statistical challenges, including survival analysis. One notable adaptation is the Cox-Boost method, which combines the principles of boosting with the Cox proportional hazards model. This likelihood-based approach is particularly effective for analyzing high-dimensional data, as it facilitates variable selection and promotes sparsity through its iterative process. By identifying and prioritizing the most relevant predictors, Cox-Boost enables accurate prediction of patient survival probabilities while assessing the influence of multiple covariates. 18 This method efficiently handles high-dimensional data analysis by promoting sparsity and variable selection through its iterative process, allowing for accurate prediction of patient survival probabilities and evaluating the impact of multiple predictors.19 -22
To address the need for assessing the impact of a large number of genes on disease recurrence in breast cancer patients, this study aims to utilize the Cox-Boost approach to identify genes highly associated with this cancer. A comprehensive analysis of gene expression was performed to establish a reliable set of prognostic markers and offer quantitative predictions on recurrence for patients with lymph-node-negative breast cancer.
Methods
Data
A publicly available dataset of BC is available in GEO repository with the ID: GSE2034, which was generated using the Affymetrix Human Genome U133A Array, was used. This series represents 180 lymph-node negative relapse free patients and 106 lymph-node negative patients that developed a distant metastasis. 23 All cases had sufficient tumor and uniform involvement of tumor in 5 µm frozen sections stained with hematoxylin and eosin. Immunohistochemistry or ligand blinding assay were utilized to measure estrogen receptor (ER) and a cut-off value of 10 fmol/mg or 10% positive tumor cells was assumed to classify cases in positive or negative ER. 23 In this study, Cox-Boost analysis was performed to assess and determine the most influencing genes on the BC relapse free survival.
Statistical analysis
We used Bioconductor packages in the R language for data analysis. The raw data was processed using Log2 and normalization. Figure 1 presents the flowchart of the modeling workflow. To evaluate the unadjusted association of transcripts with survival probability, simple Cox proportional hazards regression models were applied. Multiple versions of Cox regression were conducted using component-wise likelihood-based boosting, a method particularly well-suited for handling numerous predictors. This approach also allows for the inclusion of mandatory covariates with unpenalized parameter estimates. A Cox proportional hazards model is formulated as follows, where t is the n-dimensional vector of the observed survival times, X the n×p matrix of the data,
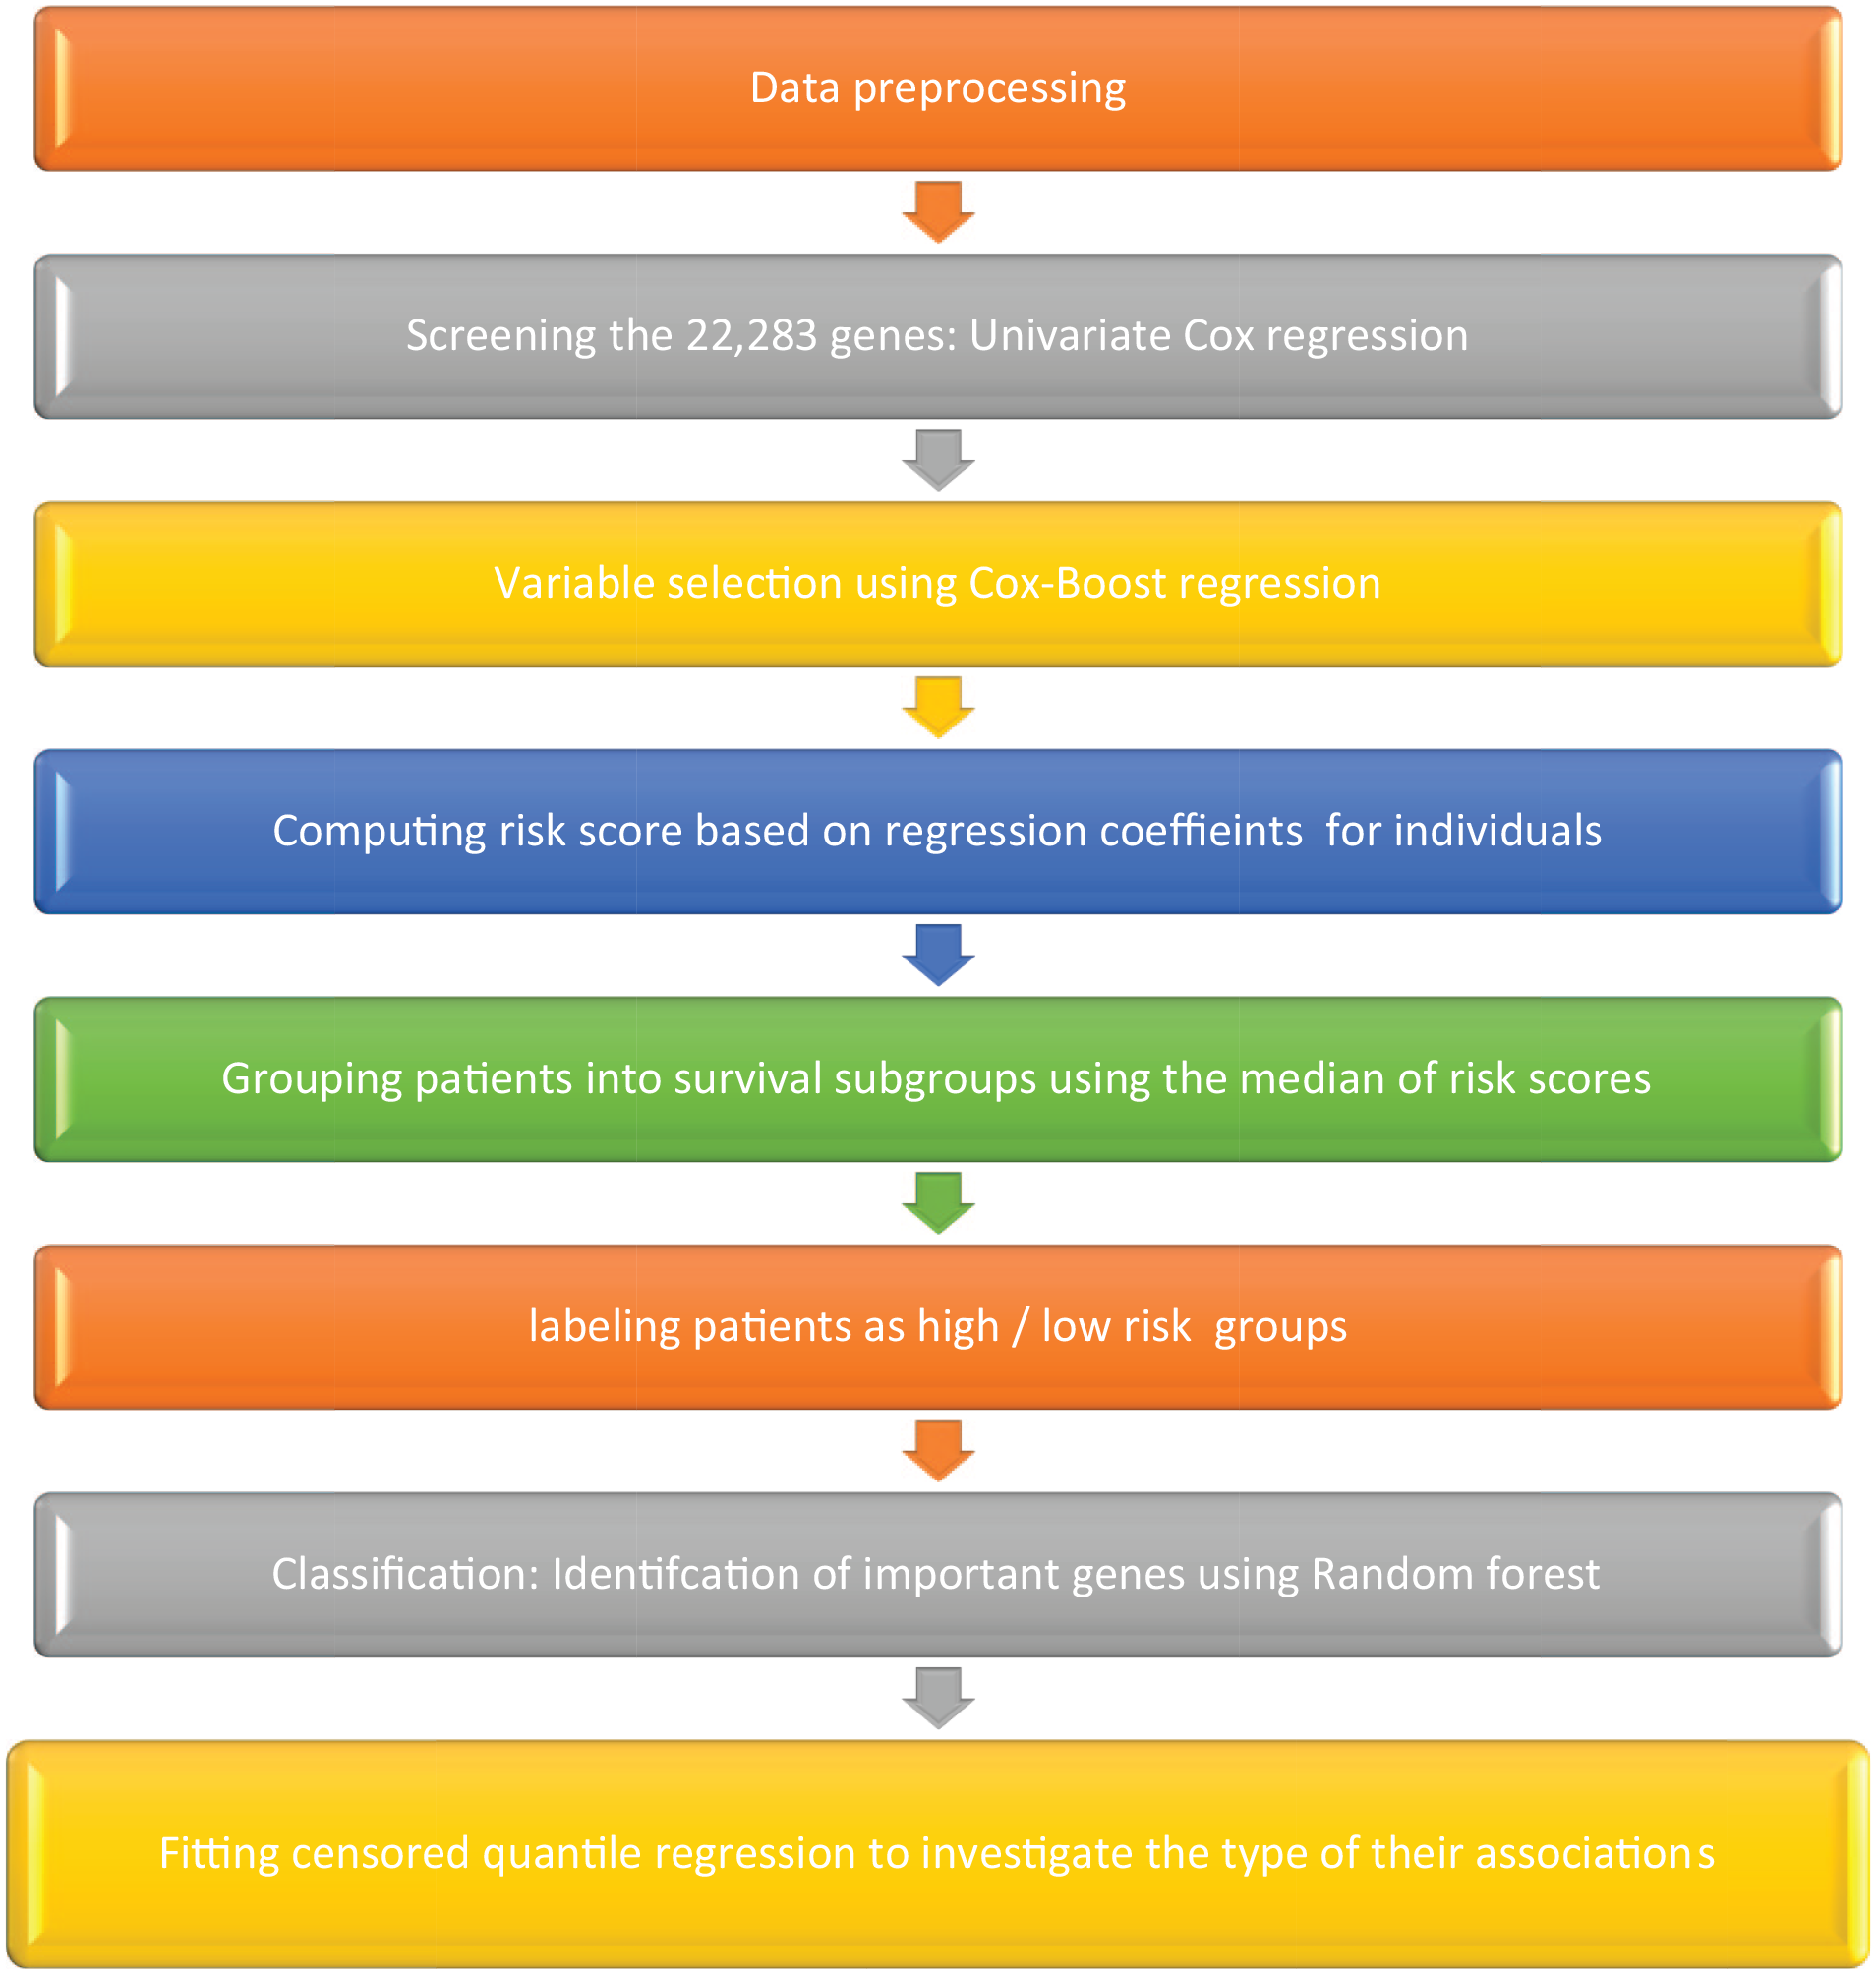
The flowchart of the modeling workflow.

For data filtering, separate Cox regression models were applied using each gene expression as the only covariate and those with P-value less than .05 were evaluated in the Cox Boost step of data analysis. In boosting procedure, one follows these steps:
Set the vector of regression coefficients as zero.
Compute the negative gradient vector in which L(y,F(X,
Computing the updates:
3.1 fitting the base learner to the negative gradient vector,
3.2 penalizing it,
Select the best update j* (usually by minimizing the loss function).
Updating the estimations
The above steps between 2 and 5 are repeated multiple times. The approach for estimation is based on a likelihood function. The loss function, L2 norm penalized partial log-likelihood is
Using the estimated coefficients from the Cox Boost approach, prognostic scores were calculated for each case. The median score of prognostic was used as a cut-off point to distinguish the high/low risk individuals. To assess the importance of each gene on the categorized prognostic scores, Random Forest approach was utilized.
Random Forest employs an algorithm for regression, classification, and building trees. 25 For each tree, a bootstrap sample from the training data is taken, and a random-forest tree for each group is grown until reaching the minimum number of nodes. The method randomly selects a subset of variables, chooses the best variable for splitting, and divides the node into 2 daughter nodes. Once the important variables are identified in the classification, partial dependence and marginal effects are used to assess the impact of different variable values on classification. This technique also utilizes the average increase in the Gini index to measure variable importance. Two indices are used to determine the significance of genes: the increase in MSE of predictions, assessed via a permutation-based approach, and the increase in node purity, which relates to the loss function. Genes with higher indices are considered more important. Hyperparameter tuning was conducted using cross-validation and grid search to optimize the number of trees and the number of variables considered at each split, ensuring the best predictive performance. To do so, a range of hyperparameter values will be defined, including different numbers of trees (eg, 100, 200, 500) and the number of variables to be selected at each split. The grid search method systematically tests all combinations of these hyperparameter values by fitting the model with each combination and evaluating its performance using cross-validation.
Moreover, we used censored quantile regression to find the overall survival of the patients in different quantiles of time.
26
This approach allows us to estimate the pth quantile of survival time (

For example,
Software
To analyze the data, we used R software version 4.1.1 and “CoxBoost,” “survival” and “quantreg” packages.
Enrichment analysis
For further validation the expression levels of the selected genes were evaluated through the Human Protein Atlas (https://www.proteinatlas.org). Moreover, in this study the GEPIA (http://gepia.cancer-pku.cn/) was used for analyzing the RNA sequencing expression data of breast cancer tissues and normal tissues from the TCGA.
Result
We analyzed gene expression data from 22 283 genes across 286 samples. Initially, we conducted separate simple Cox regression models, which identified 222 significant transcripts with P-values less than .05. The results of the CoxBoost analysis are summarized in Table 1, detailing the hazard ratios (HRs), 95% confidence intervals, and corresponding P-values for each transcript after applying Cox regression.
The hazard ratio (95% confidence interval) resulted by the CoxBoost approach using adjusted and unadjusted for ER and in the sub-population of ER+ for 100 iterations.

Abbreviations: ER, estrogen receptor; HR (95%CI), hazard ratio (95% confidence interval).
This analysis was performed on the entire dataset, both with and without adjustments for estrogen receptor (ER) status, as well as within 2 distinct subsets: ER-positive and ER-negative samples. The CoxBoost model was run 100 times, allowing for variation in the selection of significant predictors across iterations. The “Frequency” column in Table 1 indicates the number of iterations in which a transcript was identified as a significant predictor. Only transcripts with a frequency greater than 80% are included in Table 1. A similar analysis was conducted for the ER-positive dataset; however, no significant transcripts were identified in the ER-negative dataset.
The results from both the adjusted and unadjusted analyses for estrogen receptor (ER) status indicate a slightly stronger association after adjustment in the Cox regression models. In the adjusted analysis, the expression of Small Nuclear Ribonucleoprotein 13 (SNU13) was associated with a lower hazard ratio (HR: 0.646; 95%CI: 0.533-0.784). In contrast, several other transcripts, including Clathrin Interactor 1 (CLINT1), Acyl-CoA Binding Domain Containing 3 (ACBD3), Never in Mitosis-Related Kinase 2 (NEK2), Collagen Type II Alpha-1 (COL2A1), WAP Four-Disulfide Core Domain 1 (WFDC1), and Rac GTPase Activating Protein 1 (RACGAP1), were associated with higher hazard ratios.
For the ER-positive subset, CD44 and SNU13 expression were associated with lower hazard ratios, while Actin-Like Protein 6A (ACTL6A), Never in Mitosis-Related Kinase 2 (NEK2), SHC Adaptor Protein 1 (SHC1), Zinc Finger CCHC-Type Containing 8 (ZCCHC8), and WAP Four-Disulfide Core Domain 1 (WFDC1) were linked to higher hazard ratios. Multiple Cox regression analyses showed non-significant hazard ratios for Acyl-CoA Binding Domain Containing 3 (ACBD3), NEK2, and Rac GTPase Activating Protein 1 (RACGAP1) after adjusting for the effects of the identified genes, both with and without adjustment for ER status. Additionally, the multiple Cox regression analysis of the ER-positive subset indicated that ACTL6A and ZCCHC8 were not significantly associated with survival probabilities after adjusting for the influence of the other genes in the model.
To evaluate the influence of genes on various percentiles of survival probabilities, censored quantile regression was applied, with results presented in Tables 2 and 3 for the entire dataset and the ER-positive subset, respectively. Table 2 indicates that the selected genes (identified through CoxBoost analysis) demonstrate near-significance across most survival probability deciles. The deciles of survival time can be calculated by multiplying each gene’s expression by its estimated coefficient. For instance, the 10th percentile of survival time for a case with a normalized expression of SNU13 of −0.347 is calculated as Q(0.10|SNU13) = 20.36 + 6.42 × (−0.347) = 22.58. This means that the probability of survival for a case with an SNU13 expression of −0.347 at 22.58 months is 10%. Similarly, other coefficients can be interpreted in the same manner. For example, the median survival time for a case with a normalized expression of CLINT1 equal to 1.03 is calculated as Q(0.50|CLINT1) = 264.92 − 63.24 × (1.03) = 199.78, indicating that the probability of survival for a case with a CLINT1 expression of 1.03 at 199.78 months is 50%.
The results of censored quantile regression in the entire population.

: Significant P-value (P < .05);
The results of censored quantile regression on the ER+ subset .
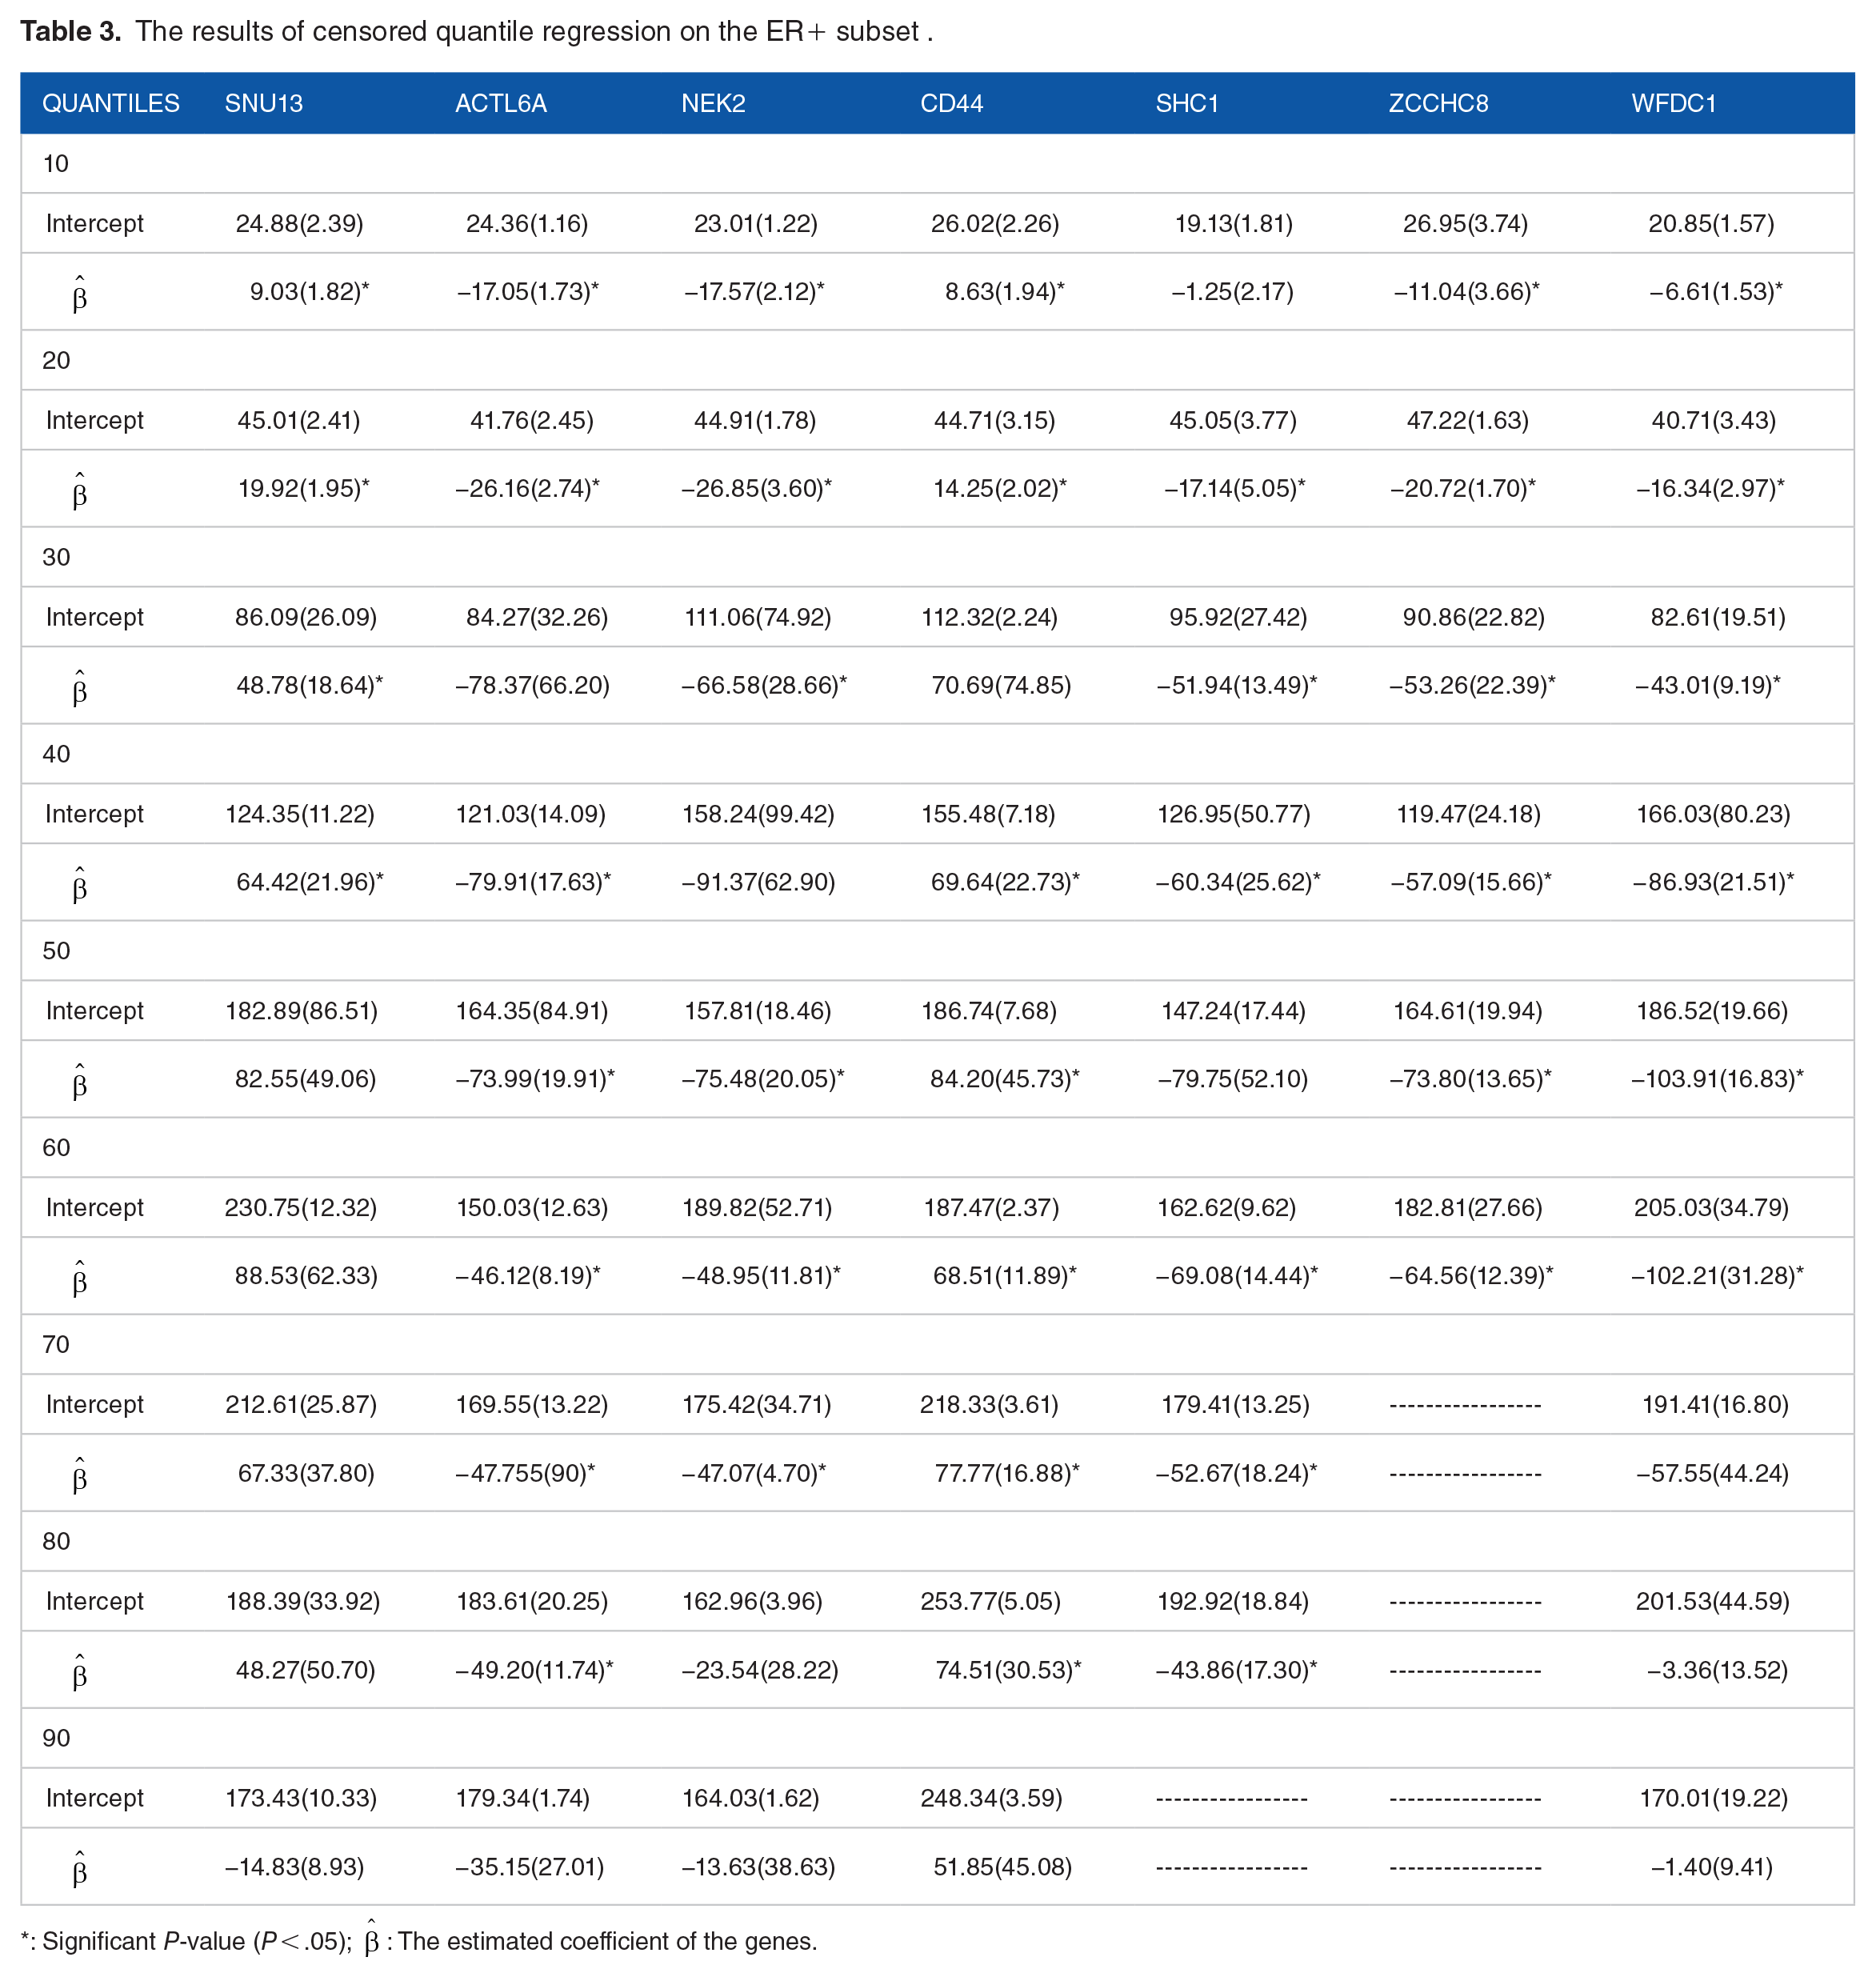
: Significant P-value (P < .05);
The relapse score was calculated using the estimated coefficients from the final Cox model and was categorized into 2 groups based on values below and above the median. The mean estimated survival time, standard error, and 95% confidence interval for both the entire dataset and the ER-positive subsets are presented in Table 4. The log-rank test indicates a significant difference in the survival distributions between the 2 groups (P < .001). Additionally, the Kaplan-Meier survival curves for both datasets are shown in Figure 2.
The comparison of survival probability distribution between the 2 levels using log-rank test.


Kaplan-Meyer survival function (a)comparing the survival probabilities of high (prognostic score> median) and low (prognostic score< median) risk groups of patients in the entire population, (b) comparing the survival probabilities of high (prognostic score> median) and low (prognostic score< median) risk groups of patients in the ER positive subset, (c) comparing the survival probabilities of high (prognostic score> median) and low (prognostic score< median) risk groups of patients in the validation data.
The results of the random forest analysis assessing the impact of various genes on the categorized relapse scores are presented in Table 5. This table highlights the increase in mean squared error of predictions and node purities, which the random forest method uses to evaluate the importance of genes in relation to the categorized prognostic scores (low/high risk patients). The 8 most important genes identified in this analysis are RACGAP1, NEK2, CCNA2, DTL, ACBD3, ARL6IP5, WFDC1, and Programed Cell Death 4 (PDCD4).
The increase in mean squared error of predictions and node purities.
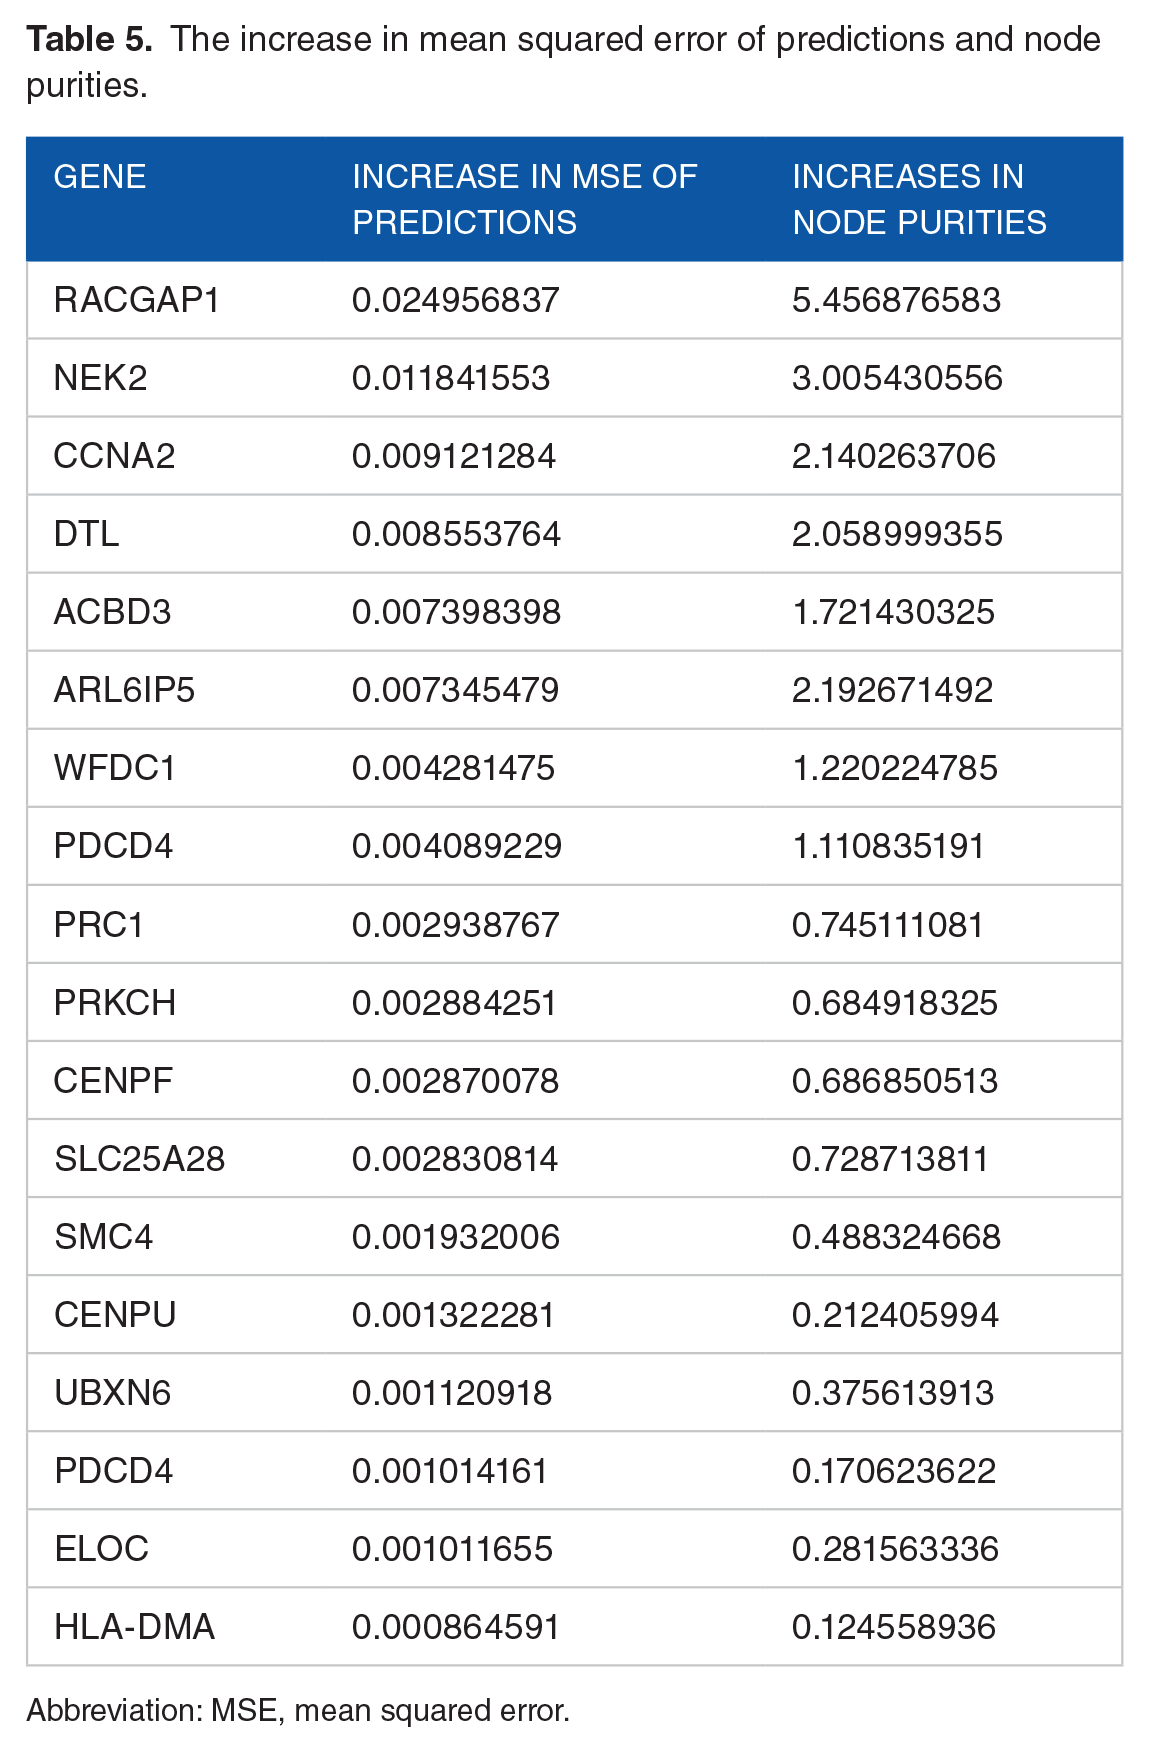
Abbreviation: MSE, mean squared error.
Table 6 presents the expression levels of proteins encoded by SNU13, CLINT1, ACBD3, NEK2, COL2A1, WFDC1, RACGAP1, CCNA2, DTL, ARL6IP5, and Programed Cell Death 4 (PDCD4) in breast tumors. The analysis of RNA sequencing expression data from breast cancer tissues and normal tissues in The Cancer Genome Atlas (TCGA) is illustrated in Figure S1 (Supplemental File), showing a significant difference in expression between normal and cancerous tissues. Additionally, the protein-protein interaction network involving RACGAP1, NEK2, and CCNA2 in breast cancer is displayed in Figure 3.
The results of expression level of proteins encoded by the selected genes in breast tumors.


Protein-Protein Interaction Network Involving RACGAP1, NEK2, and CCNA2 Proteins in Breast Cancer.
External validation
The publicly available dataset (GEO repository ID: GSE26971), generated using the Affymetrix Human Genome U133A Array, was utilized for validation purposes. The results of the concordance index are presented in Figure 4, indicating that the model based on the defined genes is significantly predictive.

Plotting the concordance index for intercept-only versus full model (7 genes) during the study period in the validation data comparing the probability that a randomly selected subject who experienced the outcome will have a higher predicted probability of having the outcome occur than a randomly selected subject who did not experience the outcome.
Enrichment analysis
The STRING database (https://string-db.org/) serves as a valuable resource for investigating potential gene interactions and their relevance to breast cancer. In this study, we examined gene interactions focused on a set of eleven genes: SNU13, CLINT1, ACBD3, NEK2, COL2A1, WFDC1, RACGAP1, CCNA2, DTL, ARL6IP5, and Programed Cell Death 4 (PDCD4). By leveraging insights gained from the interactions among RACGAP1, NEK2, and CCNA2, we can enhance our understanding of their significance in various aspects of breast cancer, including time to relapse/metastasis, identification of high-risk groups, and the risk of distant metastasis.
Discussion
BC is considered as one of the most prevalent life-threatening cancers among women worldwide. Although BC without metastasis can be controlled using advanced therapies, strategies to prevent the recurrence/metastasis of BC are rare. As the whole body can be involved in advanced stages of BC that can lead to cancer-related death of the patient, it is of great importance to identify biomarkers associated with metastasis of BC. 27 In this study, advanced statistical and machine learning methods were employed to achieve more reliable results. Gene expression data related to breast cancer (GSE2034) was reanalyzed using the component-wise likelihood-based boosting method for survival data. A small set of genes, including SNU13, CLINT1, ACBD3, NEK2, COL2A1, WFDC1, and RACGAP1, were identified as being related to time-to-relapse/metastasis in breast cancer patients. The relationship between these identified genes and metastasis time was further examined using a quantile regression model. A relapse index was created based on the 7 selected genes to categorize patients into low- and high-risk survival groups. Our findings, supported by the log-rank test, demonstrated the relapse index’s strong discrimination ability. A supervised random forest algorithm was then applied to classify the survival groups and rank the genes most critical to survival outcomes. The top 8 genes associated with the identified survival groups were RACGAP, NEK2, CCNA2, DTL, ACBD3, ARL6IP5, WFDC1, and PDCD4. Four of these genes overlapped with the Cox-Boost results, while the other 4 were newly identified in this step.
In analyzing gene expression profiles and corresponding time-to-metastasis of patients with BC, our finding showed that CCNA2 is highly expressed in identified high-risk group, which agreed with the results of other studies. Cyclin-A2, which belongs to the cyclin family, is a protein that is encoded by CCNA2 gene. The function of Cyclin-A2 is to regulate the cyclin-dependent protein CDK kinases. The findings of the present study showed that PDC4 was one of the top rank genes associated with identified survival groups. PDC4 has been shown to be a tumor suppressor and acts as an inhibitor of protein translation by interacting with the eukaryotic translation initiation factor 4A1 (eIF4A1) through binding to some mRNAs. 28 Under-expression of PDCD4 is reported to be correlated with poor prognosis in BC tumors and correlated with over-expression of oncogenic microRNA-21 (miR-21), targeting PDCD4 mRNA, which agreed with our study. 29
Our finding showed that DTL was over-expressed in the high-risk group (patients with a lower survival), which was in agreement with other studies. 30 Studies have shown that cancer patients, including those with breast cancer, who exhibit overexpression of DTL tend to have lower survival rates. DTL is upregulated in cancerous tissues compared to normal tissues and is associated with poor outcomes. 30 Additionally, it has been demonstrated that overexpression of DTL decreases the protein levels and accelerates the degradation of programed cell death 4 (PDCD4), a potential substrate of DTL. Furthermore, DTL enhances the proliferation rate and migration capabilities of cancerous cells.
The findings of this study also revealed that ADP ribosylation factor-like GTPase 6 interacting protein 5 (ARL6IP5) was associated with high- and low-risk groups. This gene has been shown to be a microtubule-binding protein involved in differentiation, apoptosis, and response to stress stimuli. ARL6IP5 has been reported to regulate cancer cell migration through its involvement in the mitogen-activated protein kinase (MAPK) signaling pathway. 31 The expression of ARL6IP5 has been shown to be mediated by ER and its increased level of expression caused by increased H2O2 levels indicates its role in oxidative stress. 31 Studies have confirmed that knocking down the ARL6IP5 in BC enhances invasion and migration of MDA-MB-231 cells and decreases inducing cell apoptosis. 32
SNU13 as a component of U4 snRNP has an essential role in mRNA splicing pathways.33,34 Zhang et al. in their study showed that the expression level of SNU13 is increased in Her-2 positive breast tumors and has a negative correlation with patients prognosis. 35 The protein encoded by CLINT1 is involved in clathrin-coated vesicle formation and vesicular transportation between Golgi and endosomes.36,37 CLINT1, as a tumor suppressor gene, associates with distant metastasis-free survival for BC patients. 38 ACBD3 is a Golgi protein that has a role in the maintenance of Golgi apparatus structure. The protein encoded by this gene also regulates several biological processes such as apoptosis and steroidogenesis. 39 The expression level of this gene is associated with tumorigenesis, metastasis, and poor prognosis of BC. 40 NEK2 has a role in the regulation of mitosis and centrosome splitting. The protein encoded by this gene as a serine/threonine kinase controls the correct separation of chromosomes through the cell cycle. 41 Upregulation of NEK2 is associates with tumorigenesis and poor prognosis for BC. 42 Type II Collagen encoded by COL2A1 is one of the major components of the extracellular matrix (ECM) and therefore has an essential role in tumor progression. 43 The expression level of this gene was associated with chemoresistance in HER2+ BC patients. 44 Moreover, miRNA-301 promotes proliferation, invasion, and chemoresistance by targeting COL2A1, FOXF2, PTEN, and BBC3. 45 The protein encoded by WFDC1 is a small protein with protease inhibitor function. Copy number variation and loss of heterozygosity for WFDC1 are common in several cancers such as BC. 46 RACGAP1 has an essential role in controlling the growth and differentiation of tumor cells. 47 The expression level of this gene is associated with poor prognosis in BC patients. 48 ACTL6A is involved in regulating several cellular functions, such as cell cycle histone acetylation and chromatin remodeling. Expression level of this gene correlates with poor prognosis in triple-negative BC. 49 SHC1, as an adaptor protein, has a role in the activation of several signaling pathways such as PI3K and RAS/MAPK. In BC patients, upregulation of this gene is associated with a worse predicted outcome. 50
These results indicated that SNU13, CLINT1, ACBD3, NEK2, COL2A1, WFDC1, and RACGAP1 have an essential role in several biological processes such as proliferation, apoptosis, invasion, stemness, and differentiation, therefore potentially playing a role in regulating the tumor genesis, distant metastasis, response to treatment, and prognosis of BC.
Our findings also revealed that there were interactions between RACGAP1, NEK2, and CCNA2 proteins in breast cancer: a) Interaction between RACGAP1 and NEK2: The collaboration observed between RACGAP1, a GTPase-activating protein, and NEK2, a serine/threonine kinase, suggests their potential involvement in breast cancer progression. Dysregulation of both genes has been associated with aggressive tumor behavior and unfavorable clinical outcomes. RACGAP1’s role in cell division and cytokinesis, along with NEK2's function in mitotic progression and centrosome duplication, indicates their joint impact on promoting invasive behavior and metastasis. Further investigation is necessary to unveil the underlying mechanisms governing this interaction. B) Interaction between RACGAP1 and CCNA2: The interaction between RACGAP1 and CCNA2 implies their interplay in breast cancer development. CCNA2, a critical regulator of the cell cycle, has been linked to aggressive tumor behavior and poor prognosis. Considering RACGAP1's involvement in cell division, its interaction with CCNA2 potentially influences cell cycle progression, contributing to tumor growth and metastasis. Unraveling the precise mechanisms and functional consequences of this interaction holds promise for enhancing our understanding of breast cancer pathogenesis. C) Interaction between NEK2 and CCNA2: The interaction between NEK2 and CCNA2 suggests their collaboration in breast cancer pathogenesis. Both genes are involved in cell cycle regulation and play essential roles in facilitating DNA replication and cell division. Dysregulation of NEK2 and CCNA2 has been associated with aggressive tumor behavior and adverse clinical outcomes. This interaction likely affects cell cycle progression and may contribute to the development of high-risk groups and an elevated risk of distant metastasis in breast cancer patients.
In this study, we utilized the Cox-Boost model due to its distinct advantages in handling survival data, particularly in the context of heart failure research. The Cox-Boost model extends the traditional Cox proportional hazards model by incorporating boosting techniques to improve predictive accuracy and variable selection. One of the key advantages of the Cox-Boost model is its ability to handle high-dimensional datasets, which is critical in our analysis given the complexity of factors influencing heart failure outcomes. Unlike conventional methods that often face challenges with multicollinearity and overfitting, the Cox-Boost model effectively identifies important predictors while maintaining robustness against data noise. 51 Additionally, this model offers a flexible framework that allows for the inclusion of unpenalized mandatory covariates, which receive a rapid coefficient build-up during the boosting steps, while other optional covariates are subjected to penalization. This approach ensures that essential covariates are incorporated efficiently, while the penalization helps manage the selection of less critical variables, reducing the risk of overfitting. 24 By leveraging these strengths, the Cox-Boost model provides a more nuanced understanding of survival patterns among heart failure patients, ultimately supporting more informed clinical decision-making and enabling personalized treatment strategies. 24 This rationale underscores our choice of the Cox-Boost model as a fitting and powerful tool for our studys objectives. The references provided in the search results offer valuable insights into the Cox-Boost model and its applications in survival analysis discuss the advantages of the Cox-Boost model in handling high-dimensional data and its ability to incorporate mandatory covariates. We also utilized censored quantile regression to calculate the probability of survival in different deciles. Time to event data are commonly skewed and semi-parametric approaches, such as quantile regression models are better choices for model fitting. 52 Future experimental validation studies are recommended.
The present study provides valuable insights for biomarker research on breast cancer metastasis-free survival. By utilizing component-wise likelihood-based boosting and random forest techniques, key metastasis-associated genes were identified and validated through Kaplan-Meier plots. From this analysis, eleven genes emerged as potential prognostic markers: SNU13, CLINT1, ACBD3, NEK2, COL2A1, WFDC1, RACGAP1, CCNA2, DTL, ARL6IP5, and PDCD4. These genes warrant further investigation to clarify their molecular mechanisms before being implemented for evaluating relapse/metastasis-free survival in breast cancer patients. Among these, RACGAP1, NEK2, and CCNA2 are particularly significant. STRING database analysis revealed interactions among these genes, emphasizing their potential role in breast cancer metastasis and patient outcomes. Further investigation into these interactions could provide critical insights into the mechanisms driving aggressive tumor behavior. However, additional experimental and clinical studies are essential to validate these findings. Keeping up with the latest scientific developments and fostering collaborations with experts in the field will be key to advancing our understanding of the interactions between RACGAP1, NEK2, and CCNA2 in breast cancer prognosis and metastasis.
Conclusion
Based on the findings of this study, the Cox-Boost model effectively identified high-risk and low-risk survival subgroups of breast cancer patients. From this analysis, a set of key genes emerged as potential prognostic markers for distant metastasis in lymph-node-negative breast cancer, including SNU13, CLINT1, ACBD3, NEK2, COL2A1, WFDC1, RACGAP1, CCNA2, DTL, ARL6IP5, and PDCD4. It is recommended that further molecular studies be conducted to validate the role of these genes in tumorigenesis, invasion, metastasis, and epithelial-mesenchymal transition in breast cancer.
Supplemental Material
sj-docx-1-cix-10.1177_11769351241297493 – Supplemental material for Prediction of Distant Metastasis of Lymph-Node-Negative Primary Breast Cancer From Gene Expression Profiling Using Cox-Boost Regression Model
Supplemental material, sj-docx-1-cix-10.1177_11769351241297493 for Prediction of Distant Metastasis of Lymph-Node-Negative Primary Breast Cancer From Gene Expression Profiling Using Cox-Boost Regression Model by Omid Hamidi, Payam Amini, Leili Tapak, Yasaman Zohrab Beigi, Saeid Afshar and Irina Dinu in Cancer Informatics
Footnotes
Acknowledgements
We would like to appreciate the Research and Technology Deputy of the Hamadan University of Medical Sciences and the Research and Technology Deputy of the Hamedan University of Technology for technical support for their approval and support of this work.
Abbreviations
BC: Breast Cancer
ER: Estrogen
GEO: Gene expression Omnibus
Authors’ Contributions
P. A., O. H. and L. T. made a substantial contribution to the concept or design of the work; or acquisition, analysis or interpretation of data, P. A., O. H., and L. T., Y. Z., S. A., and I.D. drafted the article or revised it critically for important intellectual content.
All authors approved the version to be published.
Declaration Of Conflicting Interests:
The author(s) declared no potential conflicts of interest with respect to the research, authorship, and/or publication of this article.
Funding:
The author(s) disclosed receipt of the following financial support for the research, authorship, and/or publication of this article: This study was partially supported by Hamadan University of Medical Sciences (Grant NO. 140308016662).
Ethics Approval
This study was approved by the Ethical Committee of Hamadan University of Medical Sciences (IR.UMSHA.REC.1402.309).
Consent for Publication
Not applicable.
Consent for Participation in the Study
Not applicable.
Supplemental Material
Supplemental material for this article is available online.