
Abstract
Background
Hidradenitis suppurativa (HS) is a chronic auto-inflammatory skin condition characterized by nodules, abscesses, and fistulae in skin folds. The underlying pathogenesis of HS remains unclear, and effective therapeutic drugs are limited.
Methods
We acquired mRNA expression profiles from the Gene Expression Omnibus (GEO) database and conducted differential expression analysis between control and HS samples using R software. Four machine learning algorithms (SVM, RF, ANN, and lasso) and WCGNA were utilized to identify feature genes. GO, KEGG, Metascape, and GSVA were utilized for the enrichment analysis. CIBERSORT and ssGSEA were employed to analyze immune infiltration.
Results
A total of 29 DEGs were identified, with the majority showing up-regulation in HS. Enrichment analysis revealed their involvement in immune responses and cytokine activities. KEGG analysis highlighted pathways such as IL-17 signaling, rheumatoid arthritis, and TNF signaling in HS. Immune infiltration analysis revealed the predominant presence of neutrophils, monocytes, and CD8 T cells. Machine learning algorithms and WCGNA identified KYNU as a feature gene associated with HS. We have also identified 59 potential drugs for HS based on the DEGs. Additionally, ceRNA network analysis identified the MUC19_hsa-miR-382-5p_KYNU pathway as a potential regulatory pathway.
Conclusions
KYNU emerged as a feature gene associated with HS, and the ceRNA network analysis identified the MUC19_hsa-miR-382-5p_KYNU pathway as a potential regulator.
Introduction
Hidradenitis suppurativa (HS) is a chronic autoinflammatory dermatological disorder, manifesting clinically as the presence of abscesses, sinus tracts, and scarring predominantly localized to intertriginous regions of the skin. 1 HS typically manifests during postpuberty, giving rise to symptoms such as pain, unpleasant odor, itching, and suppuration. 2 On a global scale, the prevalence of HS is approximately 1% of the global population. 3 The etiology of HS still remains unclear, although there are several identified risk factors, including a positive family history, the use of medications containing androgens, and female sex. Other factors associated with HS include metabolic syndrome, obesity, a history of smoking, and inflammatory diseases. 4
Numerous genetic variants linked to disease susceptibility, disease onset, and/or treatment response have been documented. These variants encompass genes encoding the gamma-secretase subunits, as well as those related to autoinflammatory and keratinization processes.5,6 The upregulation of PI3, TNF-α, IL-1β, and IFN-γ suggests a potential link between the inflammatory process in HS and keratinocyte hyperproliferation. Furthermore, the upregulation of KRT6, KRT16, serpin-family genes, and SPRR3, coupled with the downregulation of aquaporin-family genes, provides evidence for the involvement of hair follicles and the disruption of barrier function during the early stages of HS pathogenesis. 7 Epigenetic modifications, which encompass DNA methylation, histone modifications, and gene regulation through non-coding RNAs, play a pivotal role in shaping gene expression patterns. 8 Epidermal differentiation is regulated by epigenetic modification. 9 Given the abnormal keratinization process in HS, epigenetics likely plays a significant role in the pathogenesis of HS. There is evidence of dysregulated methylome that may underlie the pro-inflammatory microenvironment in HS. 10
The formation of HS lesions initiates with follicular occlusion, which induces dilation and subsequent rupture. This process leads to the extrusion of follicular contents, encompassing keratin and bacteria, into the adjacent dermis, triggering a robust inflammatory response characterized by the infiltration of neutrophils and lymphocytes. 11 The perifollicular inflammatory cellular infiltrate gives rise to the formation of abscesses, resulting in the destruction of the pilosebaceous unit.12,13 The immune cells within this densely heterogeneous infiltrate actively generate a plethora of pro-inflammatory cytokines, including IL-1β, IL-6, CXCL, IL-8, IL-12p70, IL-23p40, IL-17A, and IL-36, thereby establishing a robust Th17 signature. 14 The involvement of immune cells and keratinocyte-mediated products is widely recognized as crucial contributors to the pathogenesis of HS. 15 Notch signaling intricately governs the regulation of cell proliferation, differentiation, migration, and apoptosis in epidermal cells through its close interactions with various cellular pathways. Alterations in Notch signaling have been documented in the context of HS. 16 Furthermore, an alteration in tryptophan catabolism has been observed in HS skin, characterized by the excessive activation of the kynurenine pathway and subsequent cytokine stimulation by the inflammatory cell infiltrates. 17 Additionally, there is dysregulation of the aryl hydrocarbon receptor (AHR) in HS, resulting in impaired production of AHR agonists derived from bacteria and a reduced presence of bacteria capable of producing AHR ligands. 18 This discovery establishes a mechanism that links the immunological and microbiological aspects of HS lesions, similar to the observed interplay between tryptophan metabolism and the microbiota reported in Crohn’s disease.18,19
With the growing comprehension of the pathogenesis of HS, targeted therapies have garnered significant interest. Among various cytokines, TNF-α and IL-17 are recognized as key players in HS pathogenesis. Adalimumab, a TNF-α inhibitor, stands as the sole medication approved by the Food and Drug Administration (FDA) and the European Medicines Agency (EMA) for moderate-to-severe HS. However, a substantial proportion of individuals fail to achieve treatment objectives and face frequent relapses. 20 Consequently, there remains a pressing need to explore novel targets for improved therapeutic outcomes in HS.
We aimed to identify a new feature gene for HS, so we employed comprehensive bioinformatic methods to identify the feature genes associated with HS. KYNU was identified as a feature gene of HS through the application of four machine learning methods and weighted correlation network analysis (WCGNA) in our study, also plays a significant role in the tryptophan metabolic pathway. Furthermore, we investigated the competing endogenous RNA (ceRNA) network for KYNU. In particular, we identified the MUC19_hsa-miR-382-5p_KYNU pathway, which holds promise as a potential novel target for HS. In addition, we conducted an analysis using DGIdb based on the differentially expressed genes (DEGs), which provided valuable suggestions for the discovery of potential new drugs for HS. By identifying characteristic genes, analyzing enrichment pathways, and investigating ceRNA networks, we provide valuable insights that can aid in the discovery and development of new therapeutic options for HS.
Methods
Data source
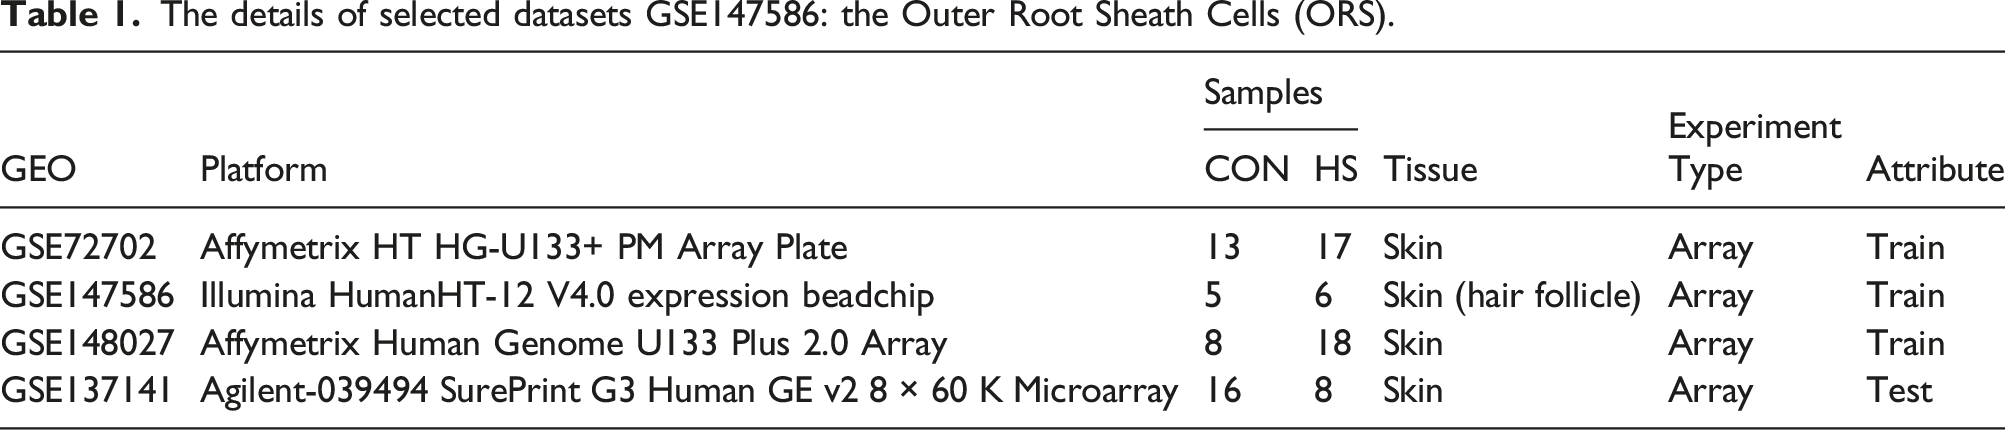
The details of selected datasets GSE147586: the Outer Root Sheath Cells (ORS).
Identification of DEGs between control and HS samples
We used the R package “limma” to identify DEGs. The Wilcoxon rank sum test was performed to compare gene expression between control and HS samples, with a significance threshold of p < .05 and logFC >2 for DEG. screening. The correlations between DEGs were analyzed and showed using the R package “corrplot,” and “circlize.” Data visualization was done using the R packages “pheatmap,” “ggpubr,” and “ggplot2.”
Functional annotation and pathway enrichment of DEGs
Enrichment analyses for the DEGs were conducted using the R tool “clusterProfiler.” 23 Additionally, Metascape (http://metascape.org) was utilized for gene annotation and analysis, enabling the identification of common and distinct pathways across various target-discovery investigations. Both Gene Ontology (GO) 24 and Kyoto Encyclopedia of Genes and Genomes (KEGG) 25 analyses were performed using the R package “clusterProfiler” as well. Gene Set Variation Analysis (GSVA) 26 was conducted using the R packages “GSEABase” and “GSVA.” These packages provide tools for assessing the enrichment or variation of gene sets in gene expression data, allowing for a comprehensive analysis of pathway or gene set activities across samples.” Pathways exhibiting adjusted p < .05 were regarded as significantly enriched.
Analysis of immune cells infiltration
The CIBERSORT algorithm (https://cibersort.stanford.edu/) was utilized to determine the proportions of 22 immune cell types in the selected datasets. 27 To evaluate the levels of immune cell infiltration between control and HS samples, the single sample gene set enrichment analysis (ssGSEA) method was employed. This allowed for the quantification of gene expression levels and the determination of infiltration grades in patients. The immune cell populations consisted of both immune-enhancing and immune-suppressive cells.
Correlation analysis between immune cells was performed using the Spearman coefficient and visualized through correlation heatmaps. A statistical significance threshold of p < .05 was used to identify significant findings.
Identification of hub genes based on machine learning methods
To screen the hub genes, four machine learning algorithms were utilized: the least absolute shrinkage and selection operator (LASSO), support vector machine (SVM), artificial neural network (ANN), and random forest (RF).
The LASSO algorithm was implemented using the “glmnet” package, which offers efficient implementations of LASSO and elastic-net regularization methods.
The SVM algorithm was performed using the “e1071” package, which provides a comprehensive set of tools for SVM model training and classification tasks.
The ANN was constructed using the “neuralnet” package, incorporating the hub DEGs. The ANN model consisted of five hidden layers and two outputs representing the control and HS categories. The training data from GSE72702, GSE147586, and GSE148027 was used to train the model. GSE137141 worked as test group. To calculate the disease classification score, the weight score of each gene was multiplied by its corresponding expression level. This scoring mechanism allowed for the evaluation and classification of samples into control and HS categories based on the ANN model's predictions.
The RF algorithm was implemented using the “randomForest” package. The error rate was computed for each tree ranging from 1 to 500, and the optimal number of trees was determined by selecting the value that yielded the lowest error rate while maintaining stability.
Next, the RF classifier was utilized to calculate the feature importance scores. Genes with an importance value exceeding the threshold of 2 were selected as the hub genes associated with HS. This selection process employed the Gini coefficient method to identify the most relevant genes. Furthermore, a nomogram was developed using the “rms” R package to predict the occurrence risk of HS. The predictive accuracy and reliability of the nomogram were evaluated using calibration curves. The clinical value of the nomogram was assessed through decision curve analysis (DCA) and clinical impact curves to determine its utility in clinical decision-making.
Weighted gene co-expression network analysis
To construct the co-expression network in the GSE72702, GSE147586, and GSE148027 cohorts, the weighted gene co-expression network analysis (WGCNA) method was employed. The construction of the network was guided by the scale-free topology criterion, which ensures the network exhibits a scale-free topology with a power-law distribution of node connections. To determine the soft threshold power and adjacencies, the “pickSoftThreshold” function of the WGCNA package was applied. The resulting adjacency matrix was converted into a topological overlap matrix (TOM). Subsequently, hierarchical clustering analysis was performed using the dissimilarity calculated from the TOM. To identify co-expressed gene modules, the dynamic tree cutting method was employed with a minimum module size of 50. This method partitions genes into modules based on their expression patterns. Next, the connection between the gene modules and HS was assessed using gene significance (GS) values and module membership (MM) values. GS represents the correlation between gene expression and the trait of interest (HS), while MM quantifies the degree of co-expression within a module. By considering both GS and MM values, the key modules associated with HS were identified, indicating potential functional relevance of these modules in the context of the disease.
Construction of the miRNA-mRNA network and ceRNA network
To investigate the relationship between messenger RNA (mRNA) and microRNA (miRNA), we employed three online miRNA databases, namely, miRanda, TargetScan, and miRDB, to predict target miRNAs. spongeScan (http://spongescan.rc.ufl.edu) has been developed as a tool for deciphering the interaction networks involving microRNAs (miRNAs) and long non-coding RNAs (lncRNAs). 28
Construction of the drugs-genes network
The DGIdb (https://dgidb.genome.wustl.edu) serves as a comprehensive database enabling the search of gene lists against established or potential drug-gene interactions. 29 In this study, we utilized the DGIdb to identify candidate drugs associated with these hub genes.
Statistical analysis
The statistical analyses were performed using R software (version 4.3.0). All p values were two-sided, and significance was indicated by p < .05.
Results
Identification of significant DEGs
To analyze the DEGs, the datasets GSE72702, GSE147586, and GSE148027 were screened. These datasets consisted of 26 control samples and 41 HS samples. In Figure 1, a detailed flowchart illustrating the research procedure is presented, outlining the step-by-step approach followed in this study. flow chart of this study design.
The data before (Figure 2 (A) and (C)) and after (Figure 2(B) and (D)) batch correction clearly demonstrated the successful elimination of the batch effect in the combined data. The top 20 up-regulated genes and down-regulated genes were depicted in Figure 2(E). We used the limma package of R to identify DEGs in this combined gene expression dataset, and |logFC(fold change)| ≥ 2 and adj.p-value <.05 were considered statistically significant. A total of 29 DEGs were screened, with the majority of them showing up-regulation in HS. Among these DEGs, only AGR3 (anterior gradient 3, protein disulphide isomerase family member), SEMA3E (semaphorin 3E), and ATP6V0A (ATPase H+ transporting V0 subunit a4) were found to be down-regulated (Figure 2 (F) and (G)). Details of the DEGs are provided in Table 2. The correlation between DEGs is demonstrated in Figure 2(H) and (i). For instance, ADAMDEC1 exhibited a highly positive correlation with S100A9, while AIM2 showed a negative correlation with SLAMF7. Differential gene expression analysis revealed significant variations between control and HS samples. (a, b, c, d) Boxplots and principal component analyses were applied to remove batch correction of GSE72702, GSE147586, and GSE148027, before batch correction (a), (c) and After batch correction (b), (d). (e) Heatmap of DEGs between the control (CON) and HS in different dataset (red represents high expression; green represents low expression). (f) Volcano plot of DEGs. The red dots in the upper right part represent upregulated DEGs. The green dots in the upper left part represent downregulated DEGs. The middle black dots represent the remaining stable genes. (g) Heatmap of DEGs. The colors from red to blue in the figure represent the expression of DEGs from high to low. The details of DEGs.

Functional and pathway enrichment analyses of DEGs in HS
Following the aforementioned steps, enrichment studies were conducted. The GO analysis of DEGs examined them from three perspectives: biological processes (BP), cellular components (CC), and molecular functions (MF). In terms of biological processes, the analysis focused on the aggregation of immune cells, specifically neutrophils, granulocytes, and leukocytes. This indicates potential involvement of these DEGs in immune cell functions and responses. For cellular components, the DEGs were found to be enriched in various components such as cornified envelope, secretory granule lumen, cytoplasmic vesicle lumen, vesicle lumen, collagen-containing extracellular matrix, and more. These findings suggest their localization and involvement in specific cellular compartments and extracellular structures. In terms of molecular functions, the DEGs were primarily associated with cytokine activity, CXCR chemokine receptor binding, receptor-ligand activity, chemokine activity, and other molecular functions. This suggests their involvement in signaling pathways, receptor interactions, and cytokine-mediated processes (Figure 3 (A)-(C)). Functional and pathway enrichment analyses of DEGs in HS. (a)-(c) Barplot (a), bubble plot (b), and circle plot (c) of GO analysis based on DEGs. (c)-(e) Circle plot (c), barplot (d), and bubble plot (e) of KEGG analysis based on DEGs. (f) GSVA based on DEGs. (g)-(i) Metascape analysis based on DEGs.
The KEGG analysis revealed that the DEGs were predominantly enriched in significant pathways, including the IL-17 signaling pathway, rheumatoid arthritis, viral protein interaction with cytokine and cytokine receptor, amoebiasis, TNF signaling pathway, cytokine–cytokine receptor interaction, cytosolic DNA-sensing pathway, Toll-like receptor signaling pathway, and several others (Figure 3 (D)-(E)). The GSVA demonstrated that the DEGs were prominently enriched in basal cell carcinoma and leishmania infection pathways. This indicates that both leishmania infection and basal cell carcinoma share similar underlying mechanisms with HS (Figure 3(G)). The Metascape analysis revealed that DEGs were primarily associated with skin lesion, inflammation, atopic dermatitis, and glomerulonephritis. It is intriguing to observe that these DEGs are associated with the NABA matrisome (Figure 3 (H)-(i)).
Immuno-infiltration landscape between control and HS.
A total of 26 control samples and 41 HS samples were considered eligible for the CIBERSORT analysis (p < .05). First, the composition of 22 different immune cell types in each sample was visualized using a histogram (Figure 4 (A)). In the histogram, the color representation corresponds to the percentage of each immune cell type in each sample, with the total sum equaling 1. The analysis results indicated that the predominant infiltrating immune cell types in the samples were neutrophils, monocytes, resting NK cells, CD8 T cells, naïve CD4 T cells, resting memory CD4 T cells, and naïve B cells. The results of the Wilcoxon test are displayed in Figure 4(B) as a violin plot, highlighting that eosinophils showed statistical significance with p < .05. Due to the substantial within-variance observed in immune cells within the HS group, no statistically significant conclusions could be drawn when comparing it with the control group. The large variability in immune cell populations within the HS group indicates a diverse immune response among individuals, making it challenging to establish significant differences between the two groups Immuno-infiltration landscape between control and HS samples. The composition of 22 kinds of immune cells in each sample was showed in a histogram (a) and a violin diagram (b). (c) The correlation of 22 types of immune cells and the correlation between immune cells and DEGs in HS samples were evaluated. (d) Different immune infiltration between control and HS samples evaluated by ssGSEA.
Identification of hub genes in HS using machine learning algorithms and WCGNA
All samples in GSE72702, GSE147586, and GSE148027 were clustered and included in the WCGNA. An initial soft-threshold approach was used to implement our WGCNA approach. We first assessed the reliability of the network but detected no outlier samples in need of deletion (Figure 5(A)). After testing thresholding powers from 1 to 20, a power value of 8 was selected as at this value the connectivity between genes in the network was consistent with a scale-free network distribution, leading to the generation of two modules (Figure 5(B)). These modules were designated using colors, with 499 and 155 genes in the turquoise and gray modules, respectively. The turquoise modules were found to be more highly negatively correlated with HS than gray modules (Figure 5(C) and (D)). This observation suggests that the turquoise modules may be associated with the suppression or downregulation of HS. Notably, a hub gene usually has a high gene significance (GS) and high module membership (MM). By overlapping the genes of the turquoise module with identified DEGs and applying the cutoff of GS >0.5 and MM >0.8, the top 137 genes were identified. The list of hub genes of module turquoise could be seen in Additional Table1. Identification of hub genes in HS using WCGNA (a) Hierarchical clustering trees of 42 HS samples mRNAs expression patterns. (b) Power value screening by WGCNA. When the power value is 8, R2 > 0.8, the average connection degree <100. (c)The cluster dendrogram of co-expressed mRNAs identified in datasets GSE72702, GSE147586, and GSE148027. Each branch in the figure represents 1 gene, and every color below represents 1 co-expression module. (d) Heatmap of the correlation between module genes and HS. The turquoise module was the most positively correlated with HS. (e) Module Membership in turquoise module. (f), (g) Barplot (f) and bubble plot (g) of GO analysis based on hub genes of module turquoise. (h), (i) Barplot (h) and bubble plot (i) of KEGG analysis based on hub genes of module turquoise.
Based on the hub genes identified from the turquoise module, we conducted GO analysis and KEGG analysis to gain insights into their functional implications. The GO analysis revealed that these hub genes were primarily associated with the regulation of cell-cell adhesion, particularly immune cell adhesion, as well as the activation of immune cells (Figure 5(E) and (F)). This suggests that there might be impaired skin barrier function and inflammatory activation in HS. The KEGG analysis of the hub genes from the turquoise module revealed their association with the signaling pathway of immune response (Figure 5(G) and (H)). This finding suggests that these genes play a crucial role in regulating immune responses in HS.
Afterward, Four machine learning algorithms, namely, LASSO, SVM, ANN, and RF were employed to screen and identify signature genes from the pool of candidate key genes in HS. In the RF classifier, the optimal number of trees selected was determined to be 20 (Figure 6(A)). This choice was made based on evaluating the error rates and stability of the classifier for different numbers of trees. Moreover, based on the importance derived from the MeanDecreaseGini result, the hub genes identified were KYNU, IFI27, ADAMDEC1, IL24, SERPINB3, and TDO2 (Figure 6(B)). Furthermore, the clinical impact curve further substantiated the substantial benefit and superior predictive performance of the nomogram, seven hub genes, each possessing a gene importance score exceeding 2, were chosen to construct a nomogram using the “rms” package in the R programming language. This nomogram aims to assess the risk of HS (Figure 6(C)). In addition, we developed a scoring model tailored specifically for HS by utilizing ANN analysis to determine weights for hub genes selected through RF analysis. The ANN architecture employed in the training dataset involved seven input layers, five hidden layers, and two output layers. Leveraging the “neuralnet” package in R, we successfully constructed an ANN model for HS to effectively classify gene expression data between control and HS samples (Figure 6(D)). The performance of the model was assessed by calculating the area under the receiver operating characteristic (ROC) curve (AUC) (Figure 6(E)). In the training dataset, the model exhibited an impressive AUC of 0.998, indicating its exceptional ability to accurately classify gene expression data between control and HS samples. Identification of hub genes in HS using machine learning algorithms. (a) The random forest model displayed the influence of the number of decision trees on the error rate. (b) The importance of the HS-related feature genes based on the RF model. (c)Establishment of a nomogram model. (d) Results of ANN visualization. (e) The AUC analysis of the ANN diagnosis model in the training group GSE72702, GSE147586, and GSE148027. (f), (g) Errors (f) and accuracy (g) of the SVM model. (h), (i) The lambda values (h) and minimum (i) of DEGs were identified by the LASSO logistic regression algorithm. (j) A Venn diagram was used to identify the hub genes in HS. (k) The AUC analysis of KYNU in GSE137141. (L) Differential expression analysis of KYNU between control and HS group in GSE137141.
By employing the SVM algorithm, we performed a rigorous selection process to identify hub genes associated with HS. A comprehensive analysis revealed a total of five genes that emerged as significant features: S100A9, KYNU, EGFL6, SEMA3E, and TDO2 (Figure 5(F) and (G)). Furthermore, we applied the LASSO algorithm to identify a set of eight genes that exhibit significant relevance to HS. These genes include KYNU, ADAMDEC1, SERPINB3, SPRR2B, PLAC8, EGFL6, SEMA3E, and IFI27 (Figure 5(H) and (i)).
KYNU has consistently been identified as a hub gene associated with HS through the screening of four machine learning methods and WGCNA (Figure 6(J)). To further validate this finding, we utilized the GSE137141 dataset as a test dataset. In this independent evaluation, KYNU achieved an area under the receiver operating characteristic curve (AUC) of 0.773 (Figure 6(K)). In the GSE137141 dataset, we observed a significant difference in the expression of KYNU between the control group and HS group (Figure 6(L)). However, there was no significant difference in KYNU expression between the control group and HS group. These findings suggest that KYNU may be specifically dysregulated in HS, highlighting its potential as a biomarker or therapeutic target for this condition. This robust and comprehensive analysis consistently highlights the significant role of KYNU in the development and progression of HS.
Drug-gene interaction analyses screen prospective medicines for HS
Given the existing unmet medical needs, there is a crucial requirement for in-depth studies and research focused on identifying potential therapeutic interventions for HS. To identify potential drugs for HS, we analyzed the 29 DEGs in the DGIbd database. A total of 59 medications were selected, and Cytoscape was applied to show how the drugs associate with DEGs (Figure 7(A)). We have uncovered numerous previously unreported new drugs, which encompass Elotuzumab (an anti-SLAMF7 antibody), NI-0801 (an anti-CXCL10 antibody), Ritonavir (a protease inhibitor), Stavudine (an antiretroviral medication), Atropine (an anticholinergic medication), Oxaliplatin (a platinum-based antineoplastic agent), Eldelumab (an anti-CXCL10 antibody), Zidovudine (an antiretroviral medication), and more. This analysis provides valuable insights and a starting point for identifying potential therapeutic options that could be explored further for the management of HS. Construction of the ceRNA network and network of drug-gene interactions. (a) Construction of the network of drug-gene interactions based on DEGs. The blue circles represent the DEGs, purple circles represent the potential drugs. (b) Construction of ceRNA network of KYNU. The blue rectangle represents KYNU, the blue diamonds represent the miRNAs, the blue circle represents the lncRNA.
Construction of the ceRNA networks and the potential RNA regulatory pathways
The regulatory role of miRNAs in gene expression involves their binding to target mRNAs, leading to gene silencing and downregulation. In order to identify potential miRNAs that interact with the hub gene KYNU, we employed three available miRNA databases. These databases were utilized to estimate the target miRNAs that are predicted to bind to KYNU (Figure 7(B)). We have identified five mRNA-miRNA pairings and their respective target miRNAs that are predicted to interact with KYNU. To investigate the potential regulatory role of lncRNAs on the selected miRNAs, we employed the Spongescan to predict and identify lncRNAs that are connected to the selected miRNAs. Based on the prediction results, we generated a miRNA-mRNA network using Cytoscape. The identification of important RNA regulatory pathways, such as the MUC19_hsa-miR-382-5p_KYNU pathway, holds significant promise for gaining insight into the molecular mechanisms underlying HS.
Discussion
Hidradenitis suppurativa, also referred to as acne inversa, is a chronic autoinflammatory skin disease that impacts approximately 1% of the global population. 3 Due to its chronic nature and frequently occurring relapses, HS significantly impacts the quality of life for affected individuals. The disease's profound effects extend beyond physical symptoms, affecting various aspects of patients' lives, including social interactions, work productivity, and psychological well-being. 30 Indeed, prompt treatment and novel biomarkers are crucial in managing the burden of HS.
Currently, available medications are limited and mostly used off-label, while surgical interventions are frequently required to achieve remission. Immunomodulatory therapies targeting specific cytokines have shown potential in controlling HS. Adalimumab, a TNF-α blocker, is the only FDA-approved biological drug for moderate-to-severe HS, while selective inhibitors for other cytokines like IL-12/23 and IL-17 are still in early stages of development.31,32 Gentamicin, Ibudilast, Spironolactone, Trastuzumab, Thalidomide, Apremilast, Glucosamine, Interferon-alpha-2b, Binimetinib, and Midostaurin have previously been identified as repurposed drugs for the treatment of HS. 33
SLAMF7, identified as one of the DEGs in our study, is primarily expressed by NK cells, T lymphocytes, activated B cells, and macrophages. Notably, it exhibits high expression on myeloma cells while maintaining low expression on normal cells. As a result, the anti-SLAMF7 antibody, Elotuzumab, is predominantly utilized in the treatment of multiple myeloma. 34 HS is associated with a hormonal imbalance, specifically involving sex hormones, and there is a higher prevalence of female patients with HS. Therefore, targeting the PI3 (Phosphoinositide 3-Kinase) pathway with Progesterone may serve as an adjunctive treatment approach for HS. 35 Truncal obesity, hypertension, type II diabetes mellitus, and dyslipoproteinemia, all characteristic features of metabolic syndrome, are commonly observed among patients with HS. In fact, metabolic syndrome is detected in 32.4% of individuals with HS. 36 This aligns with the drugs we identified based on DEGs, which include Insulin and Atorvastatin. The significant upregulation of CXCL10 (C-X-C motif chemokine 10) in HS suggests that targeting CXCL10 with drugs such as NI-0801, Regramostim, Ritonavir, Stavudine, Atropine, Oxaliplatin, Eldelumab, and Zidovudine may hold promise for potential improvements in HS. The notable upregulation of MMP12 (matrix metallopeptidase 12) in HS indicates that targeting MMP12 with drugs like Deferoxamine, Zileuton, Acetazolamide, and Captopril may offer potential avenues for enhancing HS treatment. It's worth noting that the latter three medications are also employed in the management of hypertension. The substantial upregulation of SPP1 (Secreted Phosphoprotein 1) in HS indicates that targeting SPP1 with drugs like ASK-80, Calcitonin, Alteplase, Wortmannin, Gentamicin, and Tacrolimus may offer promising prospects for enhancing HS treatment. Notably, Gentamicin 37 and Tacrolimus 38 have already been utilized in the treatment of HS. IL-1 is also a target for drug development in HS. 39 There have been experiments applying Anakinra, 40 Bermekimab 41 in the treatment of HS, and both have been confirmed to be safe and effective. However, Canakinumab, which targets IL-1β, has shown varying results in case reports and series. 42 Here, we have identified 30 potential HS drugs targeting IL-1β. Tasquinimod and Paquinimod, both targeting S100A9 (S100 calcium binding protein A9), represent additional potential medications for HS. However, the clinical efficacy and safety of those novel medications remains modest. Future translational studies are needed to gain a better understanding of this complex skin disorder.
HS is often associated with a range of comorbidities. One notable comorbidity is the follicular occlusion triad, which includes HS, acne conglobata, and dissecting cellulitis affecting the scalp. The follicular occlusion tetrad can be formed when the triad is concomitantly present with pilonidal sinus. 43 The comorbidities commonly associated with HS primarily encompass autoimmune diseases, including ulcerative colitis, Crohn's disease, and seronegative spondyloarthropathies.44,45 A meta-analysis of observational studies involving 6174 HS patients and 24,993 controls found significant associations between HS and obesity, central obesity, smoking (both active and history), hypertriglyceridemia, low high-density lipoproteins, diabetes, and metabolic syndrome. 46 HS has also been linked to an increased risk of long-term opioid use, as well as comorbidities such as psoriasis, alopecia areata, pyoderma gangrenosum, vitiligo, rheumatoid arthritis, and non-melanoma skin cancer. 47 HS can also manifest as a component of autoimmune syndromes, including Pyoderma Gangrenosum, Acne, and Suppurative Hidradenitis (PASH); Pyogenic Arthritis, Pyoderma Gangrenosum, Acne, and Suppurative Hidradenitis (PAPASH); Psoriatic Arthritis, Pyoderma Gangrenosum, Acne, Suppurative Hidradenitis (PsAPASH); and Pyoderma Gangrenosum, Acne, Suppurative Hidradenitis, and Ankylosing Spondylitis (PASS). 48 The enrichment analysis of DEGs not only confirmed the correlation between HS and the mentioned comorbidities but also revealed potential associations with various infections such as amoebiasis, influenza A, legionellosis, helicobacter pylori infection, leishmania infection, human papillomavirus infection, aggressive periodontitis, acute periodontitis, keratitis, myocarditis, and pertussis. Additionally, HS has been found to be associated with autoimmune disorders including glomerulonephritis, tubal abortion, early pregnancy loss, and bullous pemphigoid. Exploring the links between these diseases and HS can provide a deeper understanding of the pathogenesis of HS and aid clinicians in providing comprehensive medical advice to HS patients.
In this study, we identified KYNU as a new feature gene for HS. KYNU is an enzyme that functions as a hydrolase and plays a significant role in the metabolism of tryptophan. It is involved in the synthesis of NAD + cofactors through the Kynurenine pathway, which serves as a crucial pathway for the catabolism of L-tryptophan in both bacteria and eukaryotes. 49 In this pathway, KYNU catalyzes the conversion of L-kynurenine (in bacteria) and 3-hydroxy-L-kynurenine (3HK) (in eukaryotes) using a pyridoxal-5′-phosphate (PLP) dependent mechanism. This enzymatic reaction results in the production of anthranilic acid and 3-hydroxyanthranilic acid (3-HAA), respectively. KYNU is widely expressed in nearly all organs of the body, with particularly elevated levels observed in the liver, urinary bladder, and appendix. 50 KYNU is involved in various inflammatory skin diseases,51–55 cardiovascular diseases, 56 inflammatory bowel disease,57,58 and several types of cancers,59–63 exerting its effects through diverse pathways. While previous studies have indicated abnormalities in tryptophan metabolism within HS lesions, 18 there is currently a scarcity of research confirming the distinctive expression pattern of KYNU specifically in HS. Our study provides novel evidence demonstrating that KYNU serves as a signature gene specifically associated with HS. Given the challenges in developing successful animal models for HS and the inherent difficulty in obtaining clinical samples, we opted to utilize a transformed dataset (GSE137141) for the validation of KYNU.
miRNAs are a class of endogenous, non-protein-coding RNAs, typically short in length (ranging from 19 to 23 nucleotides). They exert gene-regulating effects by either suppressing or promoting gene expression through translational repression or degradation of target mRNAs. miRNAs achieve this by binding to the 3′-untranslated region (3′-UTR) of target mRNAs via sequence complementarity and recruiting nucleases to suppress mRNA expression. High complementarity between target mRNAs and miRNAs leads to mRNA degradation, whereas partial complementarity inhibits the translation of the target mRNAs. 64 High expression levels of miRNA-155-5p, miRNA-223-5p, miRNA-31-5p, miRNA-21-5p, and miRNA-146a-5p were observed in HS. 65 Another study revealed significant differences in the expression of miR-24-1-5p, miR-146a-5p, miR26a-5p, miR-206, miR338-3p, and miR-338-5p in HS. 66 Currently, there is a lack of studies investigating the role of lncRNA in HS. In our study, we performed a comprehensive analysis and successfully constructed a ceRNA network of KYNU specifically for HS. Through this analysis, we identified the MUC19_hsa-miR-382-5p_KYNU pathway as a potential novel target for HS. This finding suggests that targeting this pathway could hold promise for the development of new therapeutic strategies in the management of HS.
In this study, there is a significant variation in the analysis of immune infiltration within HS, which may be related to the disease staging and the presence of other complications. However, not all of the datasets included clinical information about patients, such as weight, smoking history, race, lifestyle, comorbidities, and various HS phenotypes. Therefore, clinical information was not taken into consideration in our analysis. GSE147586 consists of the outer root sheath cells (ORS) derived from the hair follicle, while the rest of the dataset samples are from the skin (specific location not described). We have combined them for analysis with the aim of identifying a common biomarker for HS. KYNU exhibits significant differences between the control and HS groups in GSE137141, which also serves to validate the effectiveness of this biomarker. Ultimately, our study design involves the re-analysis of previously published transcriptomic data and the aggregation of evidence regarding transcriptional changes. Therefore, we were unable to confirm our results at the translational level. Nevertheless, we hope that our findings and conclusions will inspire new functional studies aimed at validating our discoveries at the protein and tissue level.
Conclusion
This study successfully identified KYNU as a novel biomarker for HS. In addition, the study developed a ceRNA network and proposed the potential RNA regulatory pathway MUC19_hsa-miR-382-5p_KYNU underlying HS. We have also identified 59 potential drugs for HS based on the DEGs. Furthermore, through comprehensive enrichment analysis of DEGs, the study revealed the associations between HS and various infections as well as autoimmune disorders. These multifaceted findings not only enhance our understanding of HS but also pave the way for exploring its potential medications, thus broadening our insights into the disease.
Footnotes
Acknowledgments
We thank the associate editor and the reviewers for their useful feedback that improved this paper.
Declaration of conflicting interests
The author(s) declared no potential conflicts of interest with respect to the research, authorship, and/or publication of this article.
Funding
The author(s) received no financial support for the research, authorship, and/or publication of this article.