
Abstract
Background:
Ameloblastoma (AM) is a benign tumor locally originated from odontogenic epithelium that is commonly found in the jaw. This tumor makes aggressive invasions and has a high recurrence rate. This study aimed to investigate the differentially expressed genes (DEGs), biological function alterations, disease targets, and existing drugs for AM using bioinformatics analysis.
Methods:
The data set of AM was retrieved from the GEO database (GSE132474) and identified the DEGs using bioinformatics analysis. The biological alteration analysis was applied to Gene Ontology (GO) and Kyoto Encyclopedia of Genes and Genomes (KEGG) pathways. Protein-protein interaction (PPI) network analysis and hub gene identification were screened through NetworkAnalyst. The transcription factor-protein network was constructed via OmicsNet. We also identified candidate compounds from L1000CDS2 database. The target of AM and candidate compounds were verified using docking simulation.
Results:
Totally, 611 DEGs were identified. The biological function enrichment analysis revealed glycosaminoglycan and GABA (γ-aminobutyric acid) signaling were most significantly up-regulated and down-regulated in AM, respectively. Subsequently, hub genes and transcription factors were screened via the network and showed FOS protein was found in both networks. Furthermore, we evaluated FOS protein to be a therapeutic target in AMs. Candidate compounds were screened and verified using docking simulation. Tanespimycin showed the greatest affinity binding value to bind FOS protein.
Conclusions:
This study presented the underlying molecular mechanisms of disease pathogenesis, biological alteration, and important pathways of AMs and provided a candidate compound, Tanespimycin, targeting FOS protein for the treatment of AMs.
Keywords
Introduction
Ameloblastoma (AM) is an aggressive benign odontogenic tumor. It is originated from tooth-generating tissue or a dental follicle. 1 Although AM is found in 1% of all tumors in the jaw region, they are known as the second commonest odontogenic tumor. 2 The pathogenesis of odontogenic tumors is obscured. Several studies were performed to identify genetic deregulations and molecular alterations in an attempt to explain the mechanisms of oncogenesis, cytodifferentiation, and tumor progression. 3
Ameloblastoma presents locally invasive behavior with a high recurrence rate. 4 Standard therapy for AM is surgical excision with a margin of at least 1 cm. After surgical treatment, aggressive clinical characteristics cause patients to suffer from cosmetic and functional deformities. 5
Despite efforts focused on understanding the molecular pathogenesis of odontogenic tumors such as molecular pathways and gene deregulations in these tumors that could be used for treatment. 6 In silico approaches, such as bioinformatic analysis, have been performed to investigate signaling pathways, protein interactions, gene-drug prediction signature, and gene expression to obtain the best understanding of the pathological mechanisms of several diseases. 7 The computational method is an important tool to understand molecular aspects of oral pathology and medicine. 8 This study aimed to comprehensively investigate and analyze the differentially expressed genes (DEGs), biological function alterations, disease targets, and existing drugs for therapeutic strategies for AM through bioinformatics analysis.
Materials and Methods
Data collection
GSE132474 (GPL16699 Agilent-039494 SurePrint G3 Human GE v2 8x60K Microarray 039381) was obtained from the GEO data set, The National Center for Biotechnology Information (NCBI) database (https://www.ncbi.nlm.nih.gov/gds/?term=GSE132474). 9 The study was designed to perform expression and genome variation profiling using an array in AM. The patient samples consist of 8 AM tumor tissues and 8 normal oral tissues.
Data processing for differentially expressed gene identification
The data were organized using R package through GEO2R (https://www.ncbi.nlm.nih.gov/geo/geo2r/). The differences in gene expression profiles between the selected GEO data sets were normalized, aggregated, and produced the DEG data matrix. The P-value was set as ⩽.05 and log fold change ⩾ 1.
Biological alteration and enriched pathway analysis
Gene Ontology (GO) and Kyoto Encyclopedia of Genes and Genomes (KEGG) pathways were analyzed using the annotation, visualization, and integrated discovery (DAVID) database (https://david.ncifcrf.gov/). The results from the submitted list of DEGs were filtered using a statistical cutoff of P < .05, and the background reference was set to the whole genome annotation for the human genome (homo sapiens). The significantly enriched top 10 GO and KEGG terms were plotted as a dotplot and dendrogram.
Protein-protein network interaction and hub-gene identification
To explore protein’s molecular functions (MFs) and cell regulatory mechanisms, the DEGs in up-regulation and down-regulation were mapped using NetworkAnalyst (https://www.networkanalyst.ca). 10 The 10 hub genes were identified using the 10 highest betweenness scores.
Transcription factor genes network interaction
Transcription factor (TF)-genes regulatory network interaction was constructed to investigate the regulation of TFs at the molecular level. The DEGs were used to imply into OmicsNet database (https://www.omicsnet.ca/faces/home.xhtml), and the TF-genes network was mapped to identify the most significant TF. 11
Modular analysis using protein network
For further exploration of densely interacting modular in protein network, the Molecular Complex Detection (MCODE) plugin in Cytoscape which detects modules or densely interacting nodes in the protein network. 12 The default parameters such as degree cutoff = 2, node score cutoff = 0.2, and k-Core of 2 in MCODE were applied in the Metascape database. The Metascape Database (https://metascape.org/) was used to perform enrichment analysis and integrated multiple data resources including GO, KEGG, UniProt, and DrugBank, which provides pathway enrichment, annotation of biological processes (BPs), genetic pathway visualization, interpretation, and analysis. For the identification of enriched pathways regulated using DEGs in the top modules, the ClueGO app of Cytoscape was employed for the identification of enriched pathways with a P ⩽ .05 as a threshold and kappa statistics were used to construct and compare networks of functionally related GO terms and Reactome pathways. 13
Small molecule drugs screening
The resulting list of up-DEGs and down-DEGs was implied into L1000CDS 2 for screening of small molecule agents by retrieving information including drug classification, mechanism of action, existing indication, targeting pathways, and clinical trials. 14
Validation of small molecules and targets using SwissDock
The canonical simplified molecular-input line-entry system (SMILES) of small molecules was obtained from PubChem (https://pubchem.ncbi.nlm.nih.gov/). Then, the amino acid sequence of selected proteins was obtained from GenBank NCBI and corresponded to the NCBI references. The 3-dimensional structure was generated from the corresponding PDB format. After the preparation of the ligands and proteins, molecular docking calculations were performed using SwissDock (https://www.swissdock.ch/). 15 The docking study corresponded to a system with flexible ligand rigid protein. Using specific scoring features based on energy terms, the best protein-ligand binding model was obtained. Interaction types and distances were evaluated with the UCSF chimera program and discovery studio visualizer. 16 The lowest binding energy (kcal/mol) was used as the standard comparison.
Statistical analysis
A moderated t-test was applied to identify DEGs, and Fisher’s exact test was used to test for enrichment in GO terms and KEGG pathways. The value of P < 0.05 was considered to be statistically significant and log fold change was set as 1 ⩾ FC ⩽ 1.
Results
Differentially expressed genes’ analysis
A total of 611 DEGs were identified consisting of 207 up-regulated genes and 404 down-regulated genes. Differentially expressed genes in individual samples were shown in Supplementary Material 1 and Figure 1A. Moreover, the volcano plot and clustering heatmap were generated in Figure 1B and C, respectively. Each dot in the volcano plot represents a gene. The clustering heatmap results demonstrated that the expression of DEGs between 2 groups of samples was significantly different.

(A) Standardized of gene expressions. (B) Volcano plot of DEGs between normal and AM (GSE132474). (C) Gene expression clustering heatmap of DEGs. The green color represents up-regulated genes, and the red color represents down-regulated genes.
Biological functions alterations and enrichment pathways
A total of GO terms were enriched in up-regulated and down-regulated genes, including BP, MF, and cellular components (CCs). The up-regulated genes mostly were regulation of cellular senescence, ribonuclease P RNA binding, and platelet alpha granule lumen. The down-regulated genes significantly were positive regulation of DNA damage response, signal transduction by P53 class mediator, neutrophin-receptor binding, and spliceosomal complex in BP, MF, and CC, respectively, as shown in Figure 2A to F.

Gene ontology analysis of DEGs. X-axis reflects gene count and Y-axis reflects GO terms. The dot size reflects the P-value (−log10(P-value)). The enriched up-regulated and down-regulated GO term is categorized into the biological process (A, D), molecular function (B, E), and cellular function (C, F).
In addition, the up-regulated and down-regulated DEGs were related to KEGG pathways, including glycosaminoglycan biosynthesis, chondroitin sulfate (CS)/dermatan sulfate, and morphine addiction consequently as shown in Figure 3A to D.
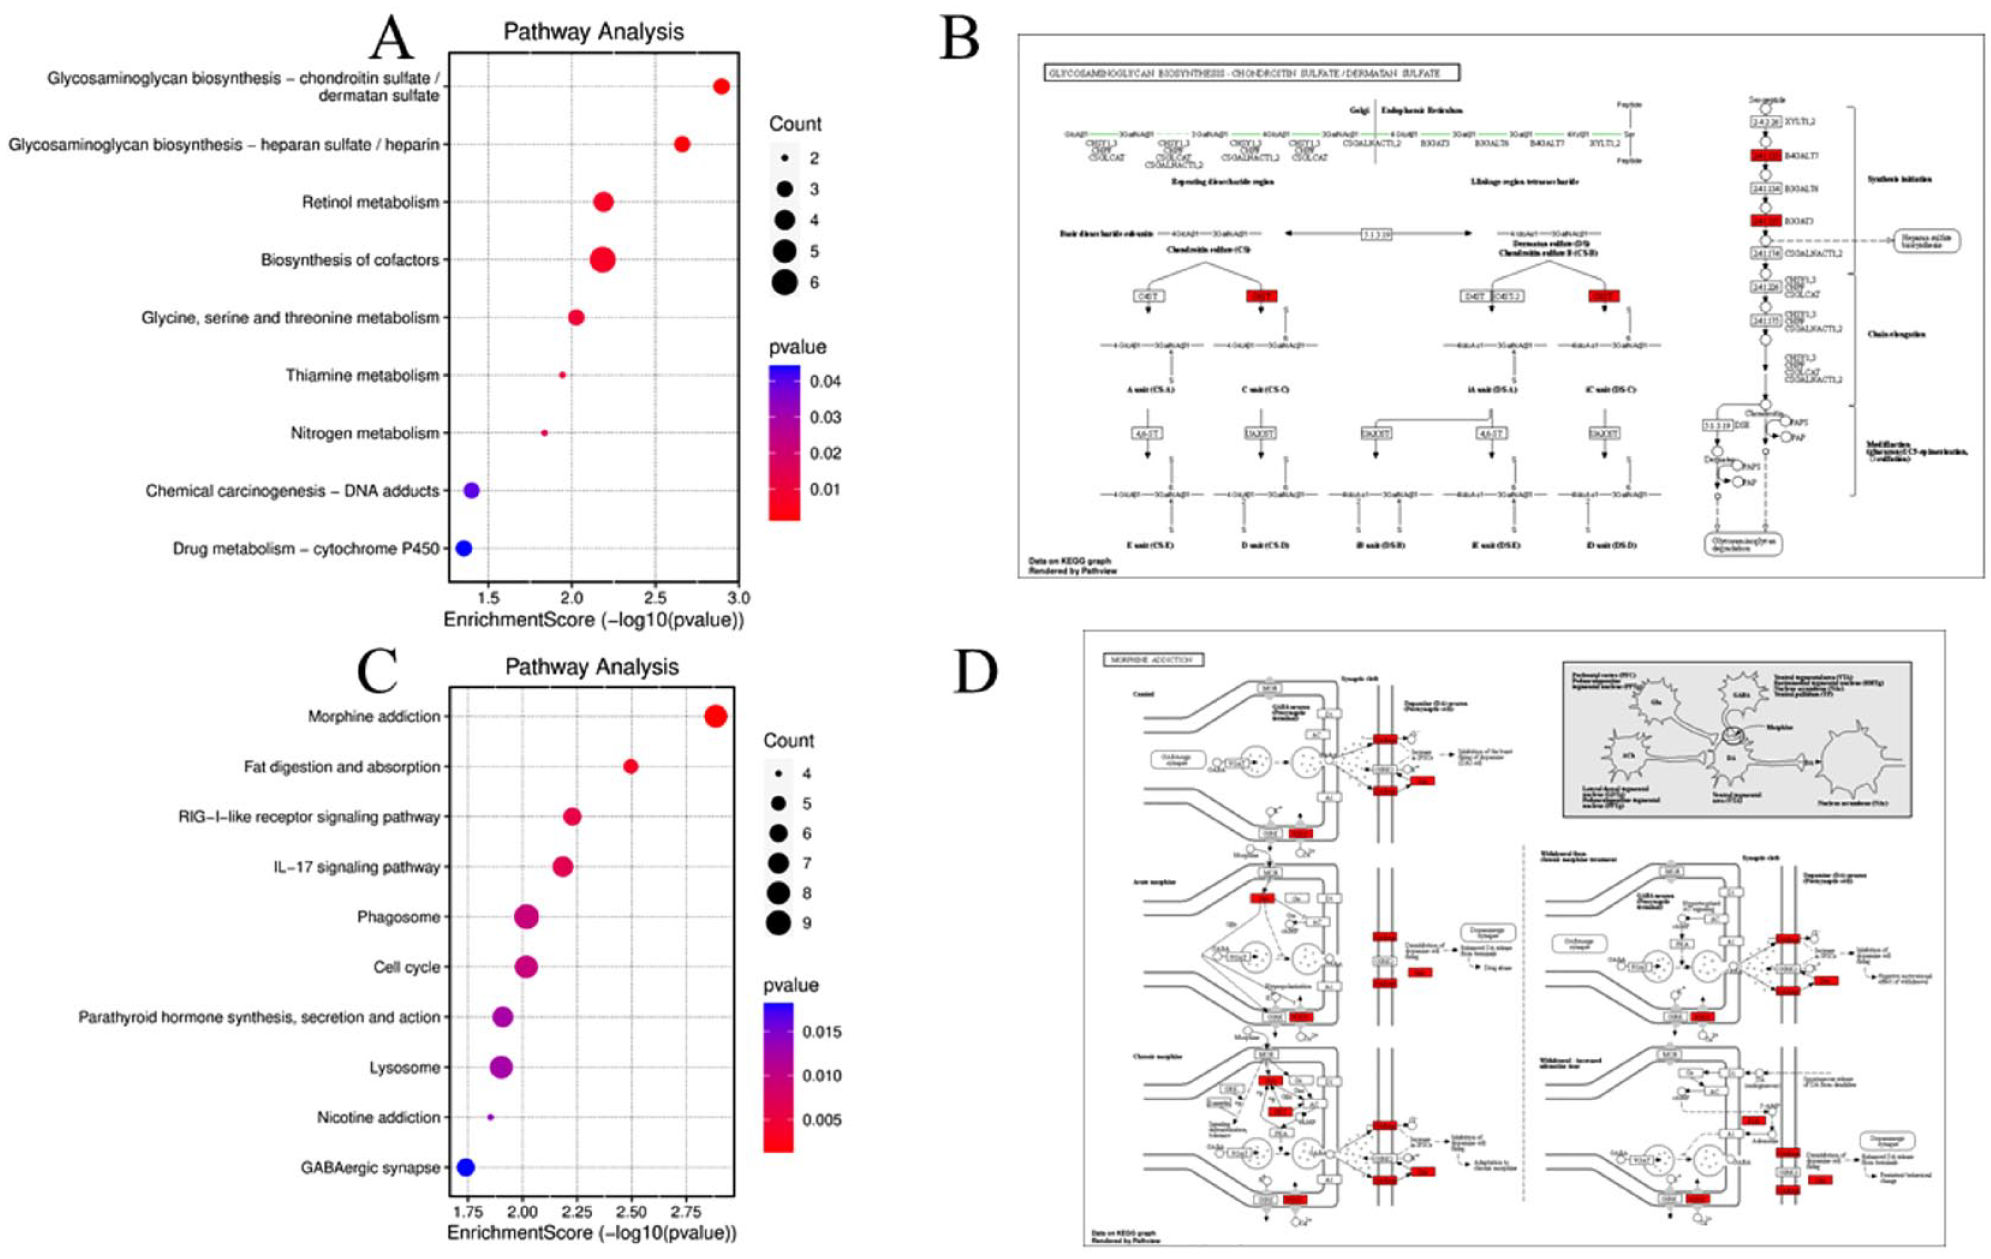
KEGG pathway enrichment analysis of the DEGs (P < .05). (A) The top 10 enriched pathways associated with up-regulated DEGs. (C) The top 10 enriched pathways associated with down-regulated DEGs. (B, D) The most significant pathways of up-regulated and down-regulated signaling pathways.
Hub gene and significant modules
The PPI network of DEGs was established using NetworkAnalyst. The most 10 hub genes were identified including YAP1, TRAP2, POT1, EIF3G, FOS, TAB1, SMARCE1, GADD45G, SRRM2, and UBE2D4. The hub genes were then selected and investigated for expression status in AM (Table 1). The visualized PPI network was shown in Figure 4A and B.
The top 10 hub genes were selected from the protein-protein interaction network.


(A) Protein-protein interaction (PPI) network of DEGs. (B) The most 10 hub genes were selected using the highest betweenness scores. The violin plot showed the level of gene expression, the pink color represents AM, and the green color represents normal.
Furthermore, the functional enrichment analysis was performed using Metascape. The results showed that extracellular matrix (ECM) organization, NABA core matrisome, NABA matrisome associated, collagen formation, and supramolecular fiber organization are the most 5 significantly enriched modules (Figure 5A and B).

The enrichment analysis of DEGs using Metascape. (A) The network of enriched terms is colored by cluster identity, in which the nodes that share the same cluster identity are typically close to each other. (B) The network of enriched terms is colored by P-value, in which the terms containing more genes tend to have a more significant P-value.
Transcription factor-genes regulation network analysis
To investigate the important TFs and modulation activity of all DEGs, the DEGs were applied to the OmicsNet database. The network of TF-genes interaction was shown in Figure 6A. The results demonstrated that FOXF2, JUND, SOX10, FOS, REST, and TFAP2A were the most 6 significantly high modulations of their genes among DEGs. The status of the TF expression was shown in Figure 6B.

(A) The transcription factor (TF)-genes network analysis. (B) The top 6 transcription factors were selected to investigate the level of expression using the highest betweenness score. The violin plot showed the level of gene expression, the pink color represents AM, and the green color represents normal.
Identification of small molecule drugs
The displays a clustergram of the top small molecule candidates expected to be best revert the DEGs of AM according to LINCS L1000CDS 2 output and delineates that predicted up-regulation and down-regulation of each drug with respect to each DEG. The complete list containing 50 individual small molecules is shown in Figure 7. The 5 small molecules including CGP-60474, Salermide, Luminespib (NVP-AUY922), Geldanamycin, and Tanespimycin were selected for target testing with the hub genes using docking simulation through SwissDock.
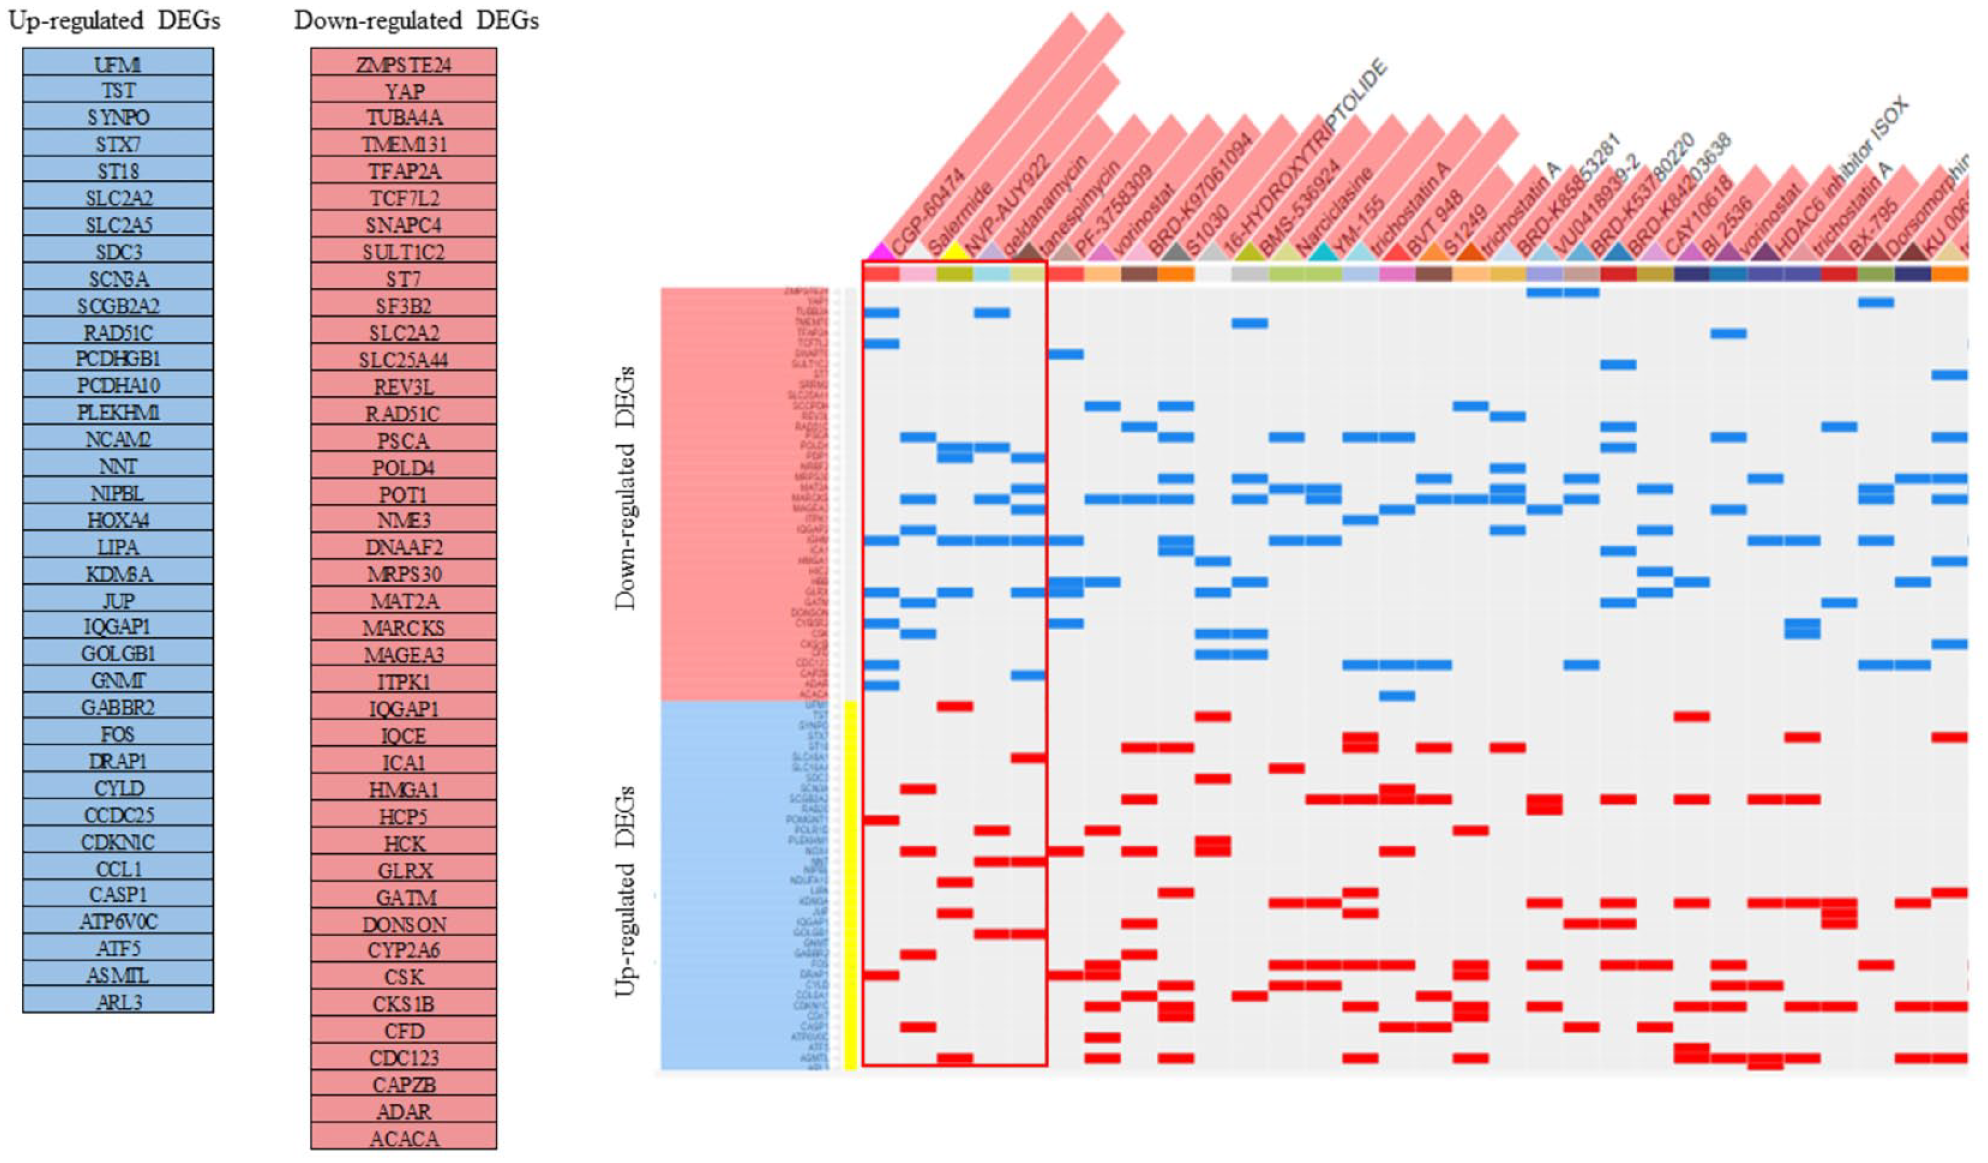
The clustergram of small molecules (columns) and DEGs (rows). Blue colors reflect the suppression of expression and red colors correspond with the up-regulation of expression. The top 5 leading compounds were selected for molecular docking simulation.
Docking simulation analysis
According to the LINCS L1000CDS 2 result, the 5 small molecules with a higher score were used for molecular docking analysis. Following our results, the FOS protein was found in the PPI and TF network analysis, and it was selected to be a target protein in docking simulation. Based on the SwissDock calculation, the ligand and target components were ranked by binding energy (ΔG). The binding energies of tanespimycin (−8.562351 kcal/mol), luminespib (−8.383352 kcal/mol), geldanamycin (−8.062184 kcal/mol), salermide (−8.18843 kcal/mol), and CGP-60474 (−7.851564) with FOS protein were greater than −5 kcal/mol resulting in it having good binding pocket on protein surface. In addition, the 5 compounds with lower binding energy were selected for visualization. The visualization of the most favorable binding models of the key targets is shown in Figure 8.
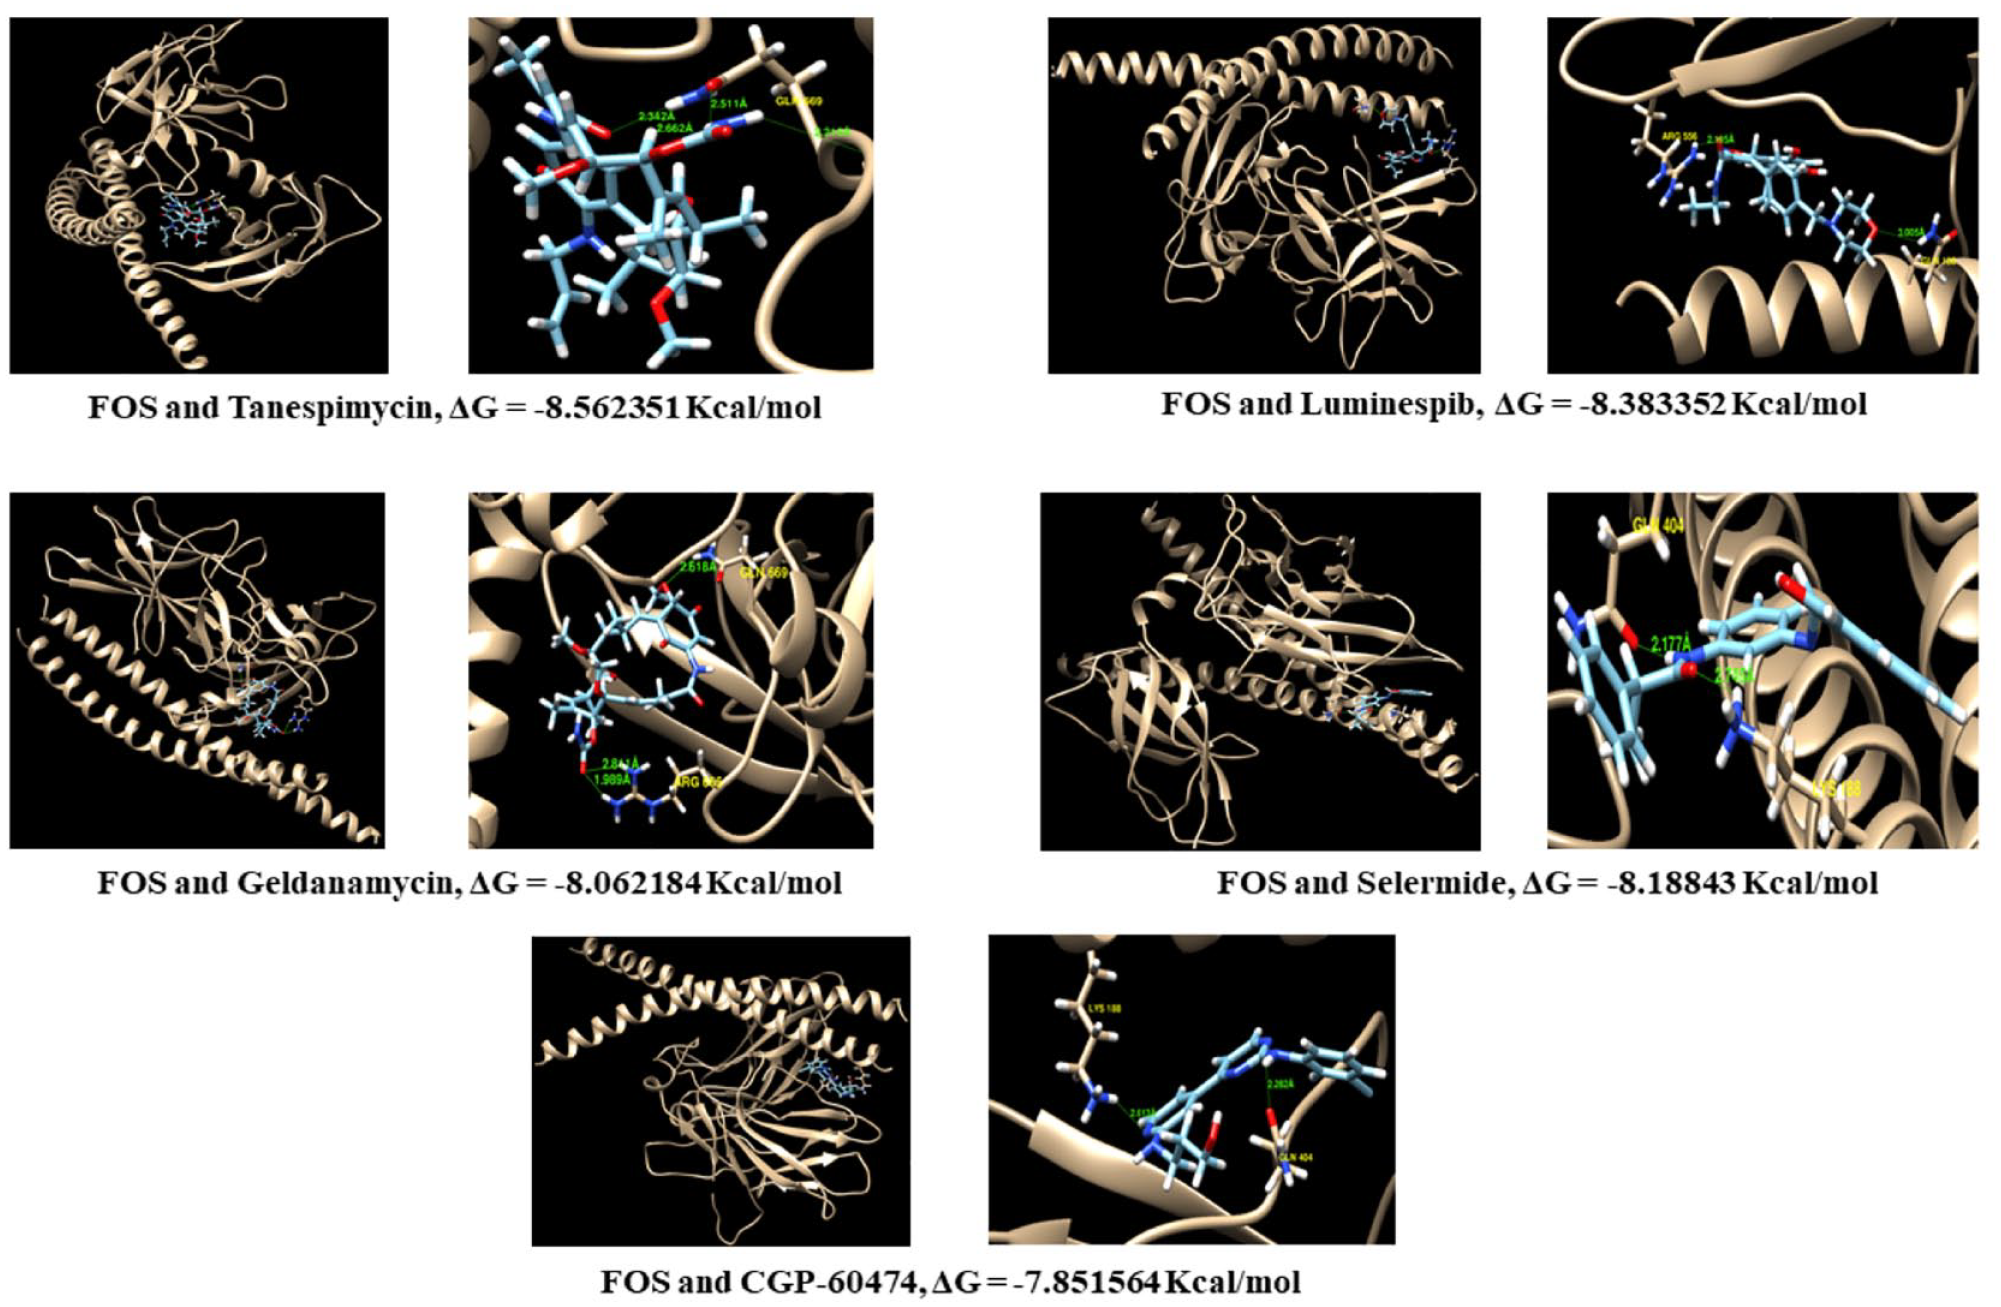
The results of leading compounds with FOS targets protein and binding energy (ΔG) using molecular docking simulation.
Discussion
Treatment of AM is one of the major issues nowadays. It may become malignant or spread to other locations in addition to having a high recurrence rate.17,18 This study performed integrated bioinformatics analysis to disclose potential biological alteration, molecular mechanisms, therapeutic target, and drug-triggering AM.
Proteoglycans (PGs), a structural component of both ECM and cell membranes, are complex glycoconjugates composed of a protein core with covalently attached glycosaminoglycans (GAGs). 19 Proteoglycan function in cell-cell and cellular matrix adhesion, cell differentiation, and proliferation depend on the attached GAG. 20 Chondroitin sulfate, heparan sulfate (HS), and keratan sulfate (KS) are major types of GAG. Various investigations of PG/GAG in the oral cavity reported either expression or potential involvement of these factors in the progression of oral squamous cell carcinoma and salivary tumors. 21 As for odontogenic tumors, CS PG is widely observed but variably expressed in epithelial nests and stroma of both AM and keratocystic odontogenic tumor, and the keratocystic odontogenic tumors have been renamed odontogenic keratocyst in the 2017 World Health Organization (WHO) classification of head and neck tumors. 22 In our present study, the alterations of PG, heparin sulfate, and glycosaminoglycan were enriched in both GO and KEGG pathway analyses and may be associated with the molecular pathogenesis of AM. Several gene mutations were investigated in AM patients and previous reports showed mutation of SMO and BRAF genes have a potential role in promoting the proliferation and invasion of the AM. 23 Mutations in SMO (encoding Smoothened, SMO) are common in AM of the maxilla, whereas BRAF mutations are predominant in tumors of the mandible. A previous study on SMO mutations in odontogenic keratocyst reported that the mutation sites were concentrated at exons 2, 3, 5, 6, and 10, indicating that may related to the occurrence of odontogenic tumors which play important roles in the development of odontogenic epithelium and the formation of odontogenic tumors. 24 Many studies have also focused on the relationship between the BRAF V600E mutation and clinicopathological features and recurrence in patients with AM. 25 Moreover, BRAF V600E immunoexpression is significantly associated with recurrence and plexiform pattern AM. 26 However, the alteration of expressions in SMO and BRAF were not presented in our analysis, and it is necessary to evaluate the gene mutation status in an additional cohort of AM patients in the future.
The TP53 protein is the product of the tumor suppressor gene TP53, and functions in G1 arrest to allow the repair of DNA damage and to prevent the cell from entering the S phase of the cell cycle, or to guide the damaged cell to apoptosis. 27 Previous study showed that unicystic AM (UA) associated with high TP53 and interleukin (IL)-1α expression predicts a better response to marsupialization than TP53-negative and IL-1α-negative UA. 28 According to our results, GO analysis presents the down-regulation of positive regulation of DNA damage response through TP53 signaling transduction. The activation of p53 can lead to various responses, eg, DNA damage might result in growth arrest to allow for repair of the damage or apoptosis, both of these responses aim to prevent damaged cells from proliferating and passing mutations onto the next generation and the lacking of functional p53 is unable to respond appropriately to stress, they can accumulate mutations that favor the development of cancer.
γ-Aminobutyric acid (GABA) is synthesized from glutamate and released to activate GABA receptors for rapid inhibitory synaptic transmission and tonic inhibition in neurons. 29 In this study, GO and KEGG analyses revealed the GABA receptors significantly decreased expression and down-regulation in AM. In non-neuronal cells, GABAergic synapse has an important role in tumor promotion and progression. 30 γ-Aminobutyric acid receptors have been divided using pharmacologic approaches into 3 types including A, B, and C and GABAA receptor has a crucial role and variety of functions in gastrointestinal cancers such as oral cancer, liver cancer, stomach cancer, pancreatic cancer, and small intestinal cancer. 31 A recent study also showed GABA has an important role to promote cell proliferation of oral squamous cell carcinoma cells (Tca8133) and suppress apoptosis through the GABAA receptors. 32 To date, there is no study examining the role and association between GABAA receptor expression and AM pathogenesis and recurrent; therefore, further study on the mechanism of GABAA receptor should be extended.
In this study, the modular analysis revealed a significant relationship between the ECM organization and collagen formation. Extracellular matrix provides support and nutrients to cell, promotes cell adhesion and migration, and serves a variety of growth factors that influence growth, proliferation, morphological alteration, and, differentiation. 33 In AM, ECM provides invasiveness and progression of the tumor by ECM degradation requiring proteolytic enzymes that occurs during the tumor developmental process, tissue repairing, and invasion. 34 The previous study suggests that in AM, the predominance of tightly packed mature collagen fibers with greater diameter gave promising results for the absence of hard tissue formation. 35 Thus, the collagen fibers play a pivotal role in modeling the biological behavior of various pathological lesions, as well as vanguard its bystander epithelium during normal odontogenesis. 36 The previous study showed AM tissue and stromal fibroblast behave closely interact through the regulation of inflammatory cytokines to create a microenvironment leading to the extension of AM. 37 The diversity of adhesion molecules has been studied and suggested to be a marker in AM such as E-cadherin, β-caterin, syndecan 1 (SDC-1), CD-56, CD-147, α-integrin, β-integrin, and claudins. The alteration of these genes was identified as a marker of tumor invasion and growth and has a fundamental role in odontogenic tumors. 38 Although several studies have attempted to descript the association between cell adhesion molecules and AM, but it is necessary to understand the important mechanism of these molecules and the tumor progression.
This study showed FOS up-regulation in both the TF-gene network and protein-protein network analysis. FOS protein is encoded by proto-oncogene and belongs to the AP-1 family of a TF that participates in the control of oncogenic transformation, cell proliferation, cell differentiation, and apoptosis. 39 FOS protein has an important role in bone development and acts as a key regulator in osteoclast macrophage lineage determination and bone remodeling. 40 Overexpression of FOS was also found in various types of neoplastic cells, but the role of FOS protein regulation in AM pathogenesis has not yet been known. The previous study demonstrated that overexpression of FOS and tumor necrotic factor receptor 1 in AM. 41 In addition, the up-regulated c-fos, c-jun, and human telomerase reverse transcriptase were observed using in situ hybridization. 42 Thus, an increased FOS expression may play a role in oncogenic transformation and may be involved in the regulation of telomerase activity in the proliferation, and it could be used as a therapeutic target in AM. In addition, this study also presented FOXF2, JUND, SOX10, REST, and TFAP2A that may regulate common mechanisms in AM. FOXF2 (Forkhead Box F2) is expressed in the mesenchyme near tooth germ during tooth development. 43 The deficiency of FOXF2, which repressed the transcription of TWIST1, induced the epithelial-mesenchymal transition (EMT) and promoted the lymphatic metastasis of basal-like breast cancer but the role of FOXF2 in AM has not been studied. 44 It has been reported that JunD proto-oncogene (JUND) is a crucial modulator in prostate cell cycle progression and promotes cancer development and overexpression of JUND increases cell proliferation and invasiveness of cancer cell lines. 45 However, the role of JUND in AM has not been well-known. SOX10 is a TN that plays an essential role in the development and maturation of glial cells. 46 Transcription factor AP-2 alpha (TFAP2A) is an FGF8-associated transcriptional mediator of developmental abnormalities that controls palatal elongation and elevation. 47 Mutations in the Tfap2a gene induce the up-regulated FGF8 expression, resulting in changing growth and morphogenesis of cleft palate. 48 Thus, it is reasonable to infer that loss of Tfap2 functions results in aberrant proliferation and apoptosis in palatal cells, probably through altering FGF8 expression. 49 In AM, the overexpression of SOX10 may be related to increased cell proliferation, local invasion, and high recurrence rates, and the study of SOX10 should be extended for a possible pharmacologic treatment for further research. 50
In this study, we used the L1000CDS 2 database for screening existing drugs or candidate compounds and used molecular docking simulation for validation of the greatest binding energy of 5 compounds that can perturb and reverse AM disease signature including Tanespimycin, Luminespib, Salermide, Geldanamycin, and CGP-60474, respectively. Tanespimycin showed the greatest binding affinity at −8.562351 kcal/mol to FOS protein and it is derived from Geldanamycin for reducing hepatotoxicity. Interestingly, Tanespimycin, Luminespib, and Geldanamycin are being studied in various cancer types such as leukemia, multiple myeloma, kidney cancer, and breast cancer. These drugs can bind to the 90 kDa heat shock protein (HSP90) to inhibit the formation of the HSP90 complex causing tumor formation. 51 CGP-60474 is a potent cyclin-dependent kinase (CDK) inhibitor that is well-known to be associated with regulating cell cycle transitions and other important cell functions. 52 In in vivo study, CGP-60474 alleviated tumor necrosis factor-α (TNF-α) and IL-6 in activated macrophages by down-regulating the activity of nuclear factor kappa B (NF-κB) in mice and it could be developed for treatment in neoplastic tumors. 53
The current treatment of AM usually includes surgery to remove the tumor and other modalities of choice are chemotherapy and radiotherapy, but it depends on the selective situation. 54 The goal of surgical treatment of AM is to reduce recurrences, restoring fountain and aesthetics. Radiation therapy has been used successfully for the non-surgical treatment of AM especially in patients with medically unstable surgery. It has been combined with surgery and chemotherapy. 55 The efficacy of chemotherapy in both primary and recurrent AM is still being investigated as chemotherapy can improve clinical outcomes in non-surgical patients. Several drugs may be used in combination with surgical resection and radiotherapy including vinblastine + cisplatin + bleomycin and adriamycin + carboplatin. 56 However, there is still needed more clinical studies and validation of the use of radiation and chemotherapy as treatment options and the potential benefits should be balanced with their side effects to justify their use in AM therapy.
Conclusions
Taken together, our transcriptome bioinformatic analysis identified the potential gene and protein (FOS), significant biological alteration, pathway signaling, and candidate compounds between normal and AM tissue. The results suggested that the alteration of glycosaminoglycan and GABAA signaling and extracellular matrix organization play a key role in the pathogenesis and progression of AM. In addition, FOS protein may be used as a therapeutic target in the treatment of the disease. These results suggest the involvement of promising molecular mechanisms for a better understanding of these odontogenic tumors and need further verification in a clinical study.
Supplemental Material
sj-csv-1-bbi-10.1177_11779322241256459 – Supplemental material for Identification of Molecular Mechanisms of Ameloblastoma and Drug Repositioning by Integration of Bioinformatics Analysis and Molecular Docking Simulation
Supplemental material, sj-csv-1-bbi-10.1177_11779322241256459 for Identification of Molecular Mechanisms of Ameloblastoma and Drug Repositioning by Integration of Bioinformatics Analysis and Molecular Docking Simulation by Suthipong Chujan, Nutsira Vajeethaveesin, Jutamaad Satayavivad and Nakarin Kitkumthorn in Bioinformatics and Biology Insights
Footnotes
Acknowledgements
This study was supported by Chulabhorn Research Institute (CRI) and Mahidol University. The authors are thankful to Dr James M. Dubbs, PhD, senior research scientist of Chulabhorn Research Institute for proofreading the manuscript.
Author Contributions
SC, NK and JS conceived and designed the study; SC, NV and NK performed experiments, collected data, analyzed and interrelated results; SC, NK and JS supervised, directed and managed the study; SC, NV, NK and JS final approved of the version to be published.
Funding:
The author(s) disclosed receipt of the following financial support for the research, authorship, and/or publication of this article: This work was supported by Thailand Science Research and Innovation (TSRI), Chulabhorn Research Institute (CRI) (Grant No. 48292/4691970).
Declaration of conflicting interests:
The author(s) declared no potential conflicts of interest with respect to the research, authorship, and/or publication of this article.
Supplemental Material
Supplemental material for this article is available online.
References
Supplementary Material
Please find the following supplemental material available below.
For Open Access articles published under a Creative Commons License, all supplemental material carries the same license as the article it is associated with.
For non-Open Access articles published, all supplemental material carries a non-exclusive license, and permission requests for re-use of supplemental material or any part of supplemental material shall be sent directly to the copyright owner as specified in the copyright notice associated with the article.