
Abstract
Hepatic encephalopathy (HE) is a set of complex neurological complications that arise from advanced liver disease. The precise molecular and cellular mechanism of HE is not fully understood. Differentially expressed genes (DEGs) from microarray technologies are powerful approaches to obtain new insight into the pathophysiology of HE. We analyzed microarray data sets of cirrhotic patients with HE from Gene Expression Omnibus to identify DEGs in postmortem cerebral tissues. Consequently, we uploaded significant DEGs into the STRING to specify protein-protein interactions. Cytoscape was used to reconstruct the genetic network and identify hub genes. Target genes were uploaded to different databases to perform comprehensive enrichment analysis and repurpose new therapeutic options for HE. A total of 457 DEGs were identified in 2 data sets totally from 12 cirrhotic patients with HE compared with 12 healthy subjects. We found that 274 genes were upregulated and 183 genes were downregulated. Network analyses on significant DEGs indicated 12 hub genes associated with HE. Enrichment analysis identified fatty acid beta-oxidation, cerebral organic acidurias, and regulation of actin cytoskeleton as main involved pathways associated with upregulated genes; serotonin receptor 2 and ELK-SRF/GATA4 signaling, GPCRs, class A rhodopsin-like, and p38 MAPK signaling pathway were related to downregulated genes. Finally, we predicted 39 probable effective drugs/agents for HE. This study not only confirms main important involved mechanisms of HE but also reveals some yet unknown activated molecular and cellular pathways in human HE. In addition, new targets were identified that could be of value in the future study of HE.
Keywords
Introduction
Hepatic encephalopathy (HE) develops in more than 60% of cirrhotic patients and is associated with a poor prognosis. 1 Hepatic encephalopathy following liver failure is a neuropsychiatric syndrome ranging from mild confusion, irritability, lethargy, disorientation, and sleep disturbances in the mildest forms to severe confusion, deep coma, positive Babinski sign, seizures, and cerebral edema. 2 Hepatic encephalopathy is the main cause of readmission to the hospital, has negative effects on quality of life, increases health care costs, and is directly related to a high mortality rate with a survival rate of 36% at 1 year. 3 Patients with a previous history of HE have a 40% risk of recurring HE during 1 year. 4 Neuroinflammation, blood-brain barrier (BBB) permeabilization, astrocyte swelling, intracranial hypertension, and cerebral herniation are main pathological cerebral findings in more fulminant cases.5,6 The precise cellular and molecular mechanism of HE is, however still poorly understood. The current view is that cerebral accumulation of ammonia, glutamine, and gut-derived neurotoxic agents such as mercaptans, cytokines, lipopolysaccharide, and benzodiazepine-like substances activate microglia cells and trigger some important inflammatory downstream signaling, induce astrocyte dysfunction, disturb brain homeostasis, neurodegeneration, and consequently onset of HE. 7 Pharmacological prescription for treatment of HE is often effective, but liver transplantation is the only curative therapeutic procedure for HE in patients with end-stage liver disease. 8 We here performed an integrative bioinformatic study on transcriptomic data from cerebral tissues in cirrhotic patients with HE to identify all the mechanisms of liver coma through multiplatform-enriched biological signatures, brain region explorations, and posttranscriptional targeting.
Methods
Identification of data sets
Differentially expressed genes (DEGs) in the gene expression profiling of postmortem brain samples in cirrhotic patients with HE were identified from the public Gene Expression Omnibus (GEO) database (https://www.ncbi.nlm.nih.gov/geo/) and then analyzed with GEO2R Web tool as method described previously. The GEO is a public repository database for high-throughput gene expression measurements (ie, microarray-based studies, RNA methylation profiling, genomic DNA and genome-protein interactions) supported by the National Center for Biotechnology Information.9,10 Two data sets, namely, GSE41919 and GSE57193, were selected and analyzed for specified DEGs. In the last update of GEO, these data sets were only 2 accessible data sets that represented gene expression profiling of brain tissues in postmortem autopsy samples from patients with HE that protected GEO2R analysis. The GSE41919 data set was obtained from the cerebral cortex of 8 cirrhosis patients with HE and 8 healthy controls (https://www.ncbi.nlm.nih.gov/geo/query/acc.cgi?acc=GSE41919). The GSE57193 data set was prepared from the fusiform gyrus of 4 cirrhosis patients with HE and 4 healthy controls (https://www.ncbi.nlm.nih.gov/geo/query/acc.cgi?acc=GSE57193). We used the GEO2R Web tool to compare gene expression in cirrhotic data sets with healthy control to characterize DEGs (P < .05). When log fold change (log FC) was more than 0 (positive value), genes were upregulated, and when log fold change was less than 0 (negative value), genes were downregulated. 11
Construction of protein-protein interaction and network analysis of transcriptomic data
The STRING database (https://string-db.org/) was used to prepare protein-protein interaction networks for DEGs. All DEGs were uploaded into the STRING and proceeded after the selection of homo sapiens organisms for the construction of the genetic network. The STRING is a biological and an aniline Web tool platform that contains data from many organisms and computational algorithms to predict interactions between proteins or genes and is organized by Swiss Institute of Bioinformatics (SIB), Novo Nordisk Foundation Center Protein Research (CPR), and European Molecular Biology Laboratory (EMBL). 12 Afterward, a TSV file was downloaded and uploaded into Cytoscape version 3.7.0 to visualize the genetic network and analyzed main network parameters such as degree and betweenness centrality.13-15 Top genes with more degree and greater betweenness centrality were considered as hub genes. 16
Gene ontology, pathway, mammalian phenotype, cell type, and enrichment analysis of DEGs
To investigate functional annotations in relation to obtained genes, biological processes enrichment analysis was conducted using ToppGene database (https://toppgene.cchmc.org/) for significant upregulated and downregulated genes separately. ToppGene-ToppFun is a computational online free-access tool for functional enrichment analysis of the candidate genes that included 16,930 and 322 annotations for biological processes and miRNA TargetScan, respectively, in the last update. 17 To get mechanistic insight into DEGs with P < .05 from GEO, pathway enrichment analysis was performed using Enrichr database (https://maayanlab.cloud/Enrichr/).18,19 Enrichr is a Web-based platform for analyzing candidate gene sets to predict common annotated biological features (ie, pathways, cellular type, phenotypes and transcription factors (TFs)). 20 For this purpose, 2 significant gene sets from DEGs (upregulated and downregulated) were separately submitted in Enrichr and proceeded through WikiPathway Web tool. Furthermore, to identify and compare the phenotype properties of each gene set, phenotype ontology was performed using Enrichr (Human Phenotype Ontology tool). Cellular component enrichment analysis was also conducted using Enrichr (Go cellular component tool) to reveal the main involved cellular components associated with upregulated and downregulated cerebral genes in HE. Also, PanglaoDB Augmented Web tool in Enrichr was used to predict some specific cell types that may involve in cerebral damages following HE. The basic species for all enrichment were selected homo sapiens, and findings with P < .05 were considered statistically significant.
Time-series-specific tissue expression analysis
To identify time-series expression profiles across brain regions, we uploaded our target genes in a cell-type-specific expression analysis (CSEA) Web tool (http://genetics.wustl.edu/jdlab/csea-tool-2/). The CSEA is a Web-based platform to conduct brain-region-specific enrichment analysis for candidate genes that supports data from both mouse and human RNA-seq or/and microarray studies. 21 All significant upregulated and downregulated genes of DEGs were submitted in CSEA separately. Significant brain regions in different periods for input genes were described according to P value specificity index (pSI) and false discovery rate (FDR)-adjusted P value less than .05. Regions with lower pSI along with P value < .05 were considered more important enriched.
Transcription factors, microRNAs prediction and drug repurposing
Transcription factor prediction analysis was performed using Enrichr through TRANSFAC and JASPAR PWMs Web tool to identify possible overlap between upregulated and downregulated genes of DEGs and previously annotated TFs. To conduct microRNA (miRNA) target prediction annotations, we submitted target genes in the ToppGene database through the Target scan platform. Annotations that were predicted by more target genes and presented lower P value were considered as main enrichments in all enrichment and target prediction analysis. Furthermore, a target-based drug discovery paradigm using ToppGene was performed to repurpose the main effective drugs or agents for cirrhosis-induced HE. To this goal, we uploaded our target genes in ToppGene-ToppFun and proceeded with drug discovery through Broad Institute Connectivity Map (CMAP), CTD, and Stitch in ToppGene (Figure 1). Statistical significance (P < .05) was considered by a likelihood-ratio test with correction for FDR method to show comparison.

Schematic overview of conducted bioinformatics approach. Two data sets from postmortem brain samples of cirrhotic patients with HE were extracted from Gene Expression Omnibus. Differentially expressed genes were identified from both data sets using GEO2R Web tool. Different databases were also used to reveal new insight into molecular, cellular, and biological mechanisms as well as predict main probable therapeutic options in relation to HE. HE indicates hepatic encephalopathy.
Results
Identification of DEGs
We analyzed DEGs in 2 data sets using the GEO2R Web tool. Each expression profile consisted of 2 distinct gene sets of postmortem brain tissues from cirrhotic with HE and healthy control samples. The GSE41919 and GSE57193 data sets consisted of 4 and 453 significant DEGs, respectively. Among these, 3 and 271 known genes were significantly upregulated, while 1 and 182 known genes were significantly downregulated in GSE41919 and GSE57193, respectively (Figure 2 and Supplementary Table S1.). All consequent enrichment analysis and target predictions were conducted on total significant upregulated and downregulated from DEGs as our target genes, separately or totally according to enrichment goals.

Volcano plots of significant differentially expressed genes in cerebral tissues from cirrhosis-induced HE patients. Two transcriptomic data sets were extracted from public Gene Expression Omnibus and then analyzed using GEO2R Web tool to identify regulation patterns of significant genes. When log2fold change was positive, genes were up-regulated (red nodes), and when it was negative, genes were downregulated (blue nodes). HE indicates hepatic encephalopathy.
Construction of genetic network and analysis of network parameters
To construct genetic networks and identify hub genes from our target genes, we used STRING and Cytoscape. Overall, there were 457 upregulated and downregulated genes in the Cytoscape. Among them, 58 genes (nodes) had no interactions. Network analysis using Cytoscape revealed that 10 hub genes such as epidermal growth factor receptor (EGFR), brain-derived neurotrophic factor (BDNF), Erb-b2 receptor tyrosine kinase 2 (ERBB2), glial fibrillary acidic protein (GFAP), aquaporin 4 (AQP4), solute carrier family 1 member 2 (SLC1A2), neurotrophic receptor tyrosine kinase 2 (NTRK2), neurotensin receptor 2 (NTSR2), Ras homolog family member C (RHOC), rhodopsin (RHO), paired box 6 (PAX6), and paxillin (PXN) had the biggest degrees and greatest betweenness centrality (Figure 3 and Table 1). EGFR (red circle node) related to 60 other genes in the current network and represented a bigger degree (D = 60) and greater betweenness centrality (B = 0.22248615). The main simple parameters of genetic networks included clustering coefficient (Ci) = 0.181, network diameter (D) = 10, network centralization (C) = 0.135, network density = 1.6%, and network heterogeneity (H) = 1.026 (Figure 3).

Genetic network of targeted significant DEGs from the brain of cirrhosis-induced HE patients. The network consists of 399 interacted nodes. In the current network, 12 genes such as EGFR, BDNF, ERBB2, GFAP, AQP4, SLC1A2, NTRK2, NTSR2, RHOC, RHO, PAX6, and PXN were more centralized and considered as hub genes. Each node is illustrated according to its network parameters. The size and color of nodes are adjusted with their degrees and betweenness centrality, respectively. Large nodes represent a bigger degree, and red and dark orange nodes indicate greater betweenness centrality. DEGs indicate differentially expressed genes; HE, hepatic encephalopathy.
Specific cerebral hub genes associated with cirrhosis-induced HE based on network analysis using Cytoscape.

Biological insights of target genes
Biological process enrichment analysis showed that circulatory system development, organic acid catabolic process, lipid metabolic process, carboxylic acid catabolic process, lipid modification, lipid oxidation, anatomical structure formation involved in morphogenesis, cell adhesion, glial cell differentiation, and regulation of actin cytoskeleton organization were significantly enriched for upregulated genes (Figure 4A), whereas neuron projection development, cellular component morphogenesis, neuron projection morphogenesis, plasma membrane–bounded cell projection morphogenesis, cell projection morphogenesis, cell part morphogenesis, and neuron development were enriched for downregulated genes (Figure 4B). Pathway analysis revealed that fatty acid beta-oxidation WP143, mitochondrial LC-Fatty acid beta-oxidation WP368, cerebral organic acidurias WP4519, and regulation of actin cytoskeleton WP51 were significantly annotated for upregulated genes (Figure 4C), whereas serotonin receptor 2 and ETS-like protein (ELK)–serum response factor (SRF)/GATA Binding Protein 4 (GATA4) signaling WP732, vitamin A, carotenoid metabolism WP716, G protein–coupled receptors (GPCRs), class A rhodopsin–like WP455, and p38 mitogen-activated protein kinase (MAPK) signaling pathway WP400 were significantly enriched for downregulated genes (Figure 4D).

Biological process and pathway enrichment analysis for significant DEGs. Significant biological processes were enriched for upregulated (A) and downregulated (B) target genes. Main involved pathways annotated for upregulated (C) and downregulated (D) target genes. All results are adjusted based on P value and presented as –log (P value) on the horizontal axis. DEGs indicate differentially expressed genes.
Gene-phenotype prediction analysis provided abnormality of dicarboxylic acid metabolism (HP:0010995), dicarboxylic aciduria (HP:0003215), hyperammonemia (HP:0001987), myoglobinuria (HP:0002913), and bradycardia (HP:0001662) as significant enriched human phenotypes in relation to upregulated genes (Figure 5A), whereas some phenotypes such as inability to walk (HP:0002540), progressive inability to walk (HP:0002505), akinesia (HP:0002304), fatigable weakness (HP:0003473), and abnormality of the neuromuscular junction (HP:0003398) were significantly annotated for downregulated genes (Figure 5B). Furthermore, cell-type-specific enrichment analysis showed that astrocytes, Bergmann glia, oligodendrocytes, Schwann cells, and satellite glial cells were the most important affected cells in relation to upregulated genes (Figure 5C), whereas photoreceptor cells, pyramidal cells, retinal ganglion cells, and neuroblasts were the most significantly involved cell types in relation to downregulated genes (Figure 5D). Also, cellular component enrichment revealed that lipid droplet (GO:0005811), focal adhesion (GO:0005925), cell-substrate junction (GO:0030055), astrocyte projection (GO:0097449), and sodium: potassium-exchanging ATPase complex (GO:0005890) were the main disrupted cellular elements that were enriched by upregulated gene (Figure 5E), whereas neuron projection (GO:0043005), sarcoplasmic reticulum membrane (GO:0033017), secretory vesicle (GO:0099503), voltage-gated potassium channel complex (GO:0008076), and ciliary membrane (GO:0060170) were the most affected cellular components that were annotated for downregulated genes (Figure 5F).
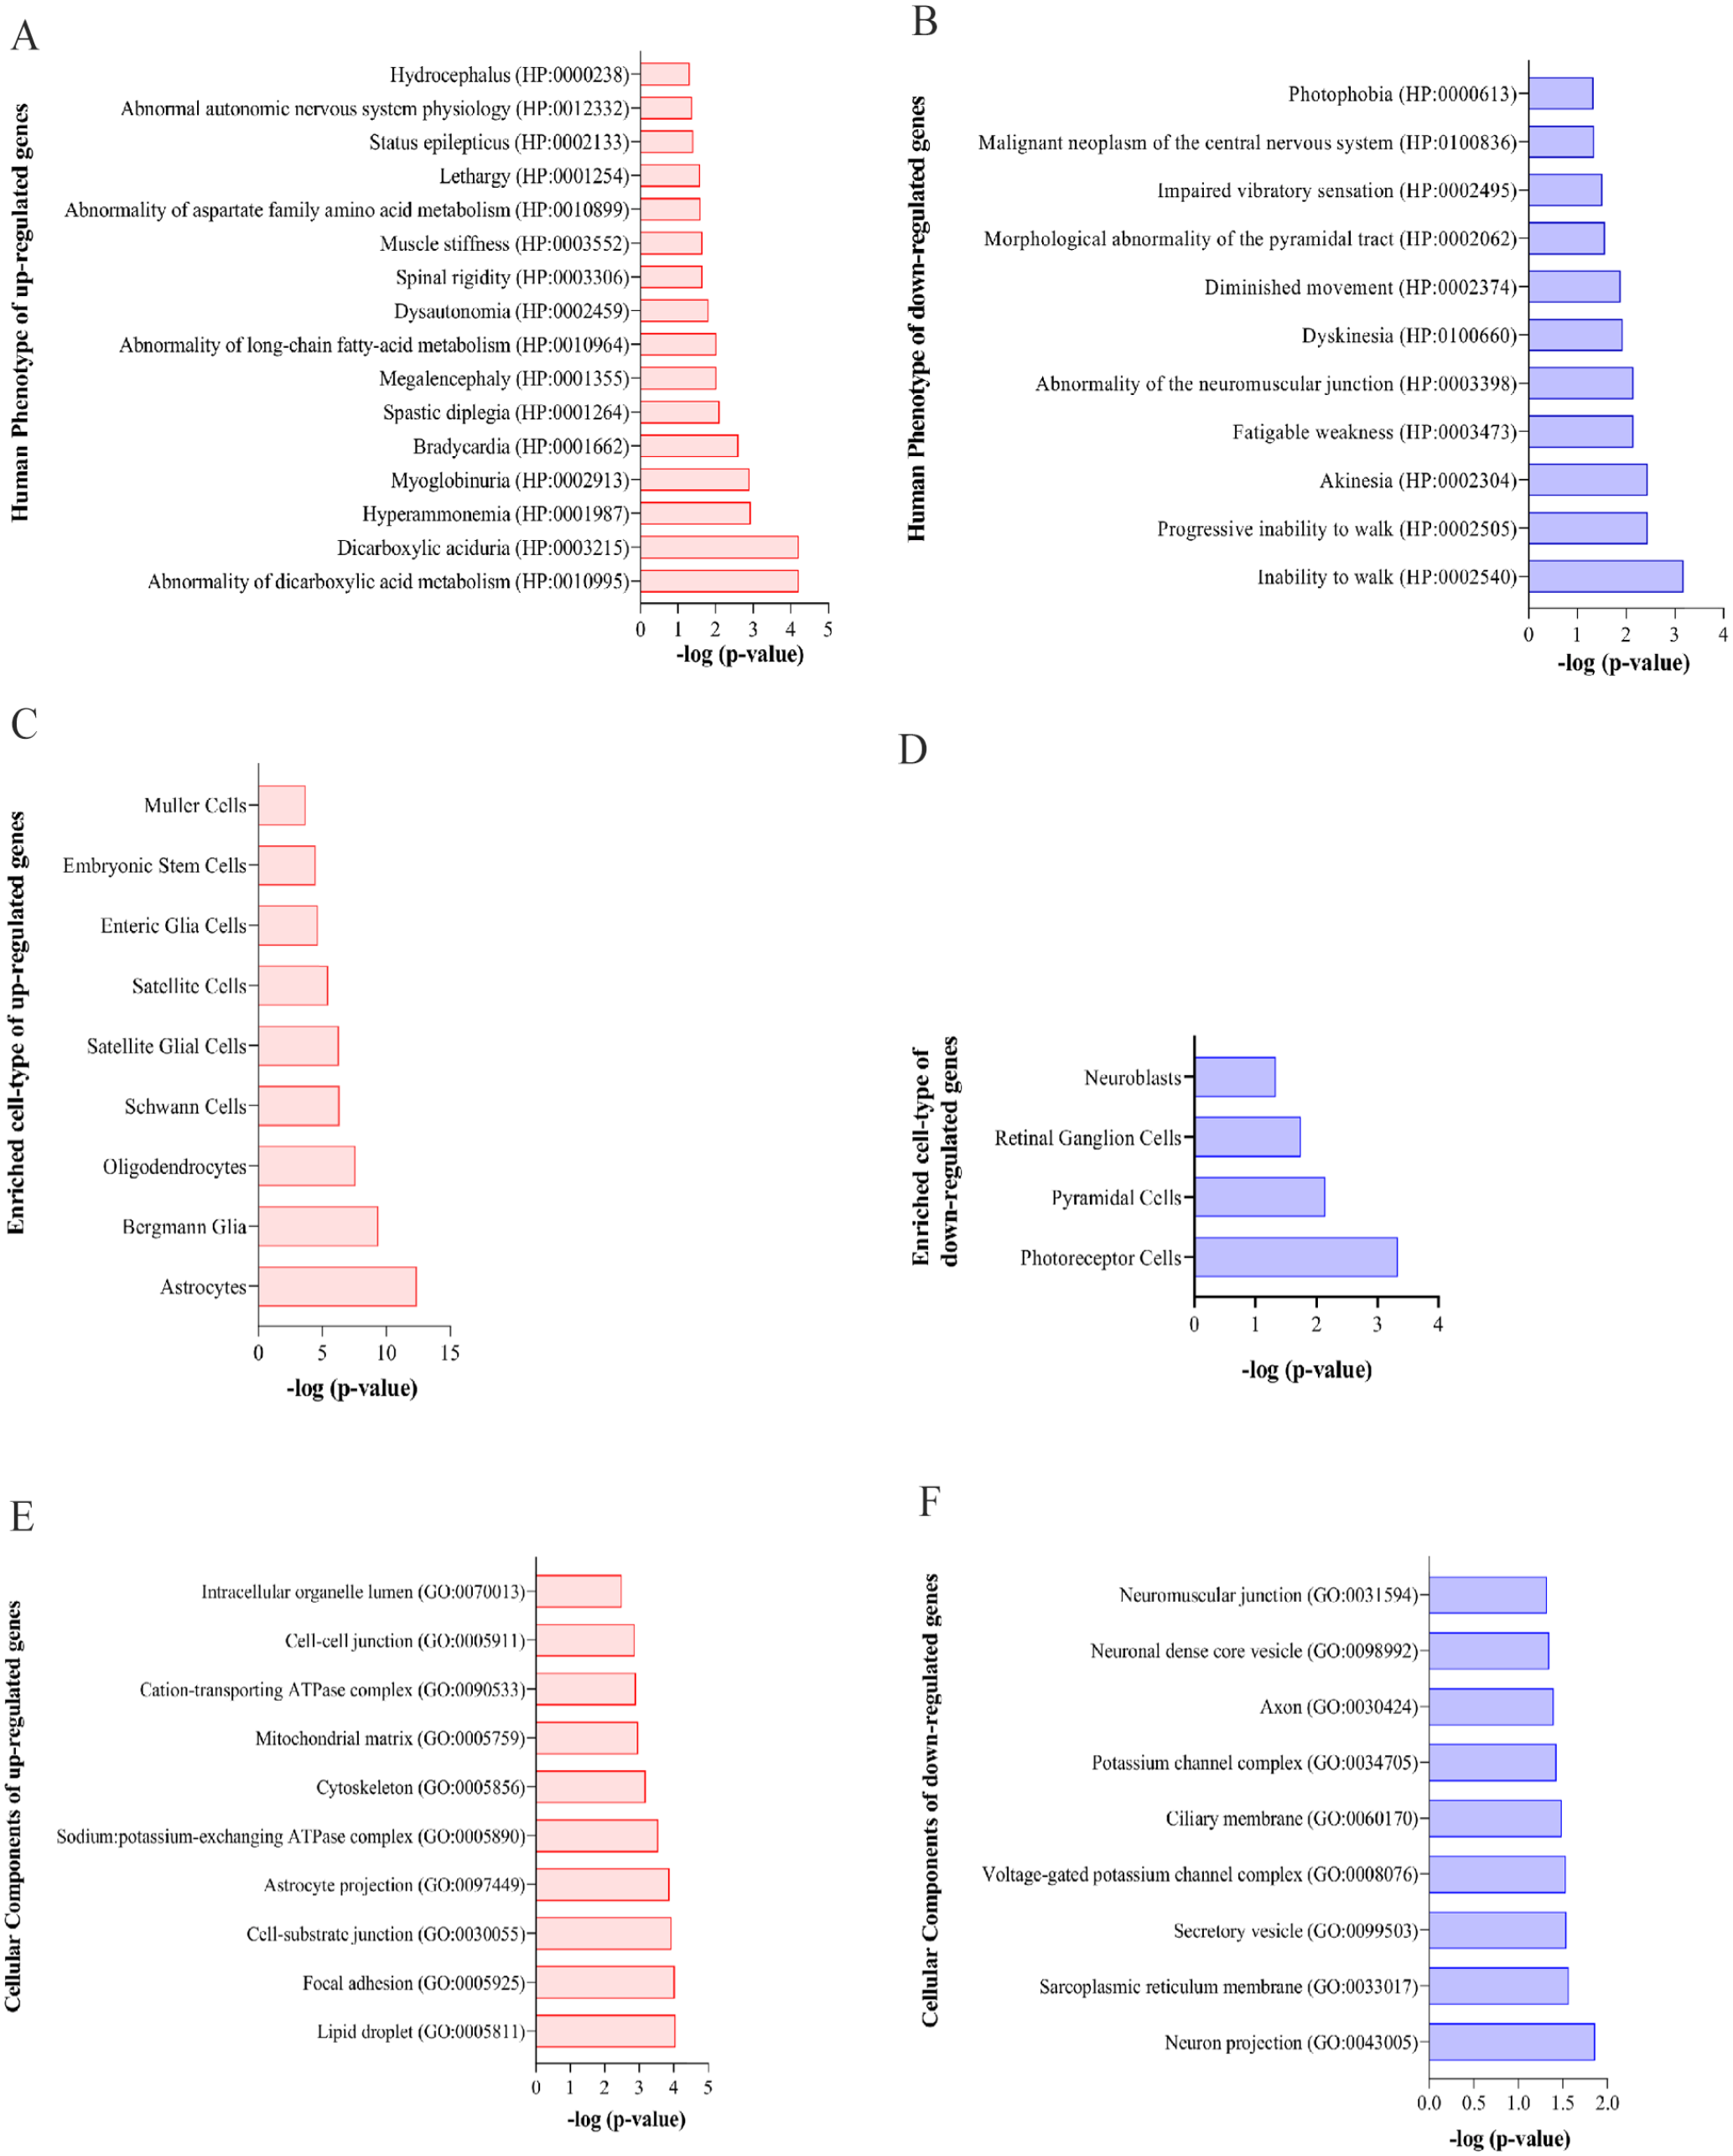
Human profiling, cell type, and cellular component enrichment analysis for significant DEGs. Human phenotype enrichment annotated for cerebral upregulated (A) and downregulated (B) HE genes. Result of cell type prediction for upregulated (C) and downregulated (D) HE genes using Enrichr database. Enriched cellular components for cerebral upregulated (E) and downregulated (F) HE genes. All results are adjusted based on P value and presented as –log (P value) on the horizontal axis. DEGs indicate differentially expressed genes; HE, hepatic encephalopathy.
Time-series-specific tissue expression analysis
Due to the dynamic nature of gene expression at different stages of life, we conducted a time-specific tissue expression analysis for total upregulated and downregulated genes. We displayed that our target genes significantly enriched some functional brain regions such as thalamus, striatum, cortex, amygdale, and hippocampus (Figure 6A). Time-specific expression analysis revealed that target genes were strongly expressed in the thalamus at different periods of life, including neonatal early infancy, late infancy, early childhood, mid-late childhood, adolescence, and young adulthood (Figure 6B).

Tissue expression analysis for brain significant DEGs. (A) Brain region expression analysis of both upregulated and downregulated cerebral genes associated with HE. (B) Time-series-specific tissue expression analysis for demonstrating expression patterns of target genes using CSEA Web tool. The size of nodes indicated pSI thresholds (values decrease from outside (0.05) to inside (0.0001)) and color-adjusted based on P value so that darker ones represent more significant brain regions during different periods. DEGs indicate differentially expressed genes; HE, hepatic encephalopathy.
Drug repurposing
Gene-drug interaction prediction was conducted to repurpose some effective drugs or small molecules for target genes using ToppGene through CTD, Stitch, and Broad Institute Connectivity Map tools. Thirty-nine drugs or agents such as flufenamic acid (P = 2.70E-09; predicted by 20 input genes; gene count (GC = 20)), troglitazone (P = 4.56E-09; GC = 59), zoledronic acid (P = 3.00E-08; GC = 61), raloxifene hydrochloride (P = 6.50E-08; GC = 42), buspirone (P = 3.06E-07; GC = 33), acetylcysteine (P = 3.29E-07; GC = 38), calphostin C (P = 5.30E-07; GC = 26), ketamine (P = 6.13E-07; GC = 38), gamma-aminobutyric acid (P = 9.75E-07; GC = 27), vanadates (P = 2.42E-06; GC = 51), rosiglitazone (P = 2.99E-06; GC = 58), retinoic acid (P = 3.43E-06; GC = 14), trichostatin A (P = 4.59E-06; GC = 14), vancomycin (P = 4.84E-06; GC = 39), haloperidol (P = 5.02E-06; GC = 21), cocaine (P = 6.82E-06; GC = 50), MK-801 (P = 7.53E-06; GC = 19), leflunomide (P = 8.70E-06; GC = 36), cytarabine (P = 9.22E-06; GC = 29), clozapine (P = 1.15E-05; GC = 22), doxorubicin (P = 1.28E-05; GC = 61), thapsigargin (P = 1.47E-05; GC = 50), demecolcine (P = 3.11E-05; GC = 36), amiodarone (P = 3.23E-05; GC = 52), fluorouracil (P = 3.77E-05; GC = 49), and pantogab (P = 6.96E-05; GC = 27) were predicted and identified for upregulated and downregulated gene expression of cirrhosis patients with HE (Figure 7A). Among predicted results, 6 agents (ie, flufenamic acid, troglitazone, zoledronic acid, raloxifene hydrochloride, buspirone and acetylcysteine) had the lowest P value and were classified as more significant agents (green nodes in Figure 7B). Furthermore, 7 agents (ie, zoledronic acid, doxorubicin, troglitazone, rosiglitazone, amiodarone, vanadates, and cocaine) were predicted by a greater number of input genes (larger nodes in Figure 7B).

Drug/agent target prediction for main DEGs of cirrhosis-induced HE. (A) Thirty-nine significant drugs/agents were predicted for both cerebral upregulated and downregulated genes from DEGs in cirrhosis-induced HE using ToppGene database. All annotations are adjusted based on P value and presented as –log (P value) in the colorful pie chart. The most significant agents are listed in the upper position of the right panel. (B) Drug-genetic network for DEGs associated with cirrhosis-induced HE. The network indicates the number of associated genes that predict each drug/agent. Green nodes have the lowest P value and greater nodes are more connected nodes (greater degree). DEGs indicate differentially expressed genes; HE, hepatic encephalopathy.
Transcription factor prediction and targeted miRNAs
Since gene expression is strongly regulated by post-transcriptional processes and TFs, we conducted TFs and microRNAs (miRNAs) target prediction analysis for both upregulated and downregulated genes separately through Enrichr and ToppGene databases, respectively. We predicted 7 significant TFs such as SMAD family member 4, mothers against decapentaplegic homolog 4 (SMAD4); nuclear receptor subfamily 5 group A member 2 (NR5A2); nuclear factor I A (NFIA); upstream binding transcription factor (UBTF); hepatocyte nuclear factor 1-alpha (HNF1A); MAX interactor 1, dimerization protein (MXI1); and MAPK14 and 10 important miRNAs such as hsa-miR-325-3p, hsa-miR-124-3p.1, hsa-miR-495-3p, hsa-miR-24-3p, hsa-miR-133a-3p.1, hsa-miR-506-3p, hsa-miR-124-3p.2, hsa-miR-497-5p, hsa-miR-16-5p, and hsa-miR-15a-5p for genes that were upregulated in brain tissue of HE patients. We also predicted 7 significant TFs such as transcription factor 4 (TCF4), TEA domain transcription factor 2 (TEAD2), HNF1A, myocyte enhancer factor 2A (MEF2A), jun proto-oncogene, AP-1 transcription factor subunit (JUN), nuclear factor I C (NFIC) and SRF and 10 important miRNAs such as hsa-miR-27b-3p, hsa-miR-27a-3p, hsa-miR-23a-3p, hsa-miR-23b-3p, hsa-miR-23c hsa-miR-124-3p.1, hsa-miR-30e-5p, hsa-miR-30a-5p, hsa-miR-30d-5p, and hsa-miR-30b-5p for down-regulated genes (Table 2).
Predicted transcription factors and miRNAs for genes associated with cirrhosis-induced HE.

HNF1A, hepatocyte nuclear factor 1-alpha; JUN, AP-1 transcription factor subunit; MAPK14, p38 mitogen-activated protein kinase; MEF2A, myocyte enhancer factor 2A; MXI1, MAX interactor 1, dimerization protein; NFIA, nuclear factor I A; NFIC, nuclear factor I C; NR5A2, nuclear receptor subfamily 5 group a member 2; SMAD4, SMAD family member 4, mothers against decapentaplegic homolog 4; SRF, serum response factor; TCF4, transcription factor 4; TEAD2, TEA domain transcription factor 2; UBTF, upstream binding transcription factor.
Discussion
Hepatic encephalopathy is a serious and common complication in patients with end-stage liver disease. The molecular and cellular mechanisms of HE are not fully settled. 22 Microarray technology reveals DEGs and provides abnormalities of gene expression patterns in the whole genome. Therefore, these expression abnormalities can be useful for disclosing the mechanisms of diseases. Here, we combined 2 transcriptomic data sets from cerebral tissues of cirrhotic patients with HE and analyzed them to not only examine DEGs but also open new windows to disclose the pathophysiology of HE and possible new therapeutic options through an integrative bioinformatics approach.
In this study, 274 genes were upregulated and 183 genes were downregulated from both GSE41919 and GSE57193 data sets. Protein-protein interaction network analysis identified 12 hub genes such as EGFR, BDNF, ERBB2, GFAP, AQP4, SLC1A2, NTRK2, NTSR2, RHOC, RHO, PAX6, and PXN as centralized and significant genes in the genetic network (Table 1).
The EGFR (epidermal growth factor receptor) is a transmembrane protein and a member of the ErbB family receptors. Activation of receptors by EGF through downstream signaling molecules and cascades such as MAPK and Akt induces DNA synthesis, cell proliferation, and migration. 23 These receptors mediated liver fibrogenesis and hepatocarcinogenesis processes in animal models of cirrhosis and HE.24-26 These receptors also played an important role in the progress of nonalcoholic fatty liver disease as a risk factor for the development of cirrhosis. 27 Polymorphism in EGFR was also associated with risk of hepatocellular carcinoma in cirrhotic subjects 28 and also circulatory levels of these proteins were correlated with the severity of disease in hepatocellular carcinoma patients. 29 Activation of EGFR in ammonia-exposed astrocytes as in vitro model of HE mediates ammonia-induced astrocyte swelling. 30 Furthermore, in azoxymethane-induced HE mice, activation of EGFR through p38 MAPK/NFκB may involve in the disruption of the BBB and progression of cerebral edema. 31
The second hub gene BDNF is a neurotrophin growth factor that is involved in many vital developmental processes of central nervous system (CNS), especially synaptogenesis, neurogenesis, synapse stability, and neurotransmitter signaling. 32 Abnormal expression of BDNF in cirrhosis-induced HE was mentioned previously in clinical, animal, and in vitro culture studies. The level of BDNF was significantly decreased in serum samples of patients with cirrhosis due to biliary atresia and hepatitis.33,34 Recently, a human study by Stawicka et al 35 presented serum levels of BDNF were decreased in cirrhosis patients with HE and introduced it as a diagnostic marker for HE. Furthermore, the protein and expression levels of BDNF were significantly decreased in the brain tissues of hyperammonemic animal models of HE.36-40 Also, the BDNF-induced functional morphological changes of astrocytes were disrupted when cultures were exposed to ammonia. 41
The third hub gene ERBB2 (Erb-B2 receptor tyrosine kinase 2), named HER-2, HER-2/neu, and Erb-B2, is a member of the EGFR family of receptor tyrosine kinases, and due to the lack of ligand-binding domain, no ligands have yet been introduced for it. This protein strongly forms a heterodimer with other receptor family members such as Erb-B2 receptor tyrosine kinase 3 (ERBB3) and Erb-B2 receptor tyrosine kinase 4 (ERBB4) to facilitate ligand-binding process and its consequent activation of downstream signaling pathways. 42 These downstream signaling through MAPK, phosphoinositide 3-kinase (PI3K/Akt), protein kinase C (PKC), and finally signal transducer and activator of transcription (STAT) mediate cell proliferation and differentiation. 42 Activation of ERBB2 following brain injury triggers astrocyte proliferation and ensures the survival of neurons. 43 The mRNA and protein of ERBB2 are abnormally increased in the liver tissues of patients with fulminant hepatitis and concanavalin A–induced fulminant hepatitis mouse model. 44 In a recent study, overexpression of cytoplasmic and nuclear ERBB2 and its downstream protein STAT3 was observed following immunohistochemistry analysis of 1125 liver samples from patients with different liver dysfunction. 45
The GFAP is another important hub gene in cirrhosis-induced HE genetic network. The GFAP proteins, monomeric intermediate filaments, are highly expressed in astrocytes to medicate dynamic properties of these cells for contributing the homeostasis of the CNS and maintaining the structure of the BBB. 46 Abnormal expression of cerebral GFAP (as an astrocyte reactivity marker) in many clinical, in vivo, and in vitro hyperammonemic studies has been examined previously. Postmortem examination of brain tissues from HE patients revealed a significant decrease in GFAP proteins in cerebral cortex and basal ganglia. 47 An increase in immunoreactivity of GFAP was also observed in postmortem cerebellum specimens from cirrhotic patients and nonalcoholic steatohepatitis.48,49 Abnormal expression of GFAP was also reported in the brain sample after neurosurgery in a patient with HE. 50 In bile duct-ligated (BDL) rats as an animal model of HE, the expression of GFAP in substantia nigra, ventral tegmental area, hippocampus, and dorsal striatum decreased while in cerebral cortex strongly increased compared with control rats.39,51 A decrease in the expression of GFAP in parahippocampal area of thioacetamide-induced HE animals was also obvious. 52 Furthermore, the expression of GFAP proteins in the brain tissue of swine models of HE was decreased and astroglial cells changed morphologically. 53 On the contrary, in other studies, GFAP immunoreactivity was significantly increased in hippocampal areas of thioacetamide-induced HE rats54,55 and cerebral cortex of hyperammonemic rats, 56 whereas in BDL-induced cirrhosis and HE rats, opposite results were seen. 55 Ammonia on organotypic mice brain slice increased expression of GFAP and caused astrocyte swelling. 57 In vitro exposure of astrocyte cultures to ammonia significantly decreased the expression of GFAP filaments. 58
The fifth hub gene was AQP4, which is an integral membrane protein and main aquaporin water channel in the CNS and contributes to the brain water homeostasis. These channels mainly express and localize on astrocyte end-feet in place of the BBB and ensure normal water flow through the brain parenchyma. 59 The role of AQP4 in the pathophysiology of HE and brain edema has been discussed previously. 6 Abnormal expression and mislocation of AQP4 in the brain tissue following liver diseases may be responsible for the accumulation of neurotoxic substances in the brain interstitium and its consequences such as neuroinflammation, progression of astrocyte swelling and cerebral edema.6,60 Postmortem analysis of brain samples from patients with liver failure has shown that the expression of mRNA and protein of AQP4 significantly increased in perivascular astrocytes end-feet. 61 Increased expression of AQP4 in the cerebral cortex, hippocampus, thalamus, and basal ganglia has been identified in acetaminophen-, thioacetamide- and BDL-induced liver failure and HE rodents.62-64 Furthermore, AQP4 depletion (knockout AQP4) in acetaminophen- and thioacetamide-induced HE mice significantly suppressed cerebral edema. 65 Some studies have reported that the expression of AQP4 was not changed in the brain of galactosamine- and thioacetamide-induced HE and hyperammonemic rats, whereas it was significantly upregulated in BDL-induced cirrhosis rats.66-68 Mislocation and reduced expression of AQP4 water channels in the olfactory bulb and prefrontal cortex along with severe cognitive impairments were also observed in BDL-induced HE rats. 60 Hyperammonemic conditions in astrocyte cultures caused the mislocation of AQP4 on the plasma membrane, 69 whereas in another study, it caused ammonia-induced upregulation of AQP4 on the astrocyte membrane. 70
The SLC1A2 known as excitatory amino acid transporter 2 (EAAT2) and glutamate transporter 1 (GLT-1) is a solute carrier family that is mainly expressed in astroglial cells which mediates the reuptake of the glutamate neurotransmitters from excitatory synaptic spaces in the CNS that guarantee normal neuronal functions. 71 Studies on animal models of HE and hyperammonemic condition indicated that the protein expression of EAAT2 significantly decreased in the brain which led to an increase in the concentration of extracellular glutamate and progression of cerebral edema.72-76
Pathway analysis revealed fatty acid beta-oxidation and serotonin receptor 2 and ELK-SRF/GATA4 signaling were 2 important involved pathways for upregulated and downregulated cerebral DEGs, respectively. Fatty acid beta-oxidation is a process by which fatty acids break down to acetyl coenzyme A (acetyl CoA) to produce adenosine triphosphate (ATP) in mitochondria through the tricarboxylic acid cycle. It has long been believed that glucose was the main fuel source for neural cells that were maintained during the oxidative phosphorylation in neurons and glycolysis in astrocytes. In the brain, fatty acids can transport across the BBB via fatty acid transporters or passive diffusion.77,78 However, recent evidence suggests that the oxidation of fatty acids in the astrocyte’s mitochondria is another significant source of energy in the CNS.79-82 Recent studies have also revealed that genes associated with fatty acid oxidation are more expressed in astrocytes compared with neurons.81,83 Carnitine palmitoyltransferase 1a (CPT1a) is the main protein responsible for the production of acyl-carnitine from acyl CoA in the outer membrane of mitochondria, a process that is important in fatty acid beta-oxidation 84 and mainly expressed on astroglial cells into the CNS 85 but not on neurons. Glutamate toxicity, mitochondrial damage, depletion of cellular ATP stores, and decreased energy metabolism have been reported in the brain of animal models of HE86,87 as well as ammonia-exposed astrocyte cultures.88-91 Exposure of the primary culture of astrocytes to glutamate inhibits fatty acid beta-oxidation. 81 Glutamate toxicity and mitochondrial impairments may be responsible for ATP depletion and decreased brain energy metabolisms following HE due to the inhibition of astroglial fatty acid oxidation.
The dysfunctional serotonergic system has been reported in HE that is implicated in the onset of neuropsychiatric manifestations and behavior changes of HE. 92 Increased serotonergic tone and a raise in extracellular brain serotonin as an inhibitory neurotransmitter have been revealed in animal models of HE. 93 Furthermore, an increase in binding sites for serotonin receptor 2 has been shown in the hippocampus of cirrhosis-induced HE patients. 94 Also, the brain concentration of serotonin was correlated with the degree of shunting and the level of blood ammonia in portal-systemic shunting rats. 95
Here, we suggest astrocytes, Bergmann glia, oligodendrocytes, and satellite glial cells as the mainly affected cellular types in association with upregulated cerebral DEGs, whereas photoreceptor cells, pyramidal cells, and retinal ganglion cells were the mainly involved cell types in relation to downregulation DEGs (Figure 5). Therefore, in our bioinformatic analyses, upregulated genes are mostly implicated in the brain glial cells and downregulated genes are mentioned in the involvement of main visual cells and neurons which can be well investigated by future experimental studies.
The result of tissue expression analysis indicated that thalamus, striatum, hippocampus, cortex, and amygdala were more important brain regions that were affected by cirrhosis and HE (Figure 6A). Surprisingly, time-series tissue expression analyses showed that thalamus can be considered an exclusive brain region in cirrhotic patients with different age groups (Figure 6B). The striatum, hippocampus, and cerebral cortex may be more involved in adolescent patients with HE (Figure 6B).
As gene expression patterns can be strongly regulated at posttranscriptional levels, we also predicted 14 TFs and 20 miRNAs, which can target some DEGs from cirrhosis patients (Table 2). The miRNAs can mediate many cellular processes such as proliferation, migration, differentiation, and apoptosis through downregulation of their target mRNA and with dysregulation of specific mRNA may develop diseases. 96 Targeting these miRNAs as a gene-regulatory option can be considered a probable therapeutic target for cirrhosis-induced HE in future studies.
Finally, our study predicted 39 significant and potentially effective drugs/agents for HE (Figure 7). Among these agents, flufenamic acid (a cyclooxygenase inhibitor), troglitazone (a peroxisome proliferator–activated receptors (PPARs) activator), and glafenine have anti-inflammatory effects. As inflammation along with hyperammonemia can exacerbate manifestations of HE, prescription of anti-inflammatory drugs may be effective.97,98 Trichostatin A (antifungal), vancomycin (against gram-positive bacteria), and trovafloxacin (as a broad-spectrum antibiotic) were also annotated as antibiotic agents. Antibiotic therapy along with non-absorbable disaccharides considered a first-line therapeutic option for the management of HE. 99 Effective therapy with vancomycin was suggested for patients with HE.100-102 Other important predicted medication therapies for HE are dietary supplements and antioxidant agents such as acetylcysteine (also known as N-acetylcysteine), retinoic acid (known as all-trans-retinol), and ascorbic acid. N-acetylcysteine therapy significantly improved the survival of patients with paracetamol-induced acute liver failure and non-paracetamol-associated liver failure and HE.103,104 Antipsychotic drugs such as haloperidol (as a dopamine D2 receptor antagonist) and clozapine (an antagonist at the 5-HT2A subunit of the serotonin receptor) were also associated with HE in our study. Administration of haloperidol sufficiently controls delirium, agitation, and epileptic seizures in patients with HE. 105 The protective effect of clozapine on HE is still debated. Previous studies have reported hepatotoxic effects for clozapine.106,107 A number of antineoplastic agents such as calphostin C (a potent inhibitor of protein kinase C), cytarabine, doxorubicin, demecolcine (as a microtubule-depolymerizing agent), fluorouracil (as a thymidylate synthase inhibitor), panobinostat (as a non-selective histone deacetylase inhibitor), belinostat (as a histone deacetylase inhibitor), and paclitaxel were also predicted. Furthermore, amiodarone (an antiarrhythmic agent) and isoproterenol (a non-selective β adrenoceptor agonist) were other annotated drugs for cirrhosis-induced HE. Rosiglitazone (as a peroxisome proliferator-activated receptors activator), tesaglitazar, and myo-inositol (a natural insulin sensitizer) as antidiabetic agents were also suggested for HE. Rosiglitazone therapy significantly decreased the risk of cirrhosis in patients with type 2 diabetes and improved the hepatic metabolism of asymmetric dimethylarginine in rat models of HE.108,109 Buspirone as an agonist of the serotonin 5-HT1A receptor was also predicted in the study. The protective effect of buspirone in carbon tetrachloride-induced cirrhosis through an antioxidant-dependent manner has been confirmed. 110
Conclusion
Altogether, we comprehensively analyzed DEGs from cerebral tissues of cirrhotic patients with HE compared with healthy subjects through an integrated bioinformatics approach. We then proceeded our analysis through different public databases such as Enricher, ToppGene, and CSEA to reveal the mainly involved biological processes, signaling pathways, and brain regions as well as identify potential effective drugs for HE. These findings not only confirmed many previously known involved signaling pathways but also disclosed new insights into other molecular and cellular mechanisms of HE. Furthermore, our results identified some hub genes from significant DEGs in relation to HE that may provide new therapeutic targets for HE. The small sample size can be considered the main limitation of the study and collecting more clinical samples from HE patients can make the study results more reliable. Moreover, the findings should be studied more thoroughly by in vivo and in vitro experiments in the future.
Supplemental Material
sj-docx-1-bbi-10.1177_11779322231155068 – Supplemental material for New Insight Into Mechanisms of Hepatic Encephalopathy: An Integrative Analysis Approach to Identify Molecular Markers and Therapeutic Targets
Supplemental material, sj-docx-1-bbi-10.1177_11779322231155068 for New Insight Into Mechanisms of Hepatic Encephalopathy: An Integrative Analysis Approach to Identify Molecular Markers and Therapeutic Targets by Ali Sepehrinezhad, Ali Shahbazi, Sajad Sahab Negah and Fin Stolze Larsen in Bioinformatics and Biology Insights
Footnotes
Funding:
The author(s) received no financial support for the research, authorship, and/or publication of this article.
Declaration Of Conflicting Interests:
The author(s) declared no potential conflicts of interest with respect to the research, authorship, and/or publication of this article.
Author Contributions
A Sepehrinezhad designed the study, carried out the literature review and data analysis, drew the illustrations, and drafted the manuscript. A Shahbazi designed the study, supervised the work, and participated in drafting the manuscript. FSL drafted the manuscript, critically revised, and scientifically edited the manuscript. SSN also scientifically and grammatically rechecked the revised manuscript. All authors read and approved the final manuscript.
Ethics approval and consent to participate
Not applicable.
Consent for publication
Not applicable.
Data Availability Statement
All data generated or analyzed during this study are included in this published article and its supplementary information file.
Supplemental Material
Supplemental material for this article is available online.
References
Supplementary Material
Please find the following supplemental material available below.
For Open Access articles published under a Creative Commons License, all supplemental material carries the same license as the article it is associated with.
For non-Open Access articles published, all supplemental material carries a non-exclusive license, and permission requests for re-use of supplemental material or any part of supplemental material shall be sent directly to the copyright owner as specified in the copyright notice associated with the article.