
Abstract
Background:
Pancreatic ductal adenocarcinoma (PDAC) is one of the most common cancers worldwide. Intense efforts have been made to elucidate the molecular pathogenesis, but the molecular mechanisms of PDAC are still not well understood. The purpose of this study is to further explore the molecular mechanism of PDAC through integrated bioinformatics analysis.
Methods:
To identify the candidate genes in the carcinogenesis and progression of PDAC, next-generation sequencing (NGS) data set GSE133684 was downloaded from Gene Expression Omnibus (GEO) database. The differentially expressed genes (DEGs) were identified, and Gene Ontology (GO) and pathway enrichment analyses were performed. The protein-protein interaction network (PPI) was constructed and the module analysis was performed using Integrated Interactions Database (IID) interactome database and Cytoscape. Subsequently, miRNA-DEG regulatory network and TF-DEG regulatory network were constructed using miRNet database, NetworkAnalyst database, and Cytoscape software. The expression levels of hub genes were validated based on Kaplan-Meier analysis, expression analysis, stage analysis, mutation analysis, protein expression analysis, immune infiltration analysis, and receiver operating characteristic (ROC) curve analysis.
Results:
A total of 463 DEGs were identified, consisting of 232 upregulated genes and 233 downregulated genes. The enriched GO terms and pathways of the DEGs include vesicle organization, secretory vesicle, protein dimerization activity, lymphocyte activation, cell surface, transferase activity, transferring phosphorus-containing groups, hemostasis, and adaptive immune system. Four hub genes (namely, cathepsin B [CCNB1], four-and-a-half LIM domains 2 (FHL2), major histocompatibility complex, class II, DP alpha 1 (HLA-DPA1) and tubulin beta 1 class VI (TUBB1)) were obtained via taking interaction of different analysis results.
Conclusions:
On the whole, the findings of this investigation enhance our understanding of the potential molecular mechanisms of PDAC and provide potential targets for further investigation.
Keywords
Introduction
Pancreatic ductal adenocarcinoma (PDAC) is a type of cancer that arises from the cells lining the pancreatic ducts. 1 Epidemiological studies have identified several risk factors for PDAC, including age, sex, smoking, chronic pancreatitis, obesity, diabetes, family history, and occupational exposure. 2 In terms of incidence, PDAC is the 12th most common cancer in the world, accounting for about 2% of all cancers. However, it is the seventh leading cause of cancer death, responsible for about 5% of all cancer deaths. 3 Despite new developments in multimodal therapy, its overall 5-year survival rate remains less than 8%. 4 Hemostasis is the process that stops bleeding, 5 and immunity refers to the body’s defense mechanism against foreign substances, including cancer cells. 6 Pancreatic ductal adenocarcinoma (PDAC) is associated with alterations in both hemostasis and immunity. Pancreatic ductal adenocarcinoma treatment commonly includes surgery, radiation, chemotherapy, and immunotherapy. 7 However, PDAC remains common and malignant due to recurrence and metastasis, and is ultimately key cause of PDAC-associated death. 8 Therefore, there is a vital need to advance new diagnostic strategies and therapeutic agents to upgrade the prognosis of patients with PDAC.
The molecular mechanisms of PDAC tumorigenesis and development remain imprecise. It is, therefore, key to identify novel genes and pathways that are linked with PDAC tumorigenesis and patient prognosis, which might not only help to illuminate the underlying molecular mechanisms involved but also to disclose novel diagnostic markers and therapeutic targets. Some of the key genetic alterations that have been implicated in PDAC include mutations in the KRAS proto-oncogene, GTPase (KRAS), tumor protein p53 (TP53), cyclin-dependent kinase inhibitor 2A (CDKN2A), SMAD family member 4 (SMAD4) and BRCA2 DNA repair–associated (BRCA2) genes. These mutations can occur in various combinations, and their precise roles in PDAC are still being studied. 9 Oji et al 10 demonstrated that the overexpression of WT1 is linked with prognosis in patients with PDAC. A previous investigation reported that phosphoinositide 3-kinase signaling pathway is linked with development of PDAC. 11 Next-generation sequencing (NGS) can promptly uncover gene expression on a global basis and is especially useful in identifying for differentially expressed genes (DEGs). 12 A huge amount of data have been generated through the use of NGS and the majority of such data have been deposited and saved in public databases. Previous investigations concerning PDAC gene expression profiling have diagnosed hundreds of DEGs. 13
Bioinformatics analysis is a beneficial strategy for the broad analysis of large databases, including knotty genetic information. In our investigation, we used sophisticated bioinformatics methods to screen potential biomarkers that might be useful for PDAC. The Gene Expression Omnibus (GEO) (https://www.ncbi.nlm.nih.gov/geo/) database 14 is an open database that allows researchers to select appropriate NGS data. In our investigation, we obtained NGS data set from the GEO (GSE133684) 15 and searched for DEGs using limma package of R language. We then performed GO term and pathway enrichment analyses of the identified DEGs using the ToppGene database. Protein-protein interaction networks (PPIs) were constructed using Integrated Interactions Database (IID) interactome database and visualized using Cytoscape. Conduct module analyses of the PPI network were performed using PEWCC1. The associations of hub genes with PDAC were determined using a Kaplan-Meier analysis, expression analysis, stage analysis, mutation analysis, protein expression analysis, immune infiltration analysis, and receiver operating characteristic (ROC) curve analysis. Finally, PDAC-related genes were selected to investigate their potential role in a PDAC diagnostic, prognostic, and therapeutic target.
Materials and Methods
Next-generation sequencing data source
NGS data of human mRNA about PDAC research (GSE133684) were obtained from the GEO database The DEGs were considered by 1 independent PDAC data set, GSE133684 15 with 284 PDAC and 117 normal control samples. The GSE133684 NGS data were based on the GPL20795 HiSeq X Ten (Homo sapiens) platform..
Identification of DEGs
The limma package of R language was used for DEGs between PDAC and normal control samples. 16 The P value was adjusted by the Benjamini-Hochberg method. 17 An adjusted P value of <0.05 and |log2 fold change (FC)| > 1 were considered as threshold values for DEGs identification. The ggplot2 package and gplots package of R language were used to generate volcano plot and heat map. A volcano plot displays the logarithm of the P value on the y-axis and the logarithm of the fold-change between the 2 conditions on the x-axis. The P-value represents the statistical significance of the difference in gene expression between the 2 conditions, while the fold-change indicates the magnitude of the difference. Heat maps are particularly useful in gene expression analysis, where they are commonly used to visualize gene expression patterns across different experimental conditions or samples. The identified DEGs were preserved for further bioinformatics analysis.
GO analysis and pathway enrichment analysis of DEGs
The GO repository (http://geneontology.org/) 18 consists of a massive set of annotation terms and is generally used for annotating genes and identifying the distinctive biological aspects for NGS data. The REACTOME database (https://reactome.org/) 19 contains data on known genes and their biochemical functions and is used for identifying functional and metabolic pathways. By performing the GO and REACTOME enrichment analysis at the functional level, we can boost a better understanding of the roles of these DEGs in the induction and in the advancement of PDAC. The ToppGene (ToppFun) (https://toppgene.cchmc.org/enrichment.jsp) 20 is an online resource that adds tools for functional annotation and bioinformatics analysis. Both GO categories and REACTOME pathway enrichment analysis were implemented using ToppGene to inform the functions of these DEGs. P < 0.05 was considered to indicate a statistically significant difference.
PPI network construction and module analysis
The online database IID interactome (http://iid.ophid.utoronto.ca//) 21 was used to construct a PPI network of the proteins encoded by DEGs. Then, Cytoscape software (Version 3.8.1) 22 was applied to perform protein interaction association network analysis with confidence score > 0.4 and analyze the interaction correlation of the candidate proteins encoded by the DEGs in PDAC. Next, the Network Analyzer Cytoscape plug-in was applied to calculate node degree, 23 betweenness centrality, 24 stress centrality, 25 and closeness centrality. 26 Finally, the PEWCC1 (http://apps.cytoscape.org/apps/PEWCC1) 27 module for Cytoscape was used to collect the significant modules in the PPI network complex.
Construction of miRNA-DEG regulatory network
The miRNet database (https://www.mirnet.ca/) 28 is a database containing miRNAs involved in various diseases. The miRNAs related to PDAC were searched from miRNet database. Through getting the intersection of the miRNAs and the DEGs, the miRNA-DEG regulatory relationships were selected. Finally, miRNA-DEG regulatory network was built using Cytoscape software.
Construction of TF-DEG regulatory network
The NetworkAnalyst database (https://www.networkanalyst.ca/) 29 is a database containing TFs involved in various diseases. The TFs related to PDAC were searched from TF database. Through getting the intersection of the TFs and the DEGs, the TF-DEG regulatory relationships were selected. Finally, TF-DEG regulatory network was built using Cytoscape software.
Validation of hub genes
After hub genes identified from expression profiling by high-throughput sequencing data set, UALCAN (http://ualcan.path.uab.edu/analysis.html) 30 was used to validate the selected upregulated and downregulated hub genes. UALCAN is an online tool for gene expression analysis between PDAC and normal data from the Cancer Genome Atlas (TCGA). It adds data such as gene expression, tumor staging, and survival period for PDAC. cBioPortal is an online platform (http://www.cbioportal.org) 31 for gene alteration of hub genes analysis from TCGA. Human protein atlas is an online database (HPA, www.proteinatlas.org) 32 for protein expression analysis between PDAC and normal data from TCGA. TIMER is an online platform (https://cistrome.shinyapps.io/timer/) 33 for immune infiltration analysis from TCGA. To explore diagnostic biomarkers of PDAC, we used the above hub genes as candidates to find their diagnostic value based on generalized linear model (GLM). 34 The pROC in R was used for receiver operating characteristic (ROC) curve analysis. 34 In brief, half of the samples (PDAC = 142, controls = 59) were aimlessly distributed as the training set and remaining data were used as the test set, which were used to set up a model. An ROC curve analysis was tested to calculate the specificity and sensitivity of the GLM prediction model. The area under the curve (AUC) was used to determine the diagnostic efficiency of the classifier.
Results
Identification of DEGs
We analyzed the DEGs of GSE133684 by using the limma package. We used P < 0.05 and |logFC| ⩾ 1 as the cutoff criteria. We screened 463 DEGs, including 232 upregulated genes and 231 downregulated genes in PDAC samples compared with normal control samples, which are listed in Table 1. We identified all the DEGs that were shown in the above volcano map according to the value of |logFC| (shown in Figure 1) and then displayed the DEGs on a heatmap (shown in Figure 2).
The statistical metrics for key differentially expressed genes (DEGs).


Volcano plot of differentially expressed genes. Genes with a significant change of more than 2-fold were selected. Green dot represented upregulated significant genes and red dot represented downregulated significant genes.

Heat map of differentially expressed genes. Legend on the top left indicates log fold change of genes. (A1-A114 = normal control samples; B1-B284 = PDAC samples). PDAC indicates pancreatic ductal adenocarcinoma.
GO analysis and pathway enrichment analysis of DEGs
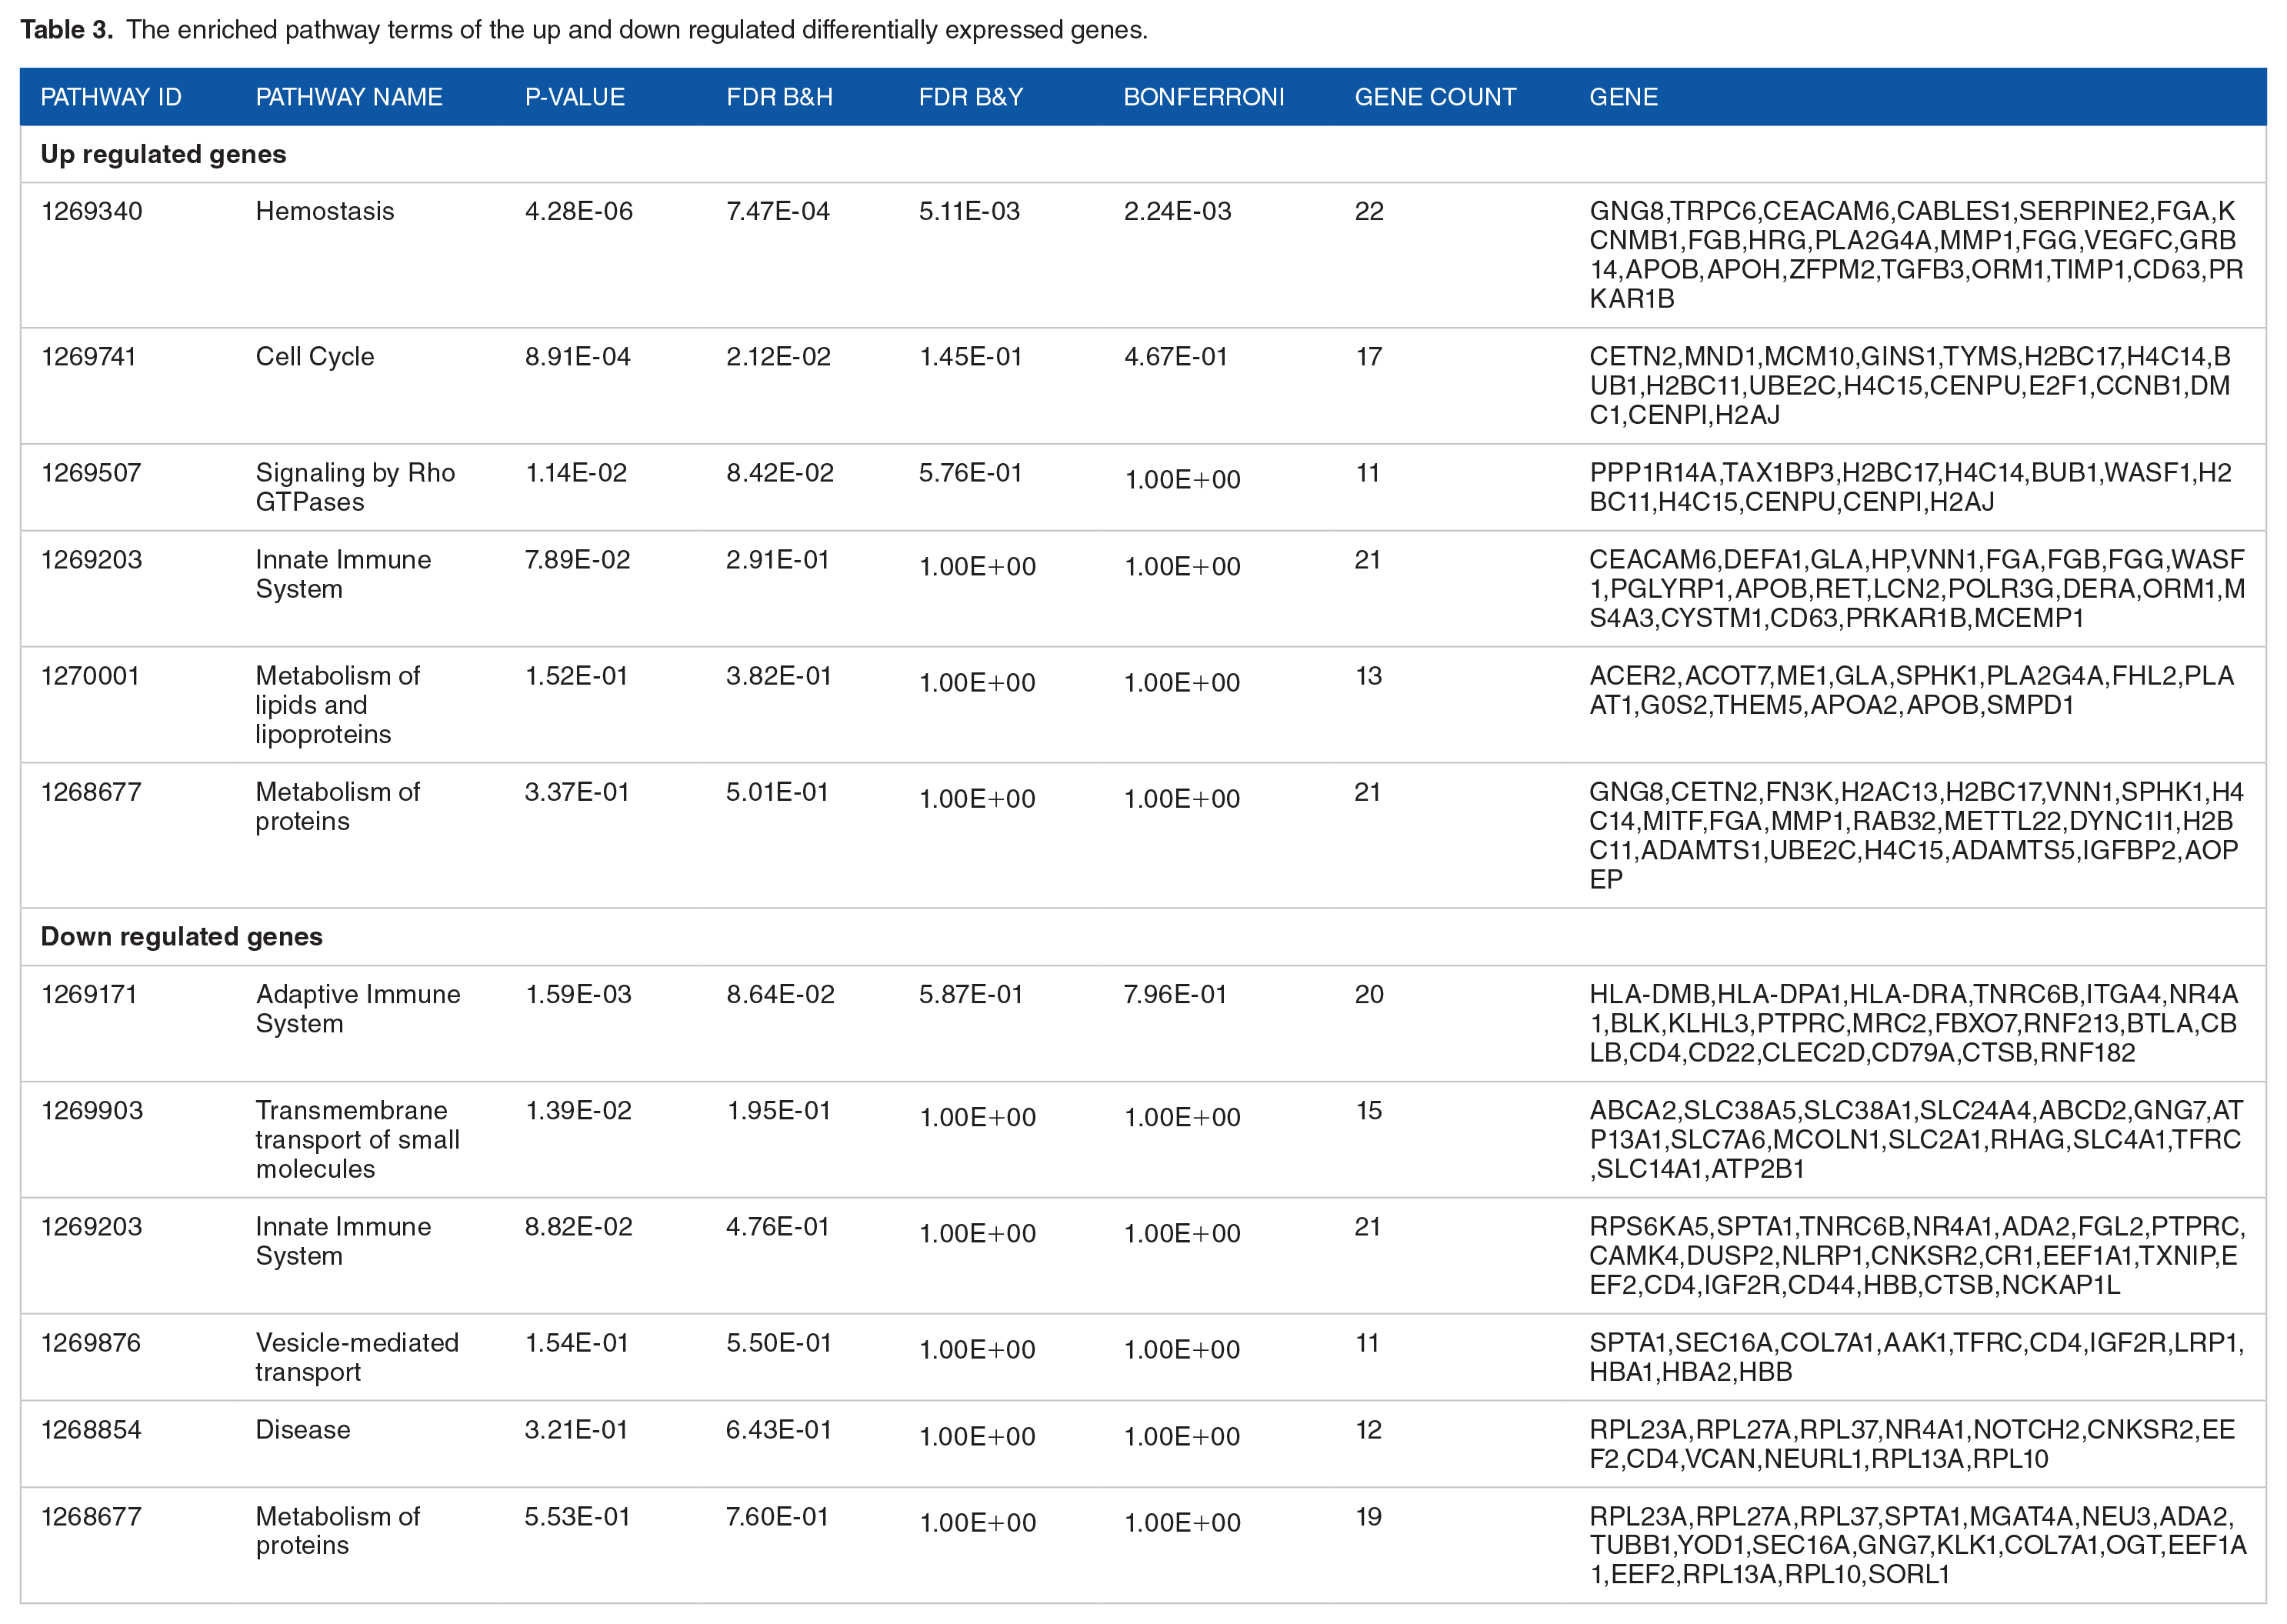
To symbolize the function of the DEGs and to identify important candidate pathways, GO functional enrichment analysis and REACTOME pathway enrichment analysis were performed. The results of GO categories analysis, including biological processes (BP), cellular components (CC) and molecular functions (MF), are listed in Table 2. First, the upregulated genes were annotated with the BP category, including vesicle organization and secretion, whereas the downregulated genes were annotated with the GO terms, including lymphocyte activation and regulation of cell death. Second, the upregulated genes were annotated with the GO terms of the CC category, namely, secretory vesicle and whole membrane, whereas the downregulated genes were annotated with the GO terms, including cell surface and intrinsic component of plasma membrane. Third, the upregulated genes were annotated with the GO terms of the MF category such as protein dimerization activity and signaling receptor binding, whereas the downregulated genes were annotated with the GO terms, including transferase activity, transferring phosphorus-containing groups, and drug binding. The REACTOME pathway enrichment analysis showed that the genes upregulated in tumors were enriched in hemostasis and cell cycle, while the downregulated genes were enriched in adaptive immune system and transmembrane transport of small molecules (Table 3).
The enriched GO terms of the up and down regulated differentially expressed genes.

Biological Process(BP), Cellular Component(CC) and Molecular Functions (MF).
The enriched pathway terms of the up and down regulated differentially expressed genes.
Protein-protein interaction (PPI) network construction and module analysis
After all the DEGs were uploaded to the online IID interactome database, the PPI network with 6188 nodes and 13 153 edges was constructed using the Cytoscape software (Figure 3A). Hub genes with the node degree, betweenness centrality, stress centrality, and closeness centrality were obtained and are listed in Table 4. Cathepsin B (CCNB1) and four-and-a-half LIM domains 2 (FHL2) were the upregulated genes, while major histocompatibility complex, class II, DP alpha 1 (HLA-DPA1), and tubulin beta 1 class VI (TUBB1) were the downregulated genes. Then, 2 significant modules that fulfilled the cut-off criteria, namely, PEWCC1 scores > 3 and number of nodes > 5, were screened (Figure 3B and C). The fibrinogen beta chain (FGB), fibrinogen alpha chain (FGA), fibrinogen gamma chain (FGG), eukaryotic translation elongation factor 1 alpha 1 (EEF1A1), ribosomal protein L13a (RPL13A), integrin subunit alpha 4 (ITGA4), ribosomal protein L27a (RPL27A), ribosomal protein L23a (RPL23A), and ribosomal protein L10 (RPL10) genes were identified in these modules. GO analysis of these genes showed that they were annotated with vesicle organization, regulation of cell death, and lymphocyte activation. In addition, the REACTOME enrichment analysis suggested that these genes were mainly involved in hemostasis, innate immune system, and disease and adaptive immune system.

PPI network and the most significant modules of DEGs. (A) The PPI network of DEGs was constructed using Cytoscape; (B) the most significant module was obtained from PPI network with 16 nodes and 44 edges for upregulated genes; (C) the most significant module was obtained from PPI network with 6 nodes and 20 edges for upregulated genes. Upregulated genes are marked in green; downregulated genes are marked in red. DEGs indicate differentially expressed genes; PPI, protein-protein interaction network.
Topology table for up and down regulated genes.

Construction of miRNA-DEG regulatory network
The regulatory network of miRNA-DEG and predicted targets is presented in Figure 4A. Microtubule-associated protein 1B (MAP1B) was modulated by 202 miRNAs (eg, hsa-mir-4461), CCNB1 that was modulated by 94 miRNAs (eg, hsa-mir-3928-3p), AHNAK nucleoprotein (AHNAK) that was modulated by 256 miRNAs (eg, hsa-mir-2682-5p), and lysine methyltransferase 2D (KMT2D) that was modulated by 209 miRNAs (ex: hsa-mir-1202) are listed in Table 5. As a group, a total of 257 of the 463 DEGs were contained in the miRNA-DEG regulatory network.

(A) Target gene—miRNA regulatory network between target genes and miRNAs (B) Target gene—TF regulatory network between target genes and TFs. Upregulated genes are marked in green; downregulated genes are marked in red; the blue color diamond nodes represent the key miRNAs; the gray color triangle nodes represent the key TFs.
miRNA—target gene and TF—target gene interaction.

Construction of TF-DEG regulatory network
The regulatory network of TF-DEG and predicted targets is presented in Figure 4B. Enhancer of zeste 2 polycomb repressive complex 2 subunit (EZH2) that was modulated by 45 TFs (eg, SRY-box transcription factor 2 [SOX2]), tropomyosin 1 (TPM1) that was modulated by 40 TFs (eg, MYC proto-oncogene, bHLH transcription factor [MYC]), AHNAK that was modulated by 58 TFs (eg, KLF4), and thioredoxin interacting protein (TXNIP) that was modulated by 51 TFs (eg, tumor protein p63 [TP63]) are listed in Table 5. As a group, a total of 259 of the 463 DEGs were contained in the TF-DEG regulatory network.
Validation of hub genes
All of the hub genes were validated in TCGA data. Hub genes contributed to the survival period in patients with PDAC, and we analyzed the overall survival (OS) for each hub gene by UALCAN (Figure 5). The results showed that the high expression of CCNB1 and FHL2 mRNA level was associated with the worse OS in patients with PDAC, while low expression of HLA-DPA1 and TUBB1 mRNA level was associated with the worse OS in patients with PDAC. As shown in Figure 6, the expression of the upregulated hub genes CCNB1 and FHL2 in PDAC was significantly elevated compared with normal, while expression of the downregulated hub genes HLA-DPA1 and TUBB1 in PDAC was significantly decreased compared with normal. The expression of each hub gene in PDAC patients was analyzed according to the individual cancer stage. As shown in Figure 7, the expression of CCNB1 and FHL2 were higher in patients with all individual cancer stages than that in normal, which revealed that these upregulated hub genes might be associated with tumor progression positively, whereas the expression of HLA-DPA1 and TUBB1 were lower in patients with all individual cancer stages than that in normal, which revealed that these downregulated hub genes might be associated with tumor progression positively. We used cBioportal tool to explore the specific mutation of hub genes in PDAC data set with 184 samples. From the OncoPrint, percentages of alterations in CCNB1, FHL2, HLA-DPA1, and TUBB1 genes among lung cancer ranged from 0% to 2.3% in individual genes (CCNB1, 0%; FHL2, 0.6%; HLA-DPA1, 2.3%; TUBB1, 2.3%) and are shown in Figure 8. In addition, we used the “HPA” to examine the protein expression levels of CCNB1 and FHL2, and found that the protein expression levels of the these hub genes were noticeably upregulated in PDAC compared with normal tissues, whereas protein expression levels of HLA-DPA1 and TUBB1 were noticeably downregulated in PDAC compared with normal tissues (Figure 9). The association of CCNB1, FHL2, HLA-DPA1, and TUBB1 expression level with immune infiltration abundance in PDAC was evaluated using TIMER database. CCNB1 and FHL2 expression were negatively correlated with infiltration degree of B cells, CD8+ T cells, macrophage, neutrophil, and dendritic cells, whereas HLA-DPA1 and TUBB1 were positively correlated with infiltration degree of B cells, CD8+ T cells, macrophage, neutrophil, and dendritic cells and are shown in Figure 10. As these 4 genes are prominently expressed in PDAC, we performed an ROC curve analysis to evaluate their sensitivity and specificity for the diagnosis of PDAC. As shown in Figure 11, CCNB1, FHL2, HLA-DPA1, and TUBB1 achieved an AUC value of >0.70, demonstrating that these genes have high sensitivity and specificity for PDAC diagnosis. The results suggested that CCNB1, FHL2, HLA-DPA1, and TUBB1 can be used as biomarkers for the diagnosis of PDAC.

Overall survival analysis of hub genes. Overall survival analyses were performed using the UALCAN online platform. Red line denotes high expression; Blue line denotes low expression. (A) CCNB1, (B) FHL2, (C) HLA-DPA1, (D) TUBB1.

Box plots (expression analysis) hub genes were produced using the UALCAN platform. (A) CCNB1, (B) FHL2, (C) HLA-DPA1, (D) TUBB1.

Box plots (clinical stage analysis) hub genes were produced using the UALCAN platform. (A) CCNB1, (B) FHL2, (C) HLA-DPA1, (D) TUBB1.

Mutation analyses of hub genes were produced using the CbioPortal online platform. (A) CCNB1, (B) FHL2, (C) HLA-DPA1, (D) TUBB1.

Immunohistochemical (IHC) analyses of hub genes were produced using the human protein atlas (HPA) online platform. (A) CCNB1, (B) FHL2, (C) HLA-DPA1, (D) TUBB1. PDAC indicates pancreatic ductal adenocarcinoma.

Scatter plot for immune infiltration for hub genes. (A) CCNB1, (B) FHL2, (C) HLA-DPA1, (D) TUBB1.

ROC curve validated the sensitivity and specificity of hub genes as a predictive biomarker for PDAC prognosis. (A) CCNB1, (B) FHL2, (C) HLA-DPA1, and (D) TUBB1. PDAC indicates pancreatic ductal adenocarcinoma; ROC, receiver operating characteristic.
Discussion
Due to the high heterogeneity of PDAC, it was still a disease with high rates of pervasiveness and fatality. With surgery as the main treatment, the other treatments including radiotherapy, chemotherapy, targeted therapy, and gene therapy as a additive to the finite treatment measures of PDAC, the 5-year survival rate was still less than 8%. 35 Therefore, the early diagnosis and effective treatment of PDAC are crucially required, which might be achieved via the identification of the DEGs between PDAC and normal control, and by considering the underlying molecular mechanism. NGS data analysis can screen a massive number of genes in the human genome for further functional analysis, and can be extensively used to screen biomarkers for early diagnosis and unique therapeutic targets. Therefore, they might help the diagnosis and prognosis of PDAC in the early stages and help in advancement of targeted treatment.
The current investigation systematically applied integrated bioinformatics methods to identify novel biomarkers that serve roles in the advancement of PDAC. The data extracted from the GEO data set contained 284 PDAC and 117 normal control samples. A total of 232 upregulated and 231 downregulated genes in PDAC, when compared with normal control samples, were identified using bioinformatics analysis, indicating the incidence and advancement of PDAC. The results of the DEGs might provide potential biomarkers for the diagnosis of PDAC. DAP (death associated protein), 36 keratin 8 (KRT8), 37 insulin-like growth factor binding protein 2 (IGFBP2), 38 keratin 19 (KRT19), 39 CD44 molecule (Indian blood group) (CD44), 40 AHNAK, 41 and BTG anti-proliferation factor 1 (BTG1) 42 were the potential gene targets of the drugs for treating PDAC. KIF2C 43 induces proliferation, migration, and invasion in gastric cancer patients through the MAPK signaling pathway. Drebrin 1 (DBN1) 44 has been reported to be expressed in breast cancer. MAP1B 45 has been reported to be associated with lung cancer progression. BCL2 interacting protein 3 like (BNIP3L) 46 is involved in the progression of breast and ovarian cancer. Integrin subunit alpha 4 (ITGA4) 47 was found to promote oral cancer. Serine/arginine repetitive matrix 2 (SRRM2) 48 plays an important role in regulating thyroid carcinoma. Interleukin 7 receptor (IL7R) 49 plays important roles in the progression of esophageal squamous cell carcinoma. Major histocompatibility complex, class II, and DR alpha (HLA-DRA) 50 have been reported to encourage the development of colorectal cancer. Sestrin 3 (SESN3) 51 is important in the development of hepatocellular carcinoma. These genes served as biomarkers for cancer diagnosis and prognosis.
Then, GO and REACTOME pathway analyses were used to investigate the interactions of these DEGs. Lysosomal protein transmembrane 4 beta (LAPTM4B), 52 CEA cell adhesion molecule 6 (CEACAM6), 53 serpin family E member 2 (SERPINE2), 54 vanin 1 (VNN1), 55 sphingosine kinase 1 (SPHK1), 56 histidine rich glycoprotein (HRG), 57 vascular endothelial growth factor C (VEGFC), 58 annexin A3 (ANXA3), 59 apolipoprotein A2 (APOA2), 60 lipocalin 2 (LCN2), 61 TIMP metallopeptidase inhibitor 1 (TIMP1), 62 CD63 molecule (CD63), 63 CD151 molecule (Raph blood group) (CD151), 64 mal, T-cell differentiation protein 2 (MAL2), 65 aryl hydrocarbon receptor nuclear translocator-like 2 (ARNTL2), 66 polycystin 2, transient receptor potential cation channel (PKD2), 67 E2F transcription factor 1 (E2F1), 68 matrix metallopeptidase 1 (MMP1), 69 C-C motif chemokine receptor 7 (CCR7), 70 notch receptor 2 (NOTCH2), 71 B and T lymphocyte associated (BTLA), 72 transferrin receptor (TFRC), 73 CD4 molecule (CD4), 74 ATM serine/threonine kinase (ATM), 75 lymphoid enhancer binding factor 1 (LEF1), 76 colony stimulating factor 1 receptor (CSF1R), 77 cathepsin B (CTSB), 78 dual specificity phosphatase 2 (DUSP2), 79 and nuclear receptor subfamily 4 group A member 1 (NR4A1) 80 are pathogenic genes for PDAC. Prostaglandin E receptor 3 (PTGER3) 81 and membrane associated guanylate kinase, WW and PDZ domain containing 2 (MAGI2) 82 have been reported to encourage the development of angiogenesis, chemoresistance, cell proliferation, and migration in ovary cancer. Recent studies have proposed that the haptoglobin (HP) 83 is associated with progression of lung cancer. FGA 84 is a gene which plays a role in diagnosis of lung cancer. FGB 85 has been known to be involved in gastric carcinoma. Phospholipase A2 group IVA (PLA2G4A), 86 FGG, 87 thymidylatesynthetase (TYMS), 88 RAB32, 89 SEPTIN4, 90 TPM2, 91 acyl-CoA thioesterase 7 ACOT7, 92 phosphoribosyl transferase domain containing 1 (PRTFDC1), 93 Cdk5 and Abl enzyme substrate 1 (CABLES1), 94 major histocompatibility complex, class II, DM beta (HLA-DMB), 95 protein tyrosine phosphatase receptor type C (PTPRC), 96 CD5 molecule (CD5), 97 CD6 molecule (CD6), 97 membrane spanning 4-domains A1 (MS4A1), 98 CD22 molecule (CD22), 99 CD27 molecule (CD27), 100 mannose receptor C type 2 (MRC2), 101 C-type lectin domain family 2 member D (CLEC2D), 102 EEF1A1, 103 and apolipoprotein B (APOB) 104 have a significant prognostic potential in various types of cancer. Sphingomyelin phosphodiesterase 1 (SMPD1) 105 expression in colorectal cancer results in drug resistance. Peptidyl arginine deiminase 4 (PADI4), 106 monoamine oxidase B (MAOB), 107 transient receptor potential cation channel subfamily C member 6 (TRPC6), 108 BCL11 transcription factor A (BCL11A), 109 C-X-C motif chemokine receptor 5 (CXCR5), 110 transcription factor 7 (TCF7), 111 POU class 2 homeobox 2 (POU2F2), 112 solute carrier family 4 member 1 (Diego blood group) (SLC4A1), 113 serine/threonine kinase 17b (STK17B), 114 and LDL receptor-related protein 1 (LRP1) 115 play crucial role in cancer cell invasion. Growth factor receptor bound protein 14 (GRB14), 116 transient receptor potential cation channel subfamily C member 6 (TRPC6), 117 zinc finger protein, FOG family member 2 (ZFPM2), 118 TNF receptor superfamily member 13B (TNFRSF13B), 119 ADAM metallopeptidase domain 19 (ADAM19), 120 and phosphoinositide-3-kinase interacting protein 1 (PIK3IP1) 121 are associated with cancer cell proliferation. HLA-DPA1, 122 fibrinogen like 2 (FGL2), 123 Cbl proto-oncogene B (CBLB), 124 NCK associated protein 1 like (NCKAP1L), 125 dual specificity tyrosine phosphorylation regulated kinase 2 (DYRK2), 126 O-linked N-acetylglucosamine (GlcNAc) transferase (OGT), 127 calcium-/calmodulin-dependent protein kinase ID (CAMK1D), 128 and ring finger protein 213 (RNF213) 129 are molecular markers for the diagnosis and prognosis of various types of cancer. Recent reports have revealed that RAR-related orphan receptor A (RORA), 130 insulin-like growth factor 2 receptor (IGF2R), 131 and zinc finger and BTB domain containing 20 (ZBTB20) 132 acted as polymorphic genes in various types of cancer. Versican (VCAN) 133 induces immune cell infiltration in cancer. Therefore, these enriched GO and pathways are most likely to be essential in the development of PDAC. In the future investigation, we might combine gene expression levels of these enriched genes and cell biological behavior analysis to further explore the pathogenesis of PDAC.
To explore the molecular mechanism of PDAC, we constructed the PDAC-related PPI network. CCNB1 134 plays a crucial role in proliferation of cancer cells. Recent reports have revealed that FHL2 135 and RPL10 136 acted as genetic factors in PDAC. FGB, 85 FGA, 84 FGG, 87 eukaryotic translation elongation factor 1 alpha 1 (EEF1A1), 103 and integrin subunit alpha 4 (ITGA4) 47 might be diagnostic markers of cancer and could be used as therapeutic targets. HLA-DPA1, TUBB1, RPL13A, RPL27A, and RPL23A were the novel potential gene targets of the drugs for treating PDAC in this investigation. Importantly, study on ribosomal proteins might be a significant novel direction for the diagnosis, prognosis, and treatment of PDAC.
The miRNA-DEG regulatory network and TF-DEG regulatory network were constructed to explore the molecular mechanism of PDAC. Researchers have shown that AHNAK 41 , E2F transcription factor 1 (E2F1), 68 cathepsin B (CTSB), 78 O-linked N-acetylglucosamine (GlcNAc) transferase (OGT), 127 FHL2, 135 EZH2, 137 KMT2D, 138 TXNIP, 139 TP63, 140 SOX2, 141 MYC, 142 and KLF4 143 promoted PDAC. MAP1B, 45 CCNB1, 134 TPM1, 144 and hsa-mir-1202 145 might be novel prognostic markers of cancer. We identified SEC16 homolog A, endoplasmic reticulum export factor (SEC16A), keratin 18 (KRT18), period circadian regulator 1 (PER1), hsa-mir-4461, hsa-mir-3928-3p, and hsa-mir-2682-5p might serve as potential novel biomarkers for PDAC. Therefore, these biomarkers might be used as potential effective candidates for early diagnosis or prognosis of PDAC.
Bioinformatics analysis has been performed and NGS data analysis has been carried out in these present investigations, but limitations exist. Lack of experimental validation of the hub genes is a limitation of the investigation. Corresponding experiments will be performed to verify hub genes in our future work, thus conversely testifying in bioinformatics analysis.
In conclusion, using NGS data set and integrated bioinformatics analysis, PDAC-associated hub genes were identified. The expression of the hub genes was revealed to be altered in PDAC. Experimental evidence is warranted to investigate the functional roles of the identified hub genes in PDAC. Collectively, it is our sincere hope that the present investigations will contribute to the discovery of new diagnostic and prognostic biomarkers as well as therapeutic targets for PDAC.
Footnotes
Acknowledgements
I thank Shenglin Huang, Fudan University, Shanghai, China, very much, the author who deposited their NGS data set, GSE133684, into the public GEO database.
Funding:
The author(s) received no financial support for the research, authorship, and/or publication of this article.
Declaration of Conflicting Interests:
The author(s) declared no potential conflicts of interest with respect to the research, authorship, and/or publication of this article.
Author Contributions
Muttanagouda Giriyappagoudar—Acquisition of resources and investigation.Basavaraj Vastrad—Writing original draft, and review and editing.Rajeshwari Horakeri—Formal analysis and validation.Chanabasayya Vastrad—Software and investigation.
Ethical Approval
This article does not contain any studies with human participants or animals performed by any of the authors.
Informed Consent
No informed consent because this study does not contain human or animals participants.
Consent for Publication
Not applicable.
Availability of Data and Materials
The data sets supporting the conclusions of this article are available in the GEO (Gene Expression Omnibus) (https://www.ncbi.nlm.nih.gov/geo/) repository ([GSE133684] [![]() ]).
]).