
Abstract
Genome-wide association study (GWAS) analyses have identified thousands of associations between genetic variants and complex traits. However, it is still a challenge to uncover the mechanisms underlying the association. With the growing availability of transcriptome data sets, it has become possible to perform statistical analyses targeted at identifying influential genes whose expression levels correlate with the phenotype. Methods such as PrediXcan and transcriptome-wide association study (TWAS) use the transcriptome data set to fit a predictive model for gene expression, with genetic variants as covariates. The gene expression levels for the GWAS data set are then ‘imputed’ using the prediction model, and the imputed expression levels are tested for their association with the phenotype. These methods fail to account for the uncertainty in the GWAS imputation step, and we propose a collaborative mixed model (CoMM) that addresses this limitation by jointly modelling the multiple analysis steps. We illustrate CoMM’s ability to identify relevant genes in the Northern Finland Birth Cohort 1966 data set and extend the model to handle the more widely available GWAS summary statistics.
Introduction
In the last decade, genome-wide association studies (GWASs) have identified thousands of genetic variants associated with complex traits. However, an understanding of the mechanisms linking a genetic variant to a complex trait is relatively limited. As many GWAS loci are located outside coding regions and regulatory variation plays an important role in shaping observed traits, gene expression has been proposed as an informative intermediate phenotype. 1 Incorporating regulatory information into statistical analyses provides us with a principled approach to study the genetic contribution to complex traits through the regulation of gene expression.
One approach to incorporate functional information is to do so without explicitly modelling the relationship between gene expression and phenotype. Sequence Kernel Association Tests (SKATs), 2 for instance, can be used to prioritize genetic variants based on functional annotation. It is based on the idea that genetic variants with known biological functions are more likely to be associated with a trait. Hence, when testing for association between genetic variants and a trait, the genetic variants are prioritized by placing larger weights on those with known functions. 2
Recently, the growing availability of transcriptome data has given rise to methods that evaluate genetically regulated gene expression using both GWAS and transcriptome data sets. Large-scale transcriptome data sets, which contain information on genotypes and gene expression levels, include the Genotype-Tissue Expression Consortium (GTEx), 3 the Genetic European in Health and Disease (GEUVADIS) Project, 4 Braineac, 5 Depression Genes and Networks 6 and eQTLGen. 7
Methods that have leveraged on both GWAS and transcriptome data include PrediXcan8,9 and transcriptome-wide association study (TWAS) 10 and generally proceed in 3 steps. First, using transcriptome data, they fit predictive models for gene expression with genetic variants near a gene as covariates. PrediXcan proposed the use of elastic net regression or ridge regression to build a predictive model, while TWAS proposed the use of a linear mixed model. The fitted models are then used to predict the gene expression levels for individuals in the GWAS data set. Finally, a simple linear regression is used to examine the association between the predicted expression levels and the complex trait in the GWAS data set.
Methods that proceed in such a stage-wise manner do not account for the uncertainty that arises when imputing the gene expression levels in the GWAS data set, which may lead to a loss in statistical power. To address this limitation, we proposed the collaborative mixed model (CoMM), 11 which accounts for the uncertainty in the ‘imputation’ model by jointly fitting the imputation and the association analysis models.
Method
Suppose that the gene expression levels for
In the CoMM, we first model the relationship between gene expression

where

where
The quantity of interest is

effectively treating the effects of genotype on gene expression as random. An accelerated expectation–maximization (EM) algorithm using parameter expansion 12 is used to estimate all parameters in the joint model given by equations (1) and (2). Figure 1 summarizes the data input, the joint model, and output for CoMM.

Schematic of CoMM. The transcriptome and GWAS data sets are used to fit the parameters in the model given by equations (1) and (2). The parameter estimates are used to evaluate the likelihood ratio test statistic, which tests for association between the phenotype and genetically regulated gene expression. CoMM indicates collaborative mixed model; GWAS, genome-wide association studies.
As our objective is to evaluate whether a gene is associated with the phenotype via gene expression, we perform the hypothesis test

The likelihood ratio test is used, and the test statistic is given by

where
Results in the Northern Finland Birth Cohort 1966
We analysed the GWAS data set from the Northern Finland Birth Cohort 1966 (NFBC1966) 13 with the aid of transcriptome data from GTEx (tissue: subcutaneous adipose). 3 The NFBC1966 data set records traits such as body mass index (BMI), low-density lipoprotein cholesterol (LDL), triglycerides (TGs), total cholesterol (TC), systolic blood pressure (SysBP), and diastolic blood pressure (DiaBP).
The CoMM returns a larger number of significant findings than PrediXcan and SKAT, as indicated by the QQ-plots of the P values (Figure 2). In particular, CoMM reported 12 significant genes associated with triglyceride (TG) levels, whereas PrediXcan:Enet, PrediXcan:Ridge, and SKAT reported 2, 1, and 0 significant genes, respectively. Among the 12 identified genes, 2 (OST4 and EIF2B4) have nonnegligible cellular heritability (
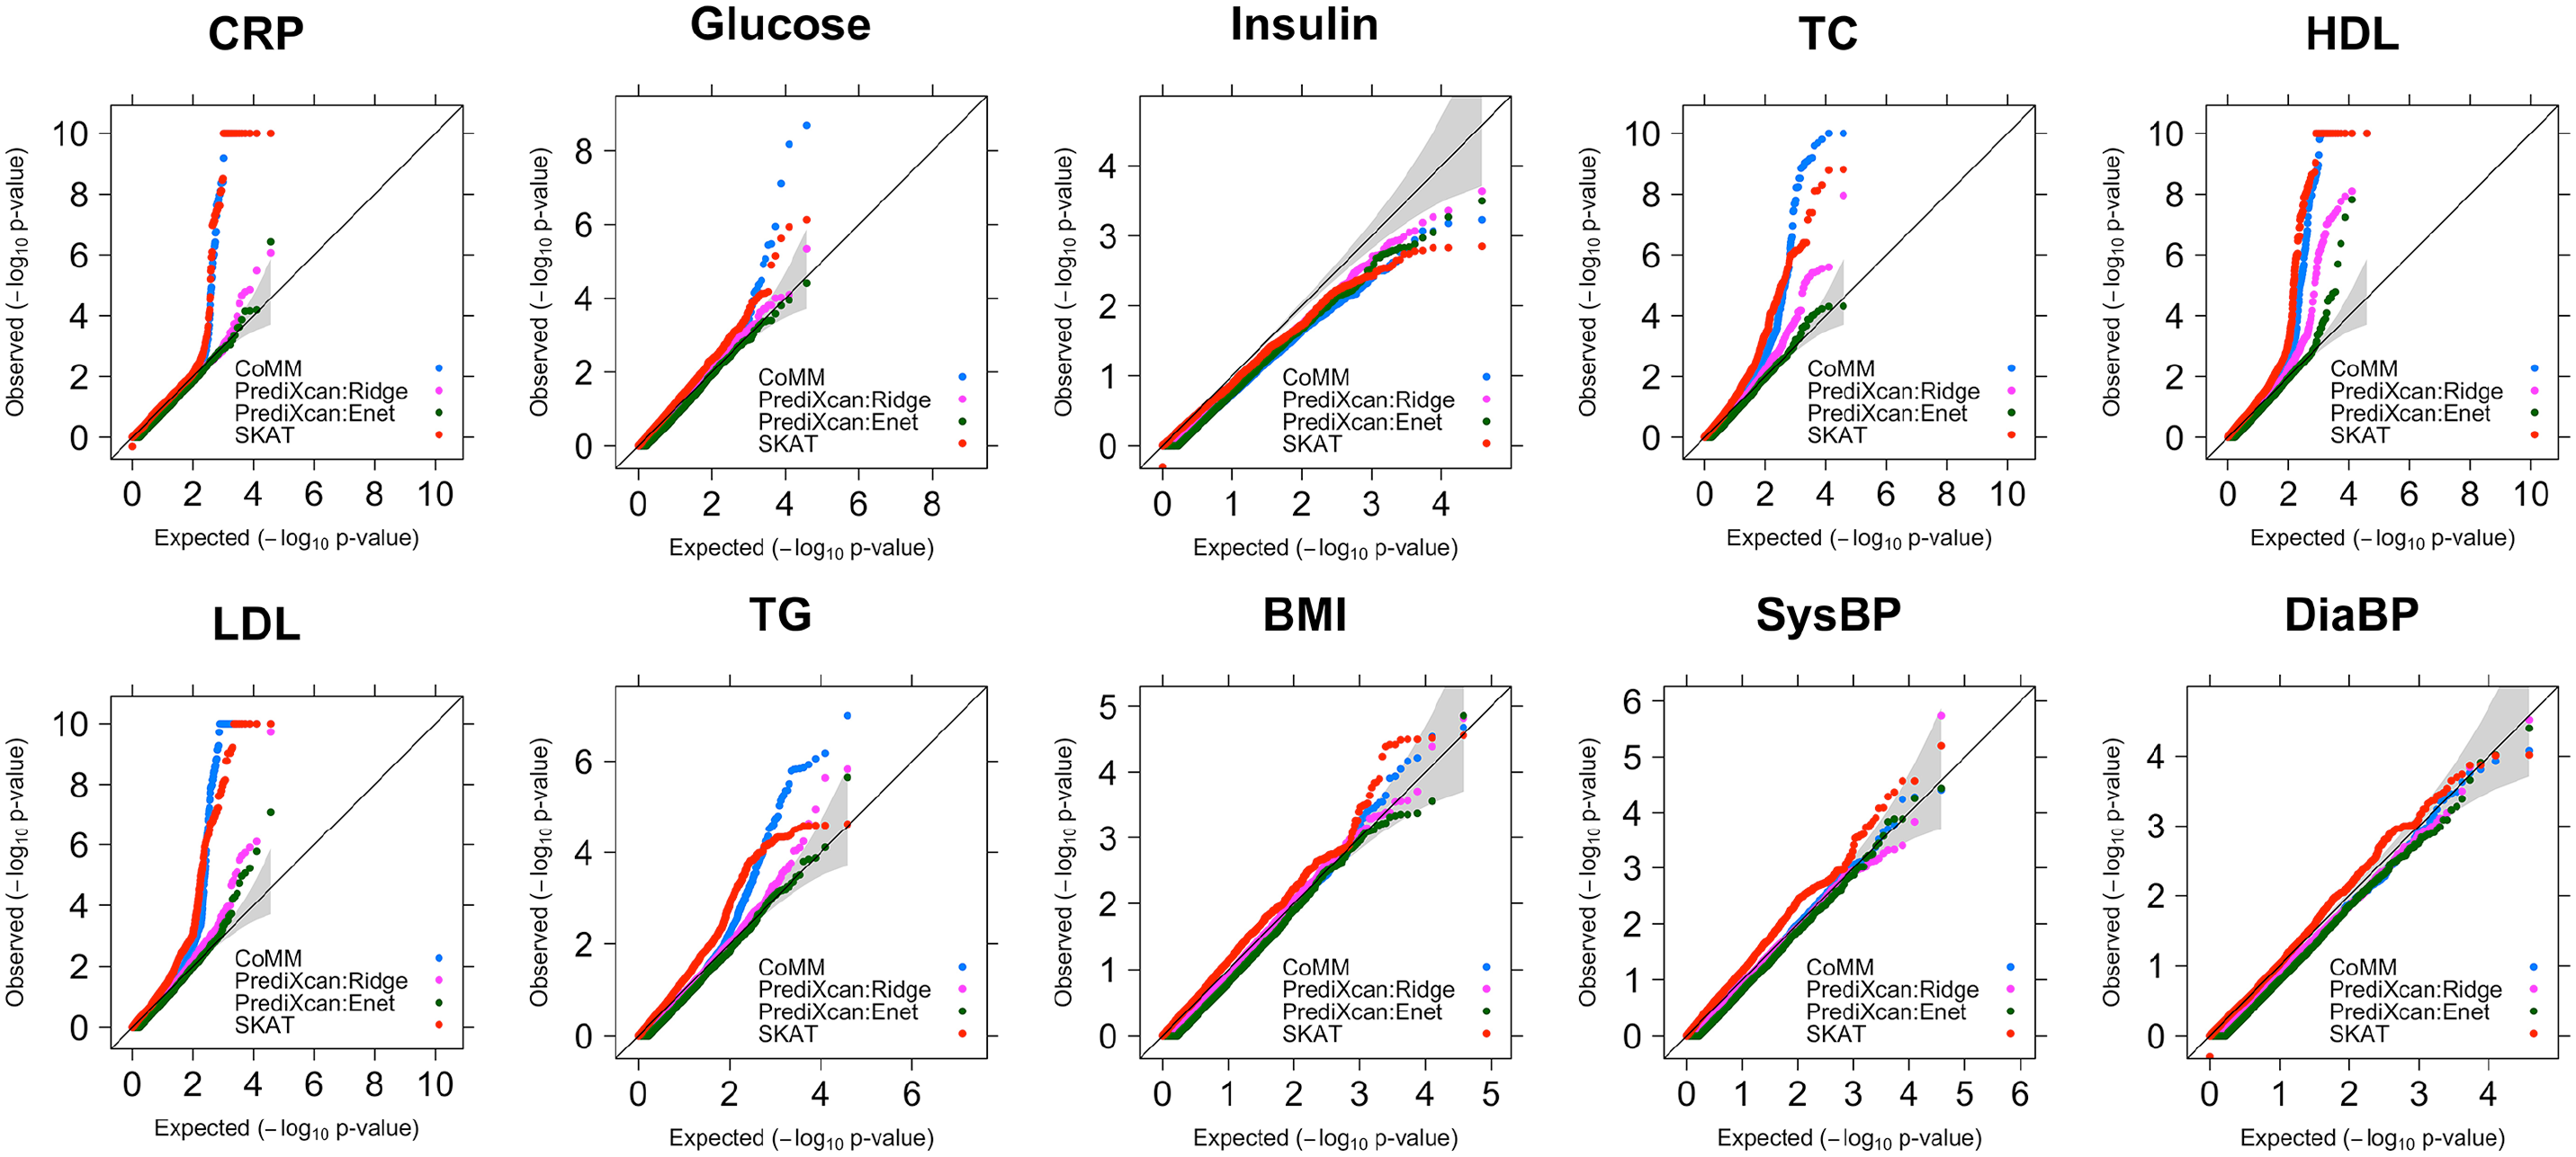
The QQ-plots of P-values for the quantitative traits in NFBC1966.
Extension of CoMM to Analyse GWAS Summary Data
A limitation of CoMM is that it requires individual-level data and is unable to make use of large-scale GWAS that provide only summary statistics. To capitalize on these GWAS, we extend CoMM so that summary statistics, in the form of estimated SNP effect sizes and their variances, can replace the role of individual-level GWAS data.
We adapt the method of Zhu and Stephens, 16 which made use of summary statistics by introducing a regression with summary statistics (RSS) likelihood in a Bayesian framework. As gene expression levels are modelled using multiple SNPs, we additionally require information on the correlations among SNPs (linkage disequilibrium). Fortunately, such information is available in public data sets such as the 1000 Genomes Project Consortium. 17 In CoMMs for GWAS summary statistics (CoMM-S2), 18 the association between phenotype and genetically regulated gene expression is evaluated by combining the distribution for individual-level transcriptome data with an RSS distribution for GWAS summary statistics, while taking into account linkage disequilibrium as estimated from a reference panel.
Even though CoMM-S2 utilizes GWAS summary statistics, it has comparable performance as CoMM. To illustrate the performance of CoMM-S2 relative to CoMM, we use NFBC1966 as the GWAS data set, GTEx as the transcriptome data set and the 1000 Genomes Project as a reference panel to estimate linkage disequilibrium. In general, the test statistic values from CoMM-S2 are close to their corresponding values from CoMM: the regression slope is around 1 and R2 ranges from 0.91 to 0.99 (Figure 3). The close correspondence in test statistic values is most apparent in the null region. In the nonnull region, the test statistics for CoMM-S2 may be inflated (Figure 3). One possible reason for this is linkage disequilibrium misspecification, 18 due to the genetic differences between the Finnish cohort in NFBC1966 and the European sample in the 1000 Genomes Project. 19 Nonetheless, as a strong inflation occurs only when the CoMM statistics is large, CoMM-S2 maintains a reasonable false-positive rate in the presence of misspecified linkage disequilibrium.

Scatter plot of test statistics from the likelihood ratio test for CoMM-S2 versus CoMM, using GTEx (tissue: subcutaneous adipose) transcriptome data, NFBC1966 GWAS data, and 1000 Genomes Project reference panel data.
Finally, we note that both CoMM and CoMM-S2 are designed for single-tissue analysis. When a multi-tissue transcriptome data set is available, an approach that takes into account genetic correlation across tissues may be preferable. Such an approach would be better equipped to identify biologically relevant tissues for each gene, and may also provide an increase in statistical power for tissues that are difficult to obtain. 20 Recently, 2 multi-tissue approaches, UTMOST 20 and MultiXcan, 21 have been proposed. They are more powerful than single-tissue approaches in expression-trait association analyses. However, they ignore the uncertainty due to the imputation step, and similar to what has been proposed for CoMM and CoMM-S2, the ability to detect relevant genes can be further improved by combining the imputation model and association analysis model via a unified likelihood framework. This remains a promising avenue for further research.
Footnotes
Acknowledgements
The authors thank the National Supercomputing Centre, Singapore, for providing computational resources for the project.
Funding:
The author(s) disclosed receipt of the following financial support for the research, authorship, and/or publication of this article: This work was supported by the Duke-NUS Medical School (grant no. R-913-200-098-263) and Singapore’s Ministry of Education Academic Research Fund (AcRF) Tier 2 (grant nos. MOE2016-T2-2-029, MOE2018-T2-1-046, and MOE2018-T2-2-006).
Declaration of conflicting interests:
The author(s) declared no potential conflicts of interest with respect to the research, authorship, and/or publication of this article.
Author Contributions
JL and CY conceived this commentary. YY performed the analysis and computation. K-FY wrote the manuscript in consultation with JL and CY.