
Abstract
The psychostimulant amphetamine can be prescribed to ameliorate the symptoms of narcolepsy, attention-deficit hyperactivity disorder and to facilitate weight loss. This stimulant can also have negative effects including toxicity and addiction risk. The impact of amphetamine on gene networks is partially understood and this study addresses this gap in consideration of the physical activity. The striata of mice exposed to either amphetamine or saline treatment were compared in a mouse line selected for home cage physical overactivity, a phenotype that can be mitigated with amphetamine, and in a contemporary control line using RNA-seq. Genes presenting opposite expression patterns between treatments across lines included a pseudogene of coiled-coil-helix-coiled-coil-helix domain containing 2 gene (Chchd2), ribonuclease P RNA component H1 (Rpph1), short stature homeobox 2 (Shox2), transient receptor potential melastatin 6 (Trpm6), and tumor necrosis factor receptor superfamily, member 9 (Tnfrsf9). Genes presenting consistent treatment patterns across lines, albeit at different levels of significance included cholecystokinin (Cck), vasoactive intestinal polypeptide (Vip), arginine vasopressin (Avp), oxytocin/neurophysin (Oxt), thyrotropin releasing hormone (Trh), neurotensin (Nts), angiotensinogen (Agt), galanin (Gal), prolactin receptor (Prlr), and calcitonin receptor (Calcr). Potassium inwardly rectifying channel, subfamily J, member 6 (Kcnj6), and retinoic acid-related (RAR)-related orphan receptor alpha (Rora) were similarly differentially expressed between treatments across lines. Functional categories enriched among the genes presenting line-dependent amphetamine effect included genes coding for neuropeptides and associated with memory and neuroplasticity and synaptic signaling, energy, and redox processes. A line-dependent association between amphetamine exposure and the synaptic signaling genes neurogranin (Nrgn) and synaptic membrane exocytosis 1(Rims1) was highlighted in the gene networks. Our findings advance the understanding of molecular players and networks affected by amphetamine in support of the development of activity-targeted therapies that may capitalize on the benefits of this psychostimulant.
Introduction
Amphetamine is a psychologic and metabolic stimulant that can enhance the concentration, awareness and physical activity of the exposed individual. 1 The effects of this stimulant have been harnessed in treatments to ameliorate neurological disorders including excessive sleepiness (narcolepsy), attention-deficit and hyperactivity, and to facilitate weight loss. 2 The variety of applications of amphetamine-based treatments has resulted in an increase in the use of this stimulant that has been accompanied with an increase in reports of the negative effects. 1 The effects of acute amphetamine treatment encompass toxic reaction, increased wakefulness, anorexia, hyperactivity, and affected reward-dependent systems can be the preamble to drug tolerance, sensitivity and abuse. 2 Amphetamine exposure is associated with disruptions in neurological and molecular mechanisms in the striatum.3,4 This brain region participates in the control of locomotor activities, voluntary behavior, spatial memory, and reward-dependent behaviors including addiction to substances, alcohol, physical activity, gambling, and shopping.5–7
Insights into the effects of amphetamine at the behavioral and molecular levels have been gained from the study of studying biomedical models of neurological disorders that are typically treated with this stimulant. Heterozygous knockout mice for dopamine transporter hypofunctional (DAT+/-) exhibited attentional and impulsivity deficits and high physical activity that can be ameliorated with a low-dose amphetamine treatment.8,9 Likewise, a mouse line that is conditional knockout for the brain-derived neurotrophic factor (Bdnf) exhibited higher locomotor activity and attentional deficit than wild-type mice10,11. Bdnf is a modulator of neurotransmitter release and has been associated with voluntary exercise. Also, mice null for adhesion G protein-coupled receptor L3 (Adgrl3), a gene associated with high physical activity and susceptibility to addiction, exhibited longer time-to-immobility and shorter immobility time in a forced swimming test than wild-type mice. These two mouse lines exhibited differential expression of genes annotated to cell adhesion and calcium signaling that are annotated to neuron structure and function in the prefrontal cortex, striatum, and hippocampus. 12
In addition to mouse lines deficient for particular genes associated with amphetamine-treated disorders, mouse lines selected for correlated phenotypes have been helpful to understand the impact of amphetamine.13–17 A chronic low-dose amphetamine treatment injected to mouse of a line selected for high home cage activity decreased the levels of activity and motor impulsivity and of neural activation in the prefrontal cortex and cerebellum.13,16,17 The amphetamine treatment had the opposite effect on neural activation of neurons in the control line suggesting that amphetamine had a line-dependent effect. In a subsequent generation, the high home cage activity line presented lower synaptophysin immunoreactivity in the striatum than the control line. Also, a predicted pseudogene for n-cofilin was over-expressed whereas adhesion G protein-coupled receptor L3 (Adgrl3) and fibronectin leucine-rich transmembrane protein 3 (Flrt3) were under-expressed in the high active line after amphetamine injection relative to control. Similarly, a mouse line selected for an anxiety-related behavior presented a reduction in locomotor activity after exposure to a low and acute amphetamine dose. 14 The amphetamine treatment was associated with inhibition of the activity of glycogen synthase kinase 3beta (Gsk3b) in the medial prefrontal cortex 14 and differential expression of genes annotated to angiogenesis, cell adhesion, apoptosis, and neural development processes. 18 Despite the previous advances, the effects of amphetamine on gene networks within mouse line have not been completely characterized.
The objective of this study was to advance the understanding of the potential impact of amphetamine exposure on the gene networks. To accomplish this, we studied mouse lines that present different genetic predisposition for voluntary overactivity, a condition treatable by amphetamine. The analysis of gene expression profiles within line network provided a comprehensive characterization of the mode of action of amphetamine treatment. Complementary insights were gained from the characterization of amphetamine effects across lines and of line effects across amphetamine treatments. These findings advance the understanding of the molecular relationships impacted by amphetamine in support of candidate gene translational research to enhance the effectiveness and safeness of amphetamine-based therapies.
Material and Methods
Animal experiments
All animal procedures were approved by the Illinois Institutional Animal Care and Use Committee and were in accordance with the National Institutes of Health Guide for the Care and Use of Laboratory Animals. Twenty drug-naive male mice were group-housed after weaning and were relocated to a home cage that included a video capture device at approximately 2 months of age.16,17 This setting enabled the recording of the distance traveled by individual mouse. The home cages were placed in rooms monitored for temperature (21°C ± 1°C) and the photo-period was set to 12:12 Light:Dark with lights off at 8:00 AM.16,17 Food (Harlan Teklad, 7012) and water were provided ad libitum.
One week after acclimatization to the home cages, half the mice received a single intraperitoneal injection of either 0.25 mg/kg of d-amphetamine (treatment A) sulfate (Sigma-Aldrich, St. Louis, MO, USA) and the other half were injected with an equal total volume of saline (treatment S) during the active phase (dark cycle) for mice. Mice were exposed to a single dose of amphetamine to facilitate the study of the direct effects of this drug on the transcriptome while excluding effects triggered by repeated exposure that are associated with the neuroadaptations including tolerance and sensitization.19,20
Within treatment, half of the mice belong to generation 17 of a line selected for increased home cage activity and the other half represent the contemporary control line.16,17,21 The selected overactive (O) and control (C) mouse lines originated from the Collaborative Cross reference population. 22 The lines were maintained in house and the parents of the subsequent generation were selected for high average distance traveled in days 5 and 6 after a week of cage acclimatization whereas the parents of the C line were selected at random.
The development and the distinct phenotypes of the O and C lines have been described.16,17,21 Briefly, by generation 10, adult male O mice exhibited higher open field behavior and lower performance on the Rotarod and Morris water maze relative to C mice. 17 By generation 16, adult male O mice exhibited significantly higher activity (distance traveled, wheel running) and motor impulsivity (measured using false alarms of the Go/No-go test) than C mice. The activity and motor impulsivity and the activation of neurons in the prefrontal cortex and cerebellum in generation 16 O mice relative to C mice decreased after repeated amphetamine exposure. 16
Mice were decapitated 2 h after the treatment injection and the brains were extracted immediately. This timeline is supported by prior reports of detectable changes in locomotor activity, mRNA and protein levels 2 h after injection of the stimulant in mice and rats.23–26 Mice group abbreviations used in this report list the amphetamine or saline treatment (A or S) followed by the control or overactive line (C or O). Therefore, for example, AO represents the group of amphetamine-treated mice from the overactive line and SC represents the group of saline-treated mice from the control line.
RNA-seq analysis
The striatum from the 20 mice studied was extracted and dissected on a chilled aluminum block, snap frozen on dry ice, and stored in a centrifuge tube at −80°C following our published protocols.27,28 Dorsal and ventral striatum were processed jointly and the RNase-free disposable pellet pestle (Fisher Scientific, Pittsburgh, PA, USA) was used for tissue homogenization and RNeasy1 Lipid Tissue Mini Kit (Qiagen, Valencia, CA, USA) was used for extraction of RNA. The isolated RNA was purified with DNase I (Qiagen). Total RNA yield measured using Qubit1 2.0 (Life Technologies, Carlsbad, CA, USA) was >14 μg per sample. The RNA Integrity Number (RIN) measured using Fragment Analyzer (Advanced Analytical Technologies Inc., Ankeny, IA, USA) was >8 for all samples.
The libraries from individual mouse samples were prepared using Illumina’s TruSeq Stranded RNA-seq Sample Prep kit (Illumina, San Diego, CA, USA) and 100nt-long paired-end reads from each animal separately were obtained. The libraries were sequenced using Illumina HiSeq 2500 and a TruSeq SBS sequencing kit version 4 (Illumina) and the FASTQ files containing paired-end reads of length 100nt were generated and demultiplexed with the software Casava 1.8.2 (Illumina). Limited sample resources prevented further validation of the profiles using alternative quantitative RNA technologies. The RNA-seq data files are available in the National Center for Biotechnology Information Gene Expression Omnibus (GEO) database (GSE117045).
The average Phred quality score of the reads was assessed using the software program FastQC. 29 The nucleotide quality score was > 30 across all read positions and, therefore, reads were not trimmed. 30 The software program TopHat2 v2.1.1 was used to map the reads to the mouse genome assembly Genome Reference Consortium GRCm38.31,32 Transcripts were assembled and differential abundance between mouse groups was estimated using the software program Cufflinks2 33 with default specifications. The specifications were bias correction; weight reads mapping to multiple locations in the genome; upper quartile normalization of the number of fragments mapping to individual loci; use of reference genome annotation to provide additional information for assembly; and statistical testing of differential expression in group contrasts.
Genes and networks were characterized using information from three orthogonal contrasts to facilitate the characterization of amphetamine effects. The orthogonal contrasts AC versus SC (denoted as AC-SC) and AO versus SO (denoted as AO-SO) provided information on the impact of amphetamine within line. The baseline contrast SC versus SO (SC-SO) provided information on standard line differences. Results from the non-orthogonalcontrast AO versus AC (AO-AC) are also provided to facilitate the interpretation of profiles. Fisher’s method was used to evaluate the evidence for departure from the joint null hypothesis of the joint set of orthogonal tests.34,35 For completeness, genes that do not exhibit differential expression across the orthogonal contrasts but exhibit differential expression between amphetamine treatments (A-S) or lines (O-C) were also presented. The Benjamini-Hochberg false discovery rate (FDR) was used to adjust the differential expression P-values for multiple testing. 36
Network and functional analyses
Networks encompassing genes that exhibited significant differential expression in at least one of the three orthogonal contrasts (AC-SC, AO-SO, SC-SO) were reconstructed to uncover gene dysregulation on a system-level basis.37,38 Networks were reconstructed using the BisoGenet package within the Cytoscape environment.39–42 These networks depict gene relationships based on protein-protein interactions annotated in the BIOGRID, HPRD, DIP, BIND, INTACT, and MINT databases.43,44 Network comparison revealed co-regulation patterns in response to amphetamine that were shared across lines or unique to a specific line.27,45
The genes profiled between treatment groups and lines were analyzed for functional enrichment to complement the information gained from the gene networks. Two complementary analyses were undertaken. The enrichment of functional categories among the genes exhibiting significant joint contrast test was evaluated using a hypergeometric test within the web-service Database for Annotation, Visualization and Integrated Discovery (DAVID; Version 6.8). 46 The functional categories assessed included gene ontology (GO) biological processes (BP), molecular functions (MF), and the Kyoto Encyclopedia of Genes and Genomes (KEGG) pathways. The Functional Annotation Tool (FAT) categories corresponding to the GO terms available in DAVID were used to minimize redundancies across the GO hierarchy. 27 Functional categories were clustered in DAVID and the geometric mean of the enrichment P-values (Enrichment Score, ES) was used as evidence supporting the category clusters. The mouse genome was used as background for testing and FDR was used to adjust the enrichment P-values for multiple testing. The enrichment of functional categories within gene pattern was also evaluated using a Kolmogorov test on the standardized expression profile of all genes available in the Gene Set Enrichment Analysis (GSEA) software. 47
Results and Discussion
The sequencing of individual mouse striatum libraries produced over 2.1 billion paired-end reads of length 100nt and, on average, 109 million reads per sample. On average, approximately 49 million pairs of reads per sample were aligned to the mouse reference genome totaling 89.54% of concordant read pairs aligned. Approximately 19 450 genes were tested using the Fisher method for departure from the joint null hypothesis of no differential expression on the joint set of orthogonal contrasts AO-SO, AC-SC, and SC-SO.
Gene expression changes associated with amphetamine within line
The present study of differential gene expression between amphetamine-treated groups across lines using information from 20 samples provided insights into transcriptome disruptions associated with the psychostimulant. Table 1 highlights the top 48 differentially expressed genes exhibiting an average |fold change| > 2.0 in both amphetamine contrasts and significant (FDR P-value < .05) joint set of orthogonal contrasts. A more comprehensive list of 304 genes exhibiting an average |fold change| > 1.4 in both amphetamine contrasts and significant (FDR P-value < .05) joint set of orthogonal contrasts is presented in Supplemental File Table A.
Genes exhibiting an average |fold change| > 2 in both amphetamine contrasts within line and significant (FDR-adjusted P-value < .05) joint orthogonal contrast test.

Abbreviation: FDR, false discovery rate.
Fold change (log2 transformed) between treatment-line groups: AC-SC = orthogonal contrast between amphetamine-treated control and saline-treated control mice; AO-SO = orthogonal contrast between amphetamine-treated overactive and saline-treated overactive mice; SC-SO = orthogonal contrasts between saline-treated overactive and saline-treated control mice; AO-AC = orthogonal contrast between amphetamine-treated overactive and amphetamine-treated control mice.
FDR-adjusted P-value.
Within the orthogonal contrasts, the numbers of significantly differentially expressed (FDR-adjusted P-value < .05) genes were 186 genes (AO-SO), 93 genes (AC-SC), and 494 genes (SC-SO). The overlap between genes across contrasts is depicted in Supplemental File Figure A. The lower number of differentially expressed genes in AO-SO (186 genes) relative to SC-SO (494 genes) indicates that gene expression in SO is more similar to AO than to SC. Approximately 15.5% of the differentially expressed genes in AO-SO overlap with SC-SO (115 genes). Overall, the overlap in differentially expressed genes between AO-SO and SC-SO suggests that amphetamine exposure reverted some of the gene dysregulation associated with overactivity.
The used psychostimulant treatment triggered changes in the level of gene expression in both lines. The more predominant dysregulation of genes triggered by amphetamine in the O relative to the C line is in agreement with the prescription of this drug to treat neurological disorders such as attention-deficit hyperactivity disorder (ADHD) that present symptoms of high physical activity, mood instability, attention difficulties, and impulsive behaviors.48,49
Results from the joint consideration of the orthogonal contrasts are consistent with reports of differences in behavioral and locomotor phenotypes and protein levels after amphetamine treatment between the O and C lines early on the selection experiment. After 10 generations of selection, amphetamine treatment lowered the locomotor activity in the O line and increased the activity in the C line. 17 In later generations, differences in impulsivity between the O and C lines in response to three injections of d-amphetamine daily (0.25 mg/kg dose) were also reported. 16 A significant interaction between anxiety behavior and amphetamine treatment on the activity of GSK3beta was also reported in another mouse ADHD model that used a line selected for low trait anxiety behavior and amphetamine treatment. 14
Prevalent gene expression profiles across amphetamine and line groups
Joint consideration of the signs of the log2(fold change) corresponding to the three orthogonal contrasts aided in the interpretation of the gene expression profiles. Within a contrast, the “+” or “-” sign of each denotes over-expression or under-expression, respectively, in the first mice group relative to the second mouse group. Profiles are expressed in terms of the signs of the three contrasts in the following order: AC-SC, AO-SO, and SC-SO. For example, the profile “+-+” indicates over-expression in the AC relative to the SC group, over-expression in the SC relative to the SO group, and under-expression in the AO relative to the SO group.
Among the genes in Table 1, one-third exhibited opposite amphetamine differential expression between both lines. The remaining two profiles, characterized by consistent over- or under-expression differential expression associated with amphetamine between lines but a different magnitude levels, were evenly distributed among over- and under-expression between treatments. The same proportion of genes exhibiting opposite amphetamine profiles were observed among the more comprehensive list of 304 genes exhibiting an average |log2(fold change)| > 0.5 in both amphetamine contrasts and significant joint set of orthogonal contrasts at FDR P-value < .05 (Supplemental File Table A).
The capacity of the amphetamine treatment studied to trigger different profiles is in agreement with the therapeutic uses and possible side effects of this psychostimulant. The molecular players affected by amphetamine between lines in opposite manner may be associated with the capacity of amphetamine to ameliorate certain neurologic disorders such as ADHD and narcolepsy. The molecular players similarly affected by amphetamine between lines may be associated with the capacity to develop an addiction to this psychostimulant. Among the genes presenting significant joint test of the three orthogonal contrasts, the profiles encompassing opposite effect of A and S treatments between lines included “+–” (256 genes), “-++” (167 genes), “-+-” (32 genes), and “+-+” (17 genes). The profiles encompassing consistent effect of A relative to S between lines included “+++” (470 genes), “—” (378 genes), “–+” (97 genes), and “++-” (80 genes).
Genes over-expressed in the AO relative to the SO group and under-expressed in the AC relative to the SC group (Table 1) included Gm13202, ribonuclease P RNA component H1 (Rpph1), short stature homeobox 2 (Shox2), transient receptor potential melastatin 6 (Trpm6), tumor necrosis factor receptor superfamily, and member 9 (Tnfrsf9). Gm13202 is a predicted pseudogene of coiled-coil-helix-coiled-coil-helix domain containing 2 gene (Chchd2) and mutations on Chchd2 have been associated with Parkinson disease and mitochondrial abnormalities that lead to dopaminergic neurodegeneration and motor dysfunction. 50 Increased risk for Parkinson disease has been identified in amphetamine users and this has been attributed to the similar effect of amphetamine and of environmental factors of the disease that lead to dopamine depletion, oxidative stress and mitochondrial dysfunction. 51 Also consistent with our results, Rpph1 was under-expressed in Schizophrenic patients treated with an antipsychotic. 52 In agreement with the over-expression of Shox2 in the AO relative to the SO group and under-expression in the AC relative to the SC group, this gene was also under-expressed in Adgrl3 null mouse, a model system to study susceptibility to addiction and ADHD, compared with wild-type mice. 12 The differential profile of Trpm6 between the A and S treatments across lines may be associated with the transmembrane ion channel transport role of the protein coded by this gene. Trpm6 has been associated with magnesium absorption and brain magnesium deficiency reduces serotonin levels whereas antidepressant drugs raise the level of this mineral. 53 In agreement with the over-expression in the AO relative to the SO group and under-expression in the SO relative to the SC group observed in this study, Tnfrsf9 was over-expressed in the striatum of mouse after methamphetamine administration. 54 Our findings demonstrate the potential for therapies based on genes that present line-dependent amphetamine profiles to ameliorate overactivity-related disorders such as ADHD while minimizing the disruption in other pathways triggered by amphetamine-based treatments.
S-adenosylmethionine decarboxylase 2 (Amd2) and glutathione S-transferase pi 2 (Gstp2) were over-expressed in the AC relative to the SC group, over-expressed in the SC relative to the SO group, and under-expressed in the AO relative to the SO group (Supplemental File Table A). These distinct profiles are consistent with reports that Amd2 was associated with modulation of limbic dopamine function that is involved climbing and wheel running behavior in rodents. 55 Gstp2 plays an important role in detoxification by providing protection to cells from injury by toxic chemicals and from products of oxidative stress that can be elicited in response to amphetamine exposure. 56 Forms of Gstp2 ameliorate the oxidative milieu especially prevalent in dopaminergic neurons. 57 Ribosomal protein L29 (Rpl29) presented the “-++” profile characterized by under-expression in the AC relative to the SC group, over-expression in the AO relative to the SO group, and over-expression in the SC relative to the SO group (Supplemental File Table A). Our result is consistent with reports under-expression of Rpl29 in the Adgrl3 null model of ADHD relative to wild-type mice. 12
Notable, a high number of genes coding for neuropeptides, hormones, and associated receptors exhibited the “+++” and “—” profiles across the three orthogonal contrasts AC-SC, AO-SO, and SC-SO (Table 1 and Supplemental File Table A). These genes presented different levels of amphetamine effect between lines. Genes over-expressed in the A relative to the S treatment included cholecystokinin (Cck) and vasoactive intestinal polypeptide (Vip). Genes under-expressed in A relative to S included arginine vasopressin (Avp), oxytocin/neurophysin (Oxt), thyrotropin releasing hormone (Trh), neurotensin (Nts), angiotensinogen (Agt), galanin (Gal), prolactin receptor (Prlr), and calcitonin receptor (Calcr). In addition, neurogranin (Nrgn), somatostatin receptor 3 (Sstr3), and cholecystokinin B receptor (Cckbr) exhibited the same pattern and significant joint contrast test albeit at lower fold change levels (Supplemental File Table A).
The innovative joint consideration of the gene patterns across orthogonal contrasts offered insights that are consistent with prior studies of targeted comparisons. Differential expression of hormone and neuropeptide genes associated with overactive and impulsivity phenotypes in humans and biomedical models have been described.58–61 Moreover, some of these neuropeptides and hormones also modulate the dopaminergic neurotransmitter systems and influence the effects of amphetamine. 62 Consistent with our findings of over-expression of Cck in the A relative to the S treatment in both lines and in SC relative to SO (Table 1), Cck diminished the locomotor stimulatory effects of low amphetamine doses in rats. 63 The over-expression of Nrgn in the A relative to the S treatment in both lines is consistent with increased levels of Nrgn in the frontal cortex of amphetamine-treated rats. 62
The under-expression of Nts in the A relative to S group in both lines and in SC relative to SO is in agreement with reports that Nts treatment blocks the hyperactivity induced by amphetamine treatment in rats. 64 Also in agreement with the Oxt pattern detected in our study (Table 1), Oxt treatment lowered the locomotor activity in cocaine- and methamphetamine-exposed mice58–61 and, amphetamine exposure altered Oxt and dopamine neurotransmission in prairie voles. 65 Similarly, the observed pattern supports reports that Avp treatment can reduce locomotor stimulation by amphetamine in mice 66
Two thyroid-related genes, the neuropeptide gene Trh and transthyretin (Ttr) exhibited the “—” profile characterized by under-expression in the A relative to the S treatment in both lines and in SC relative to SO. Trh plays a role in stimulating the release of thyroid-stimulating hormone and Ttr plays a role in thyroid synthesis. These thyroid hormones influence the behavior and cognitive function and, consistent with the pattern in our study, individuals that have lower levels of this hormone present behaviors similar to ADHD. 67 The observed Trh pattern was also in agreement with reports of lower levels of Trh in the striatum of rats 2 h after amphetamine administration. 68
The over-expression of Bdnf in the A relative to the S treatment and in the SC relative to the SO group confirms reports of a positive association between Bdnf levels and amphetamine administration. 69 Also, striatal levels of Bdnf were higher in wild type relative to heterozygous Bdnf knockout mice after acute amphetamine injection 24 and a knockout mouse line deficient in Bdnf exhibited high locomotor activity and attentional deficit.10,11 The over-expression of neurotrypsin (Prss12) in A- relative to S-treated mice (Supplemental File Table A) is consistent with reports that Prss12 knockout mice exhibited impaired long-term memory formation and cognitive deficits relative to a control mice whereas exposure to amphetamine heightened focus. 70 The solute carrier family 17 (sodium-dependent inorganic phosphate cotransporter), member 7 (Slc17a7) exhibited the “+++” profile (Supplemental File Table A). This profile is consistent with Slc17a7 participation in behavioral flexibility and adaptation, phenotypes that are typically associated with neuroplasticity in response to psychostimulants and with ADHD-related disorders. 71 The “+++” profile (Supplemental File Table A) of connective tissue growth factor (Ctgf) is in agreement with the profile of this gene in the study of amphetamine-treated rats from the spontaneously hypertensive model of ADHD. 18
Dopamine receptor 3 (Drd3) is among the genes exhibiting the “—” profile characterized by under-expression in the A relative to the S treatment and in the SC relative to the SO group (Supplemental File Table A). Drd3 is associated with regulation of blood pressure, behavioral response to the psychostimulant cocaine, and locomotor behavior. Our Drd3 finding is in agreement with the reported striatal over-expression of Drd3 in the spontaneously hypertensive rat model of ADHD relative to control rats. 72 Our study of gene expression in the A and S treatment groups using orthogonal contrasts enabled us to detect molecular players that presented distinct patterns between lines. These profiles in turn can aid in the identification of molecular targets to alleviate the effects of psychostimulant use and abuse in consideration of genetic predispositions to behavioral disorders that present overactivity-related phenotypes.
Characterization of amphetamine effects in gene networks
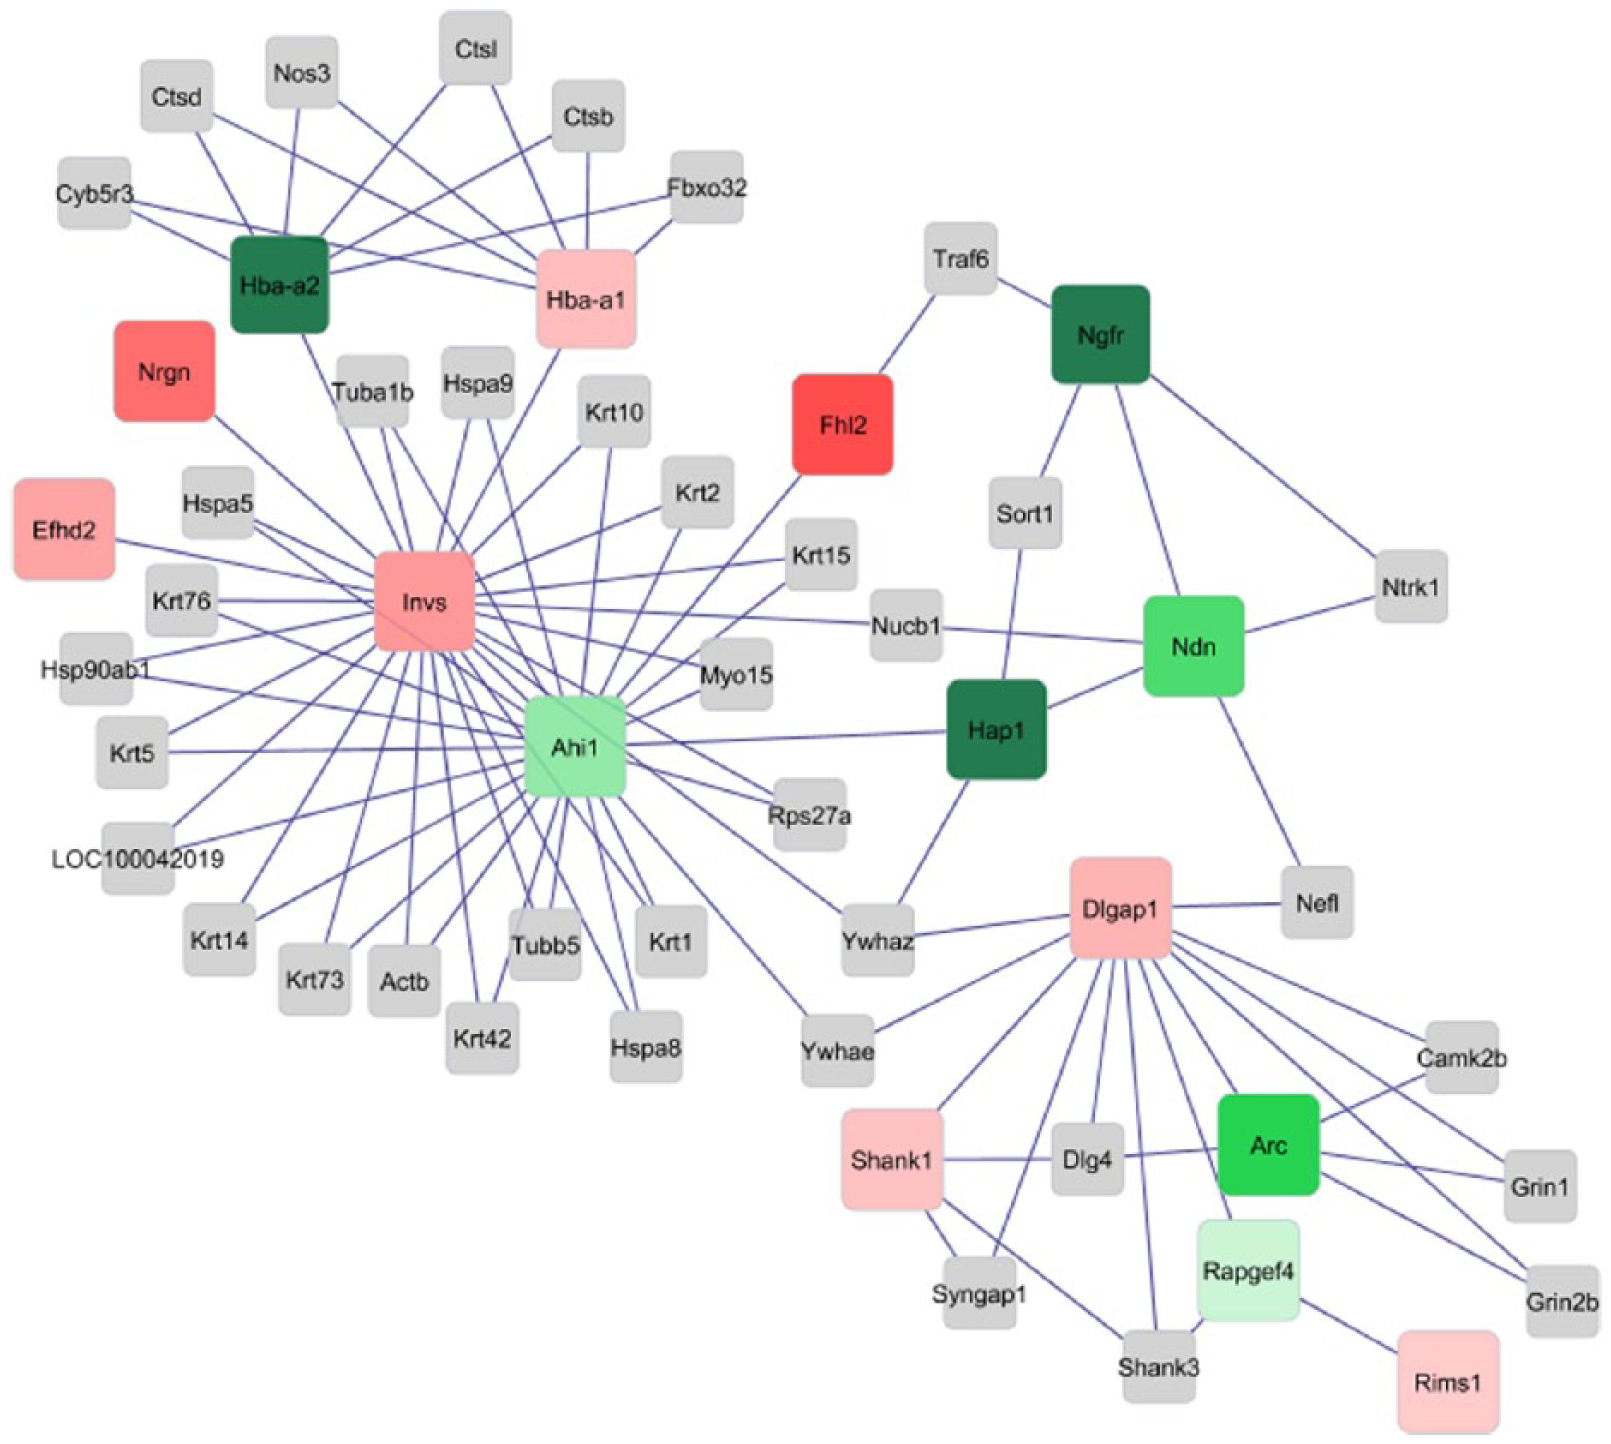
Network analysis complemented the differential expression analysis between mouse groups and helped us understand the potential impact of amphetamine in the relationships among genes within line. Gene networks were reconstructed using the profile of 75 core genes exhibiting significant joint orthogonal contrast test (FDR-adjusted P-value < .05), contrast |log2(fold change)| > 2, and P-value < .001 in one or more orthogonal contrasts. Individual gene co-regulation networks were developed for the three orthogonal contrasts: AC-SC (Figure 1), AO-SO (Figure 2), and SC-SO (Figure 3) and for the contrast AO-AC (Figure 4) to facilitate interpretation. The depicted networks encompass the largest number of core genes denoted by colored nodes. The color of the core gene node identifies the differential expression profile and the edges represent known molecular interactions between the genes listed in the curated BisoGenet database. The intensity of the node colors indicates the strength of the positive (green) and negative (red) expression contrast between the mouse groups. Genes directly connected to the core genes that did not reach the previous fold change and P-value thresholds are denoted by white nodes.

Over-expressed (green) and under-expressed (red) genes in the contrast between the amphetamine control and saline control (AC-SC) groups in the network of genes exhibiting significant joint orthogonal contrast (FDR-adjusted P-value < .05) and at least one significant pairwise contrast between line-treatment groups (|log2(fold change)| > 2 and P-value < .001). Color intensity is positively correlated with fold change. Gray connecting genes did not exhibit significant interaction effects. Genes: nerve growth factor receptor (Ngfr), neurogranin (Nrgn), inversin (Invs), Abelson helper integration site 1 (Ahi1), Fhl2, Huntingtin-associated protein 1 (Hap1), necdin (Ndn), DLG-associated protein 1 (Dlgap1), SH3 and multiple ankyrin repeat domains 1 (Shank1), activity-regulated cytoskeleton-associated protein (Arc), Rapgef4, hemoglobin alpha, adult chain 1 and adult chain 2 (Hba-a1 and Hba-a2), and regulating synaptic membrane exocytosis 1 (Rims1).

Under-expressed (red) and over-expressed (green) genes in the contrast between the amphetamine overactive and saline overactive (AO-SO) groups in the network of genes exhibiting significant joint orthogonal contrast (FDR-adjusted P-value < .05) and at least on significant pairwise contrast between line-treatment groups (|log2(fold change)| > 2 and P-value < .001). Color intensity is positively correlated with fold change. Gray connecting genes did not exhibit significant interaction effects. Genes: nerve growth factor receptor (Ngfr), neurogranin (Nrgn), inversin (Invs), Abelson helper integration site 1 (Ahi1), Fhl2, Huntingtin-associated protein 1 (Hap1), necdin (Ndn), DLG-associated protein 1 (Dlgap1), SH3 and multiple ankyrin repeat domains 1 (Shank1), activity-regulated cytoskeleton-associated protein (Arc), Rapgef4, hemoglobin alpha, adult chain 1 and adult chain 2 (Hba-a1 and Hba-a2), and regulating synaptic membrane exocytosis 1 (Rims1).

Over-expressed (green) and under-expressed (red) genes in the contrast between the saline overactive and saline control (SO-SC) groups for the network of genes exhibiting significant joint orthogonal contrast (FDR-adjusted P-value < .05) and at least one significant pairwise contrast between line-treatment groups (|log2(fold change)| > 2 and P-value < .001). Color intensity is positively correlated with fold change. Gray connecting genes did not exhibited significant interaction effects. Genes: nerve growth factor receptor (Ngfr), neurogranin (Nrgn), inversin (Invs), Abelson helper integration site 1 (Ahi1), Fhl2, Huntingtin-associated protein 1 (Hap1), necdin (Ndn), DLG-associated protein 1 (Dlgap1), SH3 and multiple ankyrin repeat domains 1 (Shank1), activity-regulated cytoskeleton-associated protein (Arc), Rapgef4, hemoglobin alpha, adult chain 1 and adult chain 2 (Hba-a1 and Hba-a2), and regulating synaptic membrane exocytosis 1 (Rims1).
Over-expressed (green) and under-expressed (red) genes in the contrast between the amphetamine overactive and amphetamine control (AO-AC) groups for the network of genes exhibiting significant joint orthogonal contrast (FDR-adjusted P-value < .05) and at least one significant pairwise contrast between line-treatment groups (|log2(fold change)| > 2 and P-value < .001). Color intensity is positively correlated with fold change. Gray connecting genes did not exhibited significant interaction effects. Genes: nerve growth factor receptor (Ngfr), neurogranin (Nrgn), inversin (Invs), Abelson helper integration site 1 (Ahi1), Fhl2, huntingtin-associated protein 1 (Hap1), necdin (Ndn), DLG-associated protein 1 (Dlgap1), SH3 and multiple ankyrin repeat domains 1 (Shank1), activity-regulated cytoskeleton-associated protein (Arc), Rapgef4, hemoglobin alpha, adult chain 1 and adult chain 2 (Hba-a1 and Hba-a2), and regulating synaptic membrane exocytosis 1 (Rims1).
The genes depicted in the networks have been associated with angiogenesis, cell adhesion, apoptosis, and neuronal development processes. The core differentially expressed genes in the network were nerve growth factor receptor (Ngfr), hemoglobin alpha, adult chain 1 and adult chain 2 (Hba-a1 and Hba-a2); Nrgn, inversin (Invs), Abelson helper integration site 1 (Ahi1), Fhl2, huntingtin-associated protein 1 (Hap1), necdin (Ndn), DLG-associated protein 1 (Dlgap1), SH3 and multiple ankyrin repeat domains 1 (Shank1), activity-regulated cytoskeleton-associated protein (Arc), Rapgef4, and regulating synaptic membrane exocytosis 1 (Rims1).
The network of the contrast AC-SC (Figure 1) highlights the stronger under-expression of Ngfr in the AC relative to the SC group in comparison to the weaker under-expression in the AO relative to the SO group (Figure 2). The neurotrophin receptor coded by Ngfr plays role in axonal growth. Consistent with our findings, this process was also enriched in a study of the effects of amphetamine on the striatum of spontaneously hypertensive rat line that models ADHD behaviors. 18 The network of the AO-AC contrast (Figure 4) had the lowest number of differentially expressed core genes across all four networks. This finding confirms that the level of amphetamine used was able to align the expression in both lines for the genes studied in the networks.
The integration of gene interaction and differential expression depicted in the networks enabled the visualization of co-regulation profiles. Nrgn and Rims1 exhibited the same pattern of differential expression (nodes with the same color) across all four networks. The network of the AO-SO contrast (Figure 2) depicts the stronger over-expression of Nrgn in AO relative to SO in comparison to a weaker trend of amphetamine in the C line (Figure 1). Rims1 exhibited a similar trend but the trend was more consistent across lines. The direction of the differential expression within contrast is consistent with the known annotation of these genes to calcium availability and transport processes and calcium channel activity that have been associated with substance abuse and emotional behaviors. 73 In agreement with the profiles in Figures 1 and 2, Nrgn was positively associated with neural plasticity and negatively associated with cognition deficit. These associations are related to the binding of Nrgn to calmodulin and lowering calcium availability. 74 Likewise, Rims1 participates in synaptic potentiation and inhibition of postsynaptic potential through the control the neuronal voltage-gated calcium channels activity. 75 The previously highlighted trends of these synaptic signaling genes in the gene networks could advance the understanding of the therapeutic effect of amphetamine in overactivity and ADHD-related behaviors.
The inferred networks depict the consistent relationship across amphetamine treatment and line groups between four directly connected genes that are associated with neurogenesis (Ndn, Ahi1, Ngfr, Hap1, and Fhl2). Ndn has also been associated with sensory perception of pain, Ahi1 participates in the regulation of behavior, and the transcription factor Fhl2 was implicated in the development of mouse forebrain. 76 Ndn, Ahi1, Ngfr, and Hap1 are directly and positively associated in the networks, exhibited the same pattern of differential expression (nodes with the same color) across all four networks whereas Fhl2 exhibited a negative correlation with the former four genes. The direction of the differential expression of Ndn, Ahi1, Ngfr, and Hap1 within contrast is consistent with the known role of these genes. Ndn, Ahi1, Ngfr, and Hap1 are over-expressed in the A relative to the S treatment group across lines and over-expressed in the C relative to the O line across treatments. Our network comparison highlights the capacity of amphetamine treatment to revert the dysregulation of these genes in the O line to levels comparable to those in the C line. Therapeutic effects of amphetamine in the treatment of impulsivity, overactivity, and ADHD behaviors may be linked to the opposite trend between the effects of selection for overactivity and amphetamine on these neurogenesis genes.
The juxtaposition across contrasts of the network module encompassing Shank1 and Arc furthered the understanding of the specific effects of amphetamine within activity lines. Psychostimulant treatment has been associated with dysregulation of Arc and Shank1 in the mouse striatum. 77 Arc is annotated to the amphetamine addiction KEGG pathway and is also associated with regulation of synaptic potentiation78,79 while changes in Shank1 have been correlated with social and vocalization behavior, memory, and synapse maturation. In the networks of treatment contrasts (Figures 1 and 2), Arc and Shank1 were over-expressed in the A relative to the S treatment, in a manner consistent with their established gene function. However, Arc and Shank1 were under-expressed in the C relative to the O line in the S treatment (Figure 3) and were not highly differentially expressed in the contrasts of lines within the A treatment (Figure 4). These results suggest that the differences in gene expression between lines observed in the S treatment are diminished by the A treatment. Our network study uncovered one mode of action of amphetamine that ameliorates the antagonistic disruption of Arc and Shank1 in the O relative to the C line.
The network analysis enabled us to evaluate changes in connections across amphetamine and line contrasts. The majority of the direct edges, connected core genes presenting the same pattern (e.g. edges connecting either red or green nodes). The notable exception was Invs and the connection of this gene with Nrgn, Efhd2, and Ahi1. In all contrasts except SC-SO, Invs and Ahi1 shared the same expression pattern and Invs and Nrgn had opposite expression patterns (Figure 3). Our network comparison enabled us to uncover this unique effect of amphetamine.
The comparative network analysis identified sub-networks of genes that were disrupted by the A treatment. The gene sub-network included Shank1, Arc, Rims1, Dlgap1, Rapgef4, and Dlgap1 but the latter 2 genes (that are associated with the regulation of synaptic signaling) did not exhibit substantial differential expression in the AO-AC network (Figure 3) in comparison to all other contrasts. This finding suggests that amphetamine can decrease the differential expression of genes between the O and C lines by targeting whole sub-networks of connected genes, rather than isolated genes.
Network analysis highlighted synergistic effect of the A treatment and O line in the co-regulation of three directly connected genes associated with vascular and blood systems: Invs, Hba-a1, and Hba-a2. Disruption of genes associated with angiogenesis processes was also reported in a study of the effect of amphetamine on the spontaneously hypertensive rat, a model for ADHD. 18 Also, hemoglobin is expressed in neurons and are essential to neuronal respiration and vascular system. 80 All three genes, Invs, Hba-a1, and Hba-a2, were over-expressed in the AC relative to the SC group (Figure 1) and under-expressed in the AC relative to the AO group (Figure 4). Thus, the level of expression of these genes was AO > AC > SC and this order suggests synergism between the effects of line and amphetamine treatment. These genes support the circulation of blood carrying oxygen which, in turn, supports the higher activity of the mice in the O line with higher alertness, focus, intensity, and duration of training and with lower fatigue of the mice receiving the A treatment. 80
Functional categories enriched among the genes exhibiting expression changes associated with amphetamine within line
The insights gained from the study of gene networks were complemented with the study of functional categories enriched across and within the orthogonal contrasts. Findings from the functional analysis enabled us to investigate disruptions beyond the core and directly connected genes. The analysis of the most common profiles across the three orthogonal contrasts enabled us to uncover shared disruptions. Highly enriched and informative clusters and descriptive GO and KEGG terms among the genes that exhibited significant joint contrasts are listed in Table 2. The complete list of enriched clusters with an ES > 4 and categories is presented in Supplemental File Table B. Enriched categories include the GO BP terms forebrain development, synaptic transmission, neurogenesis and neuronal development, ion transport, peptide hormone secretion, memory and learning, response to stimuli including hormones, and regulation of sensory perception.
Enriched (Enrichment Score ⩾ 4) informative clusters of representative gene ontology (GO) biological processes (BP) and molecular functions (MF) DAVID FAT categories among genes exhibiting significant joint orthogonal contrasts (FDR-adjusted P-value < .05).

Abbreviations: DAVID, Database for Annotation, Visualization and Integrated Discovery; FAT, Functional Annotation Tool; FDR, false discovery rate.
Number of genes in enriched category.
FDR-adjusted P-value.
Many of the enriched functional categories detected in our study were consistent with categories enriched in studies of amphetamine exposure and behavioral disorders including high voluntary physical activity. 5 The GO BP term “nervous system development” was enriched among the genes differentially expressed between amphetamine and control groups in the striatum of an ADHD model, spontaneously hypertensive rats. 18 The enrichment of genes associated with “synaptic signaling” was expected since some amphetamine-based therapy to ameliorate ADHD disrupts this signaling system. 81 The enrichment of the GO BP term “learning or memory” is consistent with the impaired working memory observed in congenic wiggling rats that are a model to study ADHD because they exhibit impulsive behaviors and high physical activity. 82 Moreover, high levels of physical activity have been associated with anatomical and physiological alterations in the brain size, volume, and spatial memory. 83 The enrichment of GO BP “blood circulation” terms (ES>5.2) ratifies the proposition that amphetamine treatment can enhance brain vasculature, blood flow and concomitantly angiogenesis and neurogenesis. 84
The agreement of enriched categories between the joint and individual contrast analysis suggests that joint analysis was not biased by a single contrast because the remaining contrasts would have lowered the statistical significance of the enrichment analysis. The most enriched informative clusters (ES > 3) of descriptive categories within each of the three orthogonal contrasts are summarized in Table 3 and a more complete list of clusters (ES > 2) including all categories is available in Supplemental File Table C.
Clusters of gene ontology (GO) biological process (BP), molecular function (MF) DAVID FAT categories enriched (enrichment score > 5) among the genes exhibiting a significant joint orthogonal contrasts (FDR-adjusted P-value < .05) within orthogonal contrasts comparing combination of amphetamine treatments (A = amphetamine, S = saline) and overactivity line (C = control, O = overactive).

Abbreviations: DAVID, Database for Annotation, Visualization and Integrated Discovery; FAT, Functional Annotation Tool; FDR, false discovery rate.
Contrast: AC-SC = orthogonal contrast between amphetamine-treated control and saline-treated control mice; AO-SO = orthogonal contrast between amphetamine-treated overactive and saline-treated overactive mice; SC-SO = orthogonal contrasts between saline-treated overactive and saline-treated control mice.
Number of genes in enriched category.
FDR-adjusted P-value.
Enriched categories detected by the DAVID analysis of individual contrasts and shared with the joint contrast analysis included “behavior” (BP GO:0007610), “learning or memory” (BP GO:0007611), and “ion transport” (BP GO:0043270). The detection of categories enriched in a singular contrast offered insights into mechanisms uniquely disrupted by amphetamine within lines. For example, the GO MF term “neuropeptide hormone activity” was enriched in AC-SC but did not reach enrichment level in the AO-SO contrast. This result is consistent with reports of neuropeptide hormone gene dysregulation in response to amphetamine in wild-type lines. 62 Conversely, the term “synaptic signaling” (BP GO:0099536) and “heparin binding” (MF GO:0008201) were enriched in the AO-SO contrast but did not reach enrichment level in the AC-SC contrast. The synaptic signaling finding was consistent with reports that amphetamine treatment disrupts synaptic signaling in individuals with ADHD symptoms 81 and the heparin binding finding is in agreement with the established increase in heparin sulfate associated with cocaine and methamphetamine exposure. 85
The incorporation of information on the gene standardized fold change within contrast in the enrichment analysis using GSEA enhanced the precision to detect categories among the genes presenting over- or under-expressed gene patterns within each contrast. Results from the GSEA study of category enrichment (FDR-adjusted P-value < .1) discriminated between the over- and under-expressed genes in the AC-SC and AO-SO contrasts are listed in Supplemental File Table D. The categories consistently detected by the GSEA and DAVID analyses of differentially abundant genes (FDR-adjusted P-value < .05) in the joint and individual contrasts included “synaptic transmission,” “cell adhesion,” “neurotransmitter receptor activity,” “learning,” “heparin-related activity,” “calcium ion transport,” and “memory.” The enrichment of the KEGG pathway heparin sulfate biosynthesis among the genes over-expressed in the AC relative to the SC group detected by GSEA is consistent with reports that stimulants such as cocaine and methamphetamine increase heparin sulfate content and sulfation in the mouse hypothalamus, and that heparin sulfate participates on the regulation of cocaine seeking and taking. 85
A category detected by GSEA within contrast profile that was not detected by DAVID was the KEGG “ribosome pathway” (Supplemental File Table D). This category was enriched among the genes under-expressed in the AC relative to the SC group and over-expressed in the AO relative to the SO group. The ribosome pathway was also enriched among the genes differentially abundant in the brain between mice null for Adgrl3, a gene associated with addiction and ADHD and control. 12 The observed under-expression in the AC relative to the SC group was consistent with reports that amphetamine inhibits protein synthesis by disrupting the formation of the mRNA ribosome complex and synthesis initiation. 86 Also, the pattern of the genes annotated to the term ribosome was in agreement with the potentiation of amphetamine-induced locomotion by the ribosome inactivating protein Saporin treatment. 87
Another notable finding from the GSEA was the enrichment of the GO BP term “regulation of alpha amino 3 hydroxy 5 methyl 4 isoxazole propionate selective glutamate (AMPA) receptor activity” among the genes over-expressed in the AC relative to the SC group (Supplemental File Table D). This result is consistent with the finding that modifications of AMPA receptor in the nucleus accumbens support amphetamine-induced locomotion. Our study of the pathways and processes impacted across and within orthogonal contrast helped us with the identification of mechanisms that are predominantly and concurrently disrupted in association with amphetamine and overactivity. These findings support the discovery of pathways that can help understand and benefit from the effects of psychostimulants in consideration of the activity levels of the individuals.
Gene expression changes associated with mouse line
In addition to the identification of A treatment effect within line, line effects independent of A treatment were studied. Overall, 239 genes were differentially expressed between lines (FDR-adjusted P-value < .05) while not presenting a significant joint treatment-line contrast effect. Table 4 lists the most differentially expressed genes between lines (FDR-adjusted P-value < .05 and |log2(fold change)| > 1.2) and the complete list of 239 genes is presented in Supplemental File Table E.
Top genes differentially expressed (FDR-adjusted P-value < .05) and |log2(fold change)| > 1.2) between the control (C) and the overactive (O) line (log2(C/O)) excluding genes that exhibited a significant joint treatment-line contrast.

Abbreviation: FDR, false discovery rate.
FDR-adjusted P-value.
Among the genes exhibiting line effects, guanylate binding protein 1 (Gbp1) was over-expressed in the O relative to the C line (Table 4) and this gene is associated with the cellular response to interferon beta. This profile is consistent with reports that the treatments with cytokines Interferon Gamma and Alpha decreased the physical activity in mice. 88 Interleukin 1 Alpha (Il1a) was under-expressed in the O relative to the C line and this profile is in agreement with the identification of a mutation in this gene that is characterized high risk for Tourette syndrome and the common comorbidity of ADHD. 89 Ninjurin 2 (Ninj2) was over-expressed in the O relative to the C line and differential Ninj2 methylation has been reported in children exhibiting ADHD symptoms. 90
Protein phosphatase 1, regulatory (inhibitor) subunit 2 (Ppp1r2) was under-expressed in the O relative to the C line (Table 4). In agreement with our findings, Ppp1r2 was enriched in GABAergic neurons 91 that are inhibited in ADHD models 92 and Ppp1r2 treatment has been associated with memory suppression in rats. 93 Purinergic receptor P2X, ligand-gated ion channel, 1 (P2rx1) is another gene associated with memory and learning that was under-expressed in the O relative to the C line. Our result is in agreement with reports of P2rx1 over-expression in mice presenting improved memory and learning skills. 94
Functional analysis using DAVID uncovered two clusters of categories enriched (ES > 1.5) albeit none of the categories were significant at FDR-adjusted P-value < .05. The clusters included categories associated with the BP terms “regulation of cellular component biogenesis” (GO:0044087) and “actin filament organization” (GO:0007015). Our finding supports reports of a link between dysregulation of actin cytoskeleton processes and ADHD.48,95 Our study of differential gene expression across lines uncovered profiles that are not affected by the amphetamine treatment studied.
Gene expression changes associated with amphetamine exposure across lines
Gene expression profiles affected by amphetamine exposure independent of line were also identified. Among the 183 genes exhibiting significant amphetamine treatment effect (FDR-adjusted P-value < .05) across line, two genes did not present significant joint contrast test: potassium inwardly rectifying channel, subfamily J, member 6 (Kcnj6), and retinoic acid-related (RAR)-related orphan receptor alpha (Rora). Our results on these two genes are in agreement with independent studies of psychostimulants and locomotor functions.
Kcnj6 was over-expressed in the A relative to the S treatment (log2(fold change A/S) = 0.37, FDR-adjusted P-value < .038). Kcnj6 plays a role in the Oxy signaling pathway, morphine addiction pathway, potassium ion transport, neurotransmitter, and in dopaminergic and GABAergic synapses. Mutations on a Girk channel subunit Girk2 were associated with analgesic requirements and the therapeutic use of Girk channel inhibitors to ameliorate methamphetamine dependence has been proposed. 96 Rora was over-expressed in the A relative to the S treatment [log2(fold change A/S) = 0.32, FDR-adjusted P-value < .034] confirming the effects that amphetamine elicits on Rora expression. Rora participates in the amphetamine metabolism, 97 angiogenesis, learning, and positive regulation of circadian rhythm. 98 Mutations in Rora have been associated with impaired in motor functions and motor coordination. 99
Conclusions
The present study advances the understanding of the impact of amphetamine exposure within a mouse line that exhibits behaviors treatable by this psychostimulant. The characterization of amphetamine effects across lines and of line effects granted a comprehensive understanding of gene dysregulation. Genes over-expressed in the A relative to the S treatment in O mice and under-expressed in the C mice included Gm13202, Rpph1, Shox2, Trpm6, and Tnfrsf9. Genes exhibiting the opposite pattern included Amd2 and Gstp2. The RNA and protein coded these genes have been associated with amphetamine treatment or with knockout and selection line models of ADHD and related disorders. The literature review included in this report supports a high number of differentially expressed genes detected in this study. Many of these genes have been reported in connection to treatments of behavioral disorders presenting overactivity comorbidity and in connection to opioid exposure. Limited sample resources available prevented us to further validate the profiles using alternative quantitative RNA technologies. The agreement between our results and prior findings supports the capacity of the experimental design used to detect replicable transcriptome changes.
Enriched categories among the genes that exhibited differential amphetamine effects across lines include the GO BP terms “forebrain development,” “synaptic transmission,” “neurogenesis and neuronal development,” “ion transport,” “peptide hormone secretion,” “memory and learning,” “response to stimuli including hormones,” and “regulation of sensory perception.” The gene network analysis further the understanding of the mode of action of amphetamines. This analysis uncovered modules of genes that presented distinct response to amphetamine exposure. The sub-networks of Nrgn, Rims1, Ndn, Ahi1, Ngfr, Hap1, and Fhl2 highlighted the distinct impact of amphetamine on genes annotated to calcium channel activity, synaptic signaling, and neurogenesis across mouse lines.
The study of a single dose of amphetamine enabled us to profile the direct effects of this drug on the transcriptome.19,20 Alternative exposure paradigms can offer complementary understanding of the additional effects of this psychostimulant including chronic exposure and neuroadaptations associated with tolerance and sensitization,19,20 self-administration of amphetamine, withdrawal scenarios, and relapse conditions. Similarly, the present study of RNA extracted from ventral and dorsal striatum can be complemented with separate profiling of different cell types (e.g. microglia, astrocytes, neurons) within striatum region. This targeted strategy can offer insights into cell type- and region-specific impact of amphetamine within and across mouse lines.
Further studies of differences in the transcriptome profiles between sexes and across time points after exposure can identify further sex- and time-dependent transcript associations with amphetamine within mouse line. Also, studies of additional biomedical models of phenotypes treated with amphetamine including knockout lines could offer complementary understanding of the molecular mechanisms impacted by amphetamine. The gene networks depicting amphetamine effects particular to each line highlight the need to consider the genetic background associated with overactivity, impulsivity, and related disorders in the development of therapies that capitalize on the positive effects of this psychostimulant while controlling for the unfavorable effects.
Supplemental Material
amph_manuscript_suppl_oct1118_xyz10853ea34b6e9 – Supplemental material for Interplay Between Amphetamine and Activity Level in Gene Networks of the Mouse Striatum
Supplemental material, amph_manuscript_suppl_oct1118_xyz10853ea34b6e9 for Interplay Between Amphetamine and Activity Level in Gene Networks of the Mouse Striatum by Tassia M Goncalves, Bruce R Southey and Sandra L Rodriguez-Zas in Bioinformatics and Biology Insights
Footnotes
Declaration of conflicting interests:
The author(s) declared no potential conflicts of interest with respect to the research, authorship, and/or publication of this article.
Funding:
The author(s) disclosed receipt of the following financial support for the research, authorship, and/or publication of this article: The support of NIH grant numbers P30 018310, R21 MH 096030, R21 DA 027548 and of USDA NIFA grant numbers ILLU-538-632 and ILLU-538-909 are greatly appreciated.
Author Contributions
SLRZ secured the funding and materials and conceptualized the data analysis. TMG analyzed the data and obtained the network figures. BRS organized and managed the sequence and experimental data and metadata files and coordinated data availability. All three authors were contributed the writing of the manuscript and revisions.
Supplemental Material
Supplemental material for this article is available online.
References
Supplementary Material
Please find the following supplemental material available below.
For Open Access articles published under a Creative Commons License, all supplemental material carries the same license as the article it is associated with.
For non-Open Access articles published, all supplemental material carries a non-exclusive license, and permission requests for re-use of supplemental material or any part of supplemental material shall be sent directly to the copyright owner as specified in the copyright notice associated with the article.