
Abstract
The human striatum is functionally organized into limbic, associative, and sensorimotor subdivisions, which process information related to emotional, cognitive, and motor function. Dopamine projections ascending from the midbrain provide important modulatory input to these striatal subregions. The aim of this study was to compare activation of dopamine D2 receptors after amphetamine administration in the functional subdivisions of the human striatum. D2 receptor availability (V3″) was measured with positron emission tomography and [11C]raclopride in 14 healthy volunteers under control conditions and after the intravenous administration of amphetamine (0.3 mg/kg). For each condition, [11C]raclopride was administered as a priming bolus followed by constant infusion, and measurements of D2 receptor availability were obtained under sustained binding equilibrium conditions. Amphetamine induced a significantly larger reduction in D2 receptor availability (ΔV3″) in limbic (ventral striatum, −15.3 ± 11.8%) and sensorimotor (postcommissural putamen, −16.1 ± 9.6%) regions compared with associative regions (caudate and precommissural putamen, −8.1 ± 7.2%). Results of this region-of-interest analysis were confirmed by a voxel-based analysis. Correction for the partial volume effect showed even greater differences in ΔV3″ between limbic (−17.8 ± 13.8%), sensorimotor (−16.6 ± 9.9%), and associative regions (−7.5 ± 7.5%). The increase in euphoria reported by subjects after amphetamine was associated with larger ΔV3″ in the limbic and sensorimotor regions, but not in the associative regions. These results show significant differences in the dopamine response to amphetamine between the functional subdivisions of the human striatum. The mechanisms potentially accounting for these regional differences in amphetamine-induced dopamine release within the striatum remain to be elucidated, but may be related to the asymmetrical feed-forward influences mediating the integration of limbic, cognitive, and sensorimotor striatal function via dopamine cell territories in the ventral midbrain.
Over the last decade, several groups have shown that imaging striatal dopamine D2 receptors with positron emission tomography (PET) or single-photon emission computerized tomography (SPECT) in humans can be applied to measure acute changes in the concentration of synaptic dopamine (for review, see Laruelle, 2000). For example, the administration of psychostimulants such as amphetamine or methylphenidate is associated with an acute reduction in the binding potential (BP) of the radiotracers [11C]raclopride or [123I]IBZM (Volkow et al., 1994; Laruelle et al., 1995; Breier et al., 1997). In nonhuman primates, the magnitude of this reduction is related to the amphetamine-induced increase in extracellular dopamine measured with microdialysis (Breier et al., 1997; Laruelle et al., 1997). Therefore, the decrease in [11C]raclopride BP can be used as a noninvasive measure of the change in dopamine induced by the challenge. Binding competition between the endogenous transmitter and the radioligand is believed to be the critical mechanism underlying this interaction, although other phenomena, such as receptor internalization or polymerization, have also been implicated (Laruelle, 2000; Logan et al., 2001).
This imaging paradigm has been applied to study striatal dopamine transmission in health and disease. In healthy subjects, two findings have emerged from studies relating dopamine transmission and the subjective effects of psychostimulants. Laruelle et al. (1995) reported that the increase in euphoria produced by acute amphetamine administration was related to the decrease in striatal [123I]IBZM BP induced by the challenge, suggesting that stimulation of striatal D2 receptors mediates the euphorigenic effects of amphetamine. This observation was confirmed by Volkow et al. (1999b), using methylphenidate. In addition, Volkow et al. (1999a) observed that low D2 receptor availability at baseline (before the challenge) was predictive of the positive effects of methylphenidate. In pathologic conditions, this challenge has been used as a probe of presynaptic dopamine function. Psychostimulant-induced dopamine release has been reported to be increased in untreated patients with schizophrenia and Tourette syndrome (Laruelle et al., 1996; Breier et al., 1997; Singer et al., 2002), normal in patients with mood disorders (Anand et al., 2000; Parsey et al., 2001), and blunted in chronic cocaine abusers (Volkow et al., 1997).
A limitation of the aforementioned studies is that dopamine transmission was measured at the level of the striatum as a whole. The striatum, however, is a heterogeneous structure that includes several anatomic and functional subdivisions. Cortico-striatal-thalamo-cortical loops provide a general framework for defining the functional subdivisions of the striatum based on their connections. The general scheme of these loops involves projections from the cortex to the striatum, to the internal segment of the globus pallidum (GPi) or the substantia nigra (SN), to the thalamus and back to the cortex. These loops have been functionally classified into limbic loops (medial prefrontal, orbitofrontal, and anterior cingulate cortex—ventral striatum–ventral pallidum/SN–mediodorsal thalamic nuclei–cortex), associative loops (associative areas of the cortex including dorsolateral prefrontal cortex—precommissural putamen and most of the caudate–GPi/SN –ventral anterior thalamic nuclei–cortex) and sensorimotor loops (primary motor and premotor cortex, and supplementary motor area—postcommissural putamen–GPi/SN–ventral anterior thalamic nuclei–cortex) (for review see Joel and Weiner, 2000). This framework can be used to subdivide the striatum into the ventral or limbic striatum (VST), involved in drive and motivation, the central or associative striatum (AST), involved in cognition, and the sensorimotor striatum (SMST), involved in locomotion.
Recent advances in PET camera resolution allow the measurement of dopamine transmission parameters in the substructures of the striatum (Drevets et al., 2001; Mawlawi et al., 2001). This article is part of a series of studies aimed at evaluating the feasibility and validity of measuring parameters of dopamine transmission in striatal substructures using PET in humans. In a previous study, we established the reliability of measuring D2 receptor availability in striatal subregions, using a bolus–plus–constant-infusion paradigm with [11C]raclopride and the high resolution ECAT EXACT HR+ scanner (Siemens/CTI, Knoxville, TN, U.S.A.) (Mawlawi et al., 2001). In this study, we used the same imaging technique to evaluate amphetamine-induced changes in [11C]raclopride binding to D2 receptors in the functional subdivisions of the human striatum.
MATERIALS AND METHODS
General design
The study was approved by the Institutional Review Boards of the Columbia Presbyterian Medical Center and the New York State Psychiatric Institute. Sixteen healthy control subjects participated in this study. All subjects underwent magnetic resonance imaging (MRI) and two scans with [11C]raclopride: a baseline scan and a scan after amphetamine administration (0.3 mg/kg intravenously). One subject was unable to complete the amphetamine scan owing to nausea, and another subject was unable to complete the MRI. Therefore, we report on 14 subjects (aged 33 ± 7 y; 9 men, 5 women). Subjects were scanned in succession, and all complete experiments were included in the final data set (28 PET scans). All but one pair of PET studies were performed on the same day, with a minimal interval of 2 h between injections of [11C]raclopride. For technical reasons, one subject underwent the baseline and postamphetamine scans at an 18-d interval.
Subjects
Inclusion criteria were the absence of past or present neurologic, medical, or psychiatric illnesses (including alcohol and drug abuse) and pregnancy. Clinical status was assessed by history, review of systems, physical examination, routine blood tests, urine toxicology and ECG. Subjects provided written informed consent.
Radiochemistry
[11C]Raclopride was prepared as previously described (Mawlawi et al., 2001). The precursor for the preparation of [11C]raclopride,
Positron emission tomography experiments
[11C]Raclopride was administered as a priming bolus followed by constant infusion for 90 minutes, as previously described (Mawlawi et al., 2001). The bolus to infusion ratio was 105 minutes (i.e., 53% of the dose was given in the bolus). This ratio was selected based on the optimization procedure published by Watabe et al. (2000). [11C]Raclopride was delivered in a 60-mL saline solution. A bolus dose of 30 mL was administered for a period of 3 minutes using an IMED pump (PC-1; Gemini, San Diego, CA, U.S.A.). After the bolus, the pump was reset to deliver 26 mL at 0.28 cc/min for the remaining 90 minutes.
Positron emission tomography imaging was performed with the ECAT EXACT HR+ (Siemens/CTI) operated in the three-dimensional (3D) mode. This camera acquires 63 slices covering an axial field of view of 15.5 cm (axial sampling of 2.46 mm). The 3D mode in plane and axial resolutions are 4.4 and 4.1 mm full-width half-maximum (FWHM) at the center of the field of view, respectively. A 10-minute transmission scan was obtained before radiotracer injection. Emission data were collected in the 3D mode for 90 minutes as 24 successive frames of increasing duration (3 × 20 seconds, 2 × 1 minute, 2 × 2 minutes, 1 × 3 minutes, 16 × 5 minutes).
Four venous samples (collected at 40, 50, 60, and 70 minutes) were obtained and analyzed for plasma [11C]raclopride concentration as previously described (Mawlawi et al., 2001). Parent compound plasma concentrations in these four samples were averaged to obtain [11C]raclopride concentration at steady state (CSS, μCi mL–1). Clearance (L · h−1) was calculated as the rate of infusion/CSS and plasma free fraction (f1) was measured by ultrafiltration as previously described (Mawlawi et al., 2001).
After the baseline scan, subjects were allowed to rest outside of the camera. After repositioning the subject in the camera, amphetamine (0.3 mg/kg) was given intravenously for 30 seconds. The second [11C]raclopride administration was initiated 2 minutes after the amphetamine injection, with experimental parameters identical to the baseline scan. Subjects were under constant cardiovascular monitoring after the amphetamine challenge.
A venous sample was obtained at 40 minutes to measure amphetamine plasma levels. Amphetamine was quantitated as its
Subjective response
The subjective response to amphetamine was evaluated using a simplified version of the Amphetamine Interview Rating Scale (Laruelle et al., 1995). Four items (euphoria, energy, restlessness, and anxiety) were rated on a scale of 1 (not at all) to 10 (most ever) at baseline (10 minutes before amphetamine) and after the administration of amphetamine (at 0, 5, 10, 20, 30, and 40 minutes). The area under the curve (AUC) of the change from baseline (AAUC) for each of these items was used as the outcome measure for comparison with PET data.
Magnetic resonance imaging acquisition
The MRI scans were acquired on a GE 1.5 T Signa Advantage system (GE Medical Systems, Waukesha, WI, U.S.A.). A sagittal scout was initially performed to identify the plane of the anterior commissure (AC) and posterior commissure (PC). A transaxial T1-weighted sequence with 1.5-mm slice thickness was then acquired in the coronal plane orthogonal to the AC–PC plane over the whole brain. The following parameters were used: 3D spoiled-gradient recalled-acquisition in the steady-state; repetition time, 34 ms; echo time, 5 ms; flip angle, 45°; slice thickness, 1.5 mm and zero gap; 124 slices; field of vision, 22 × 16 cm; width, 256 × 192 matrix, reformatted to 256 × 256, yielding a voxel size of 1.5 mm × 0.9 mm × 0.9 mm.
Image coregistration
Images were reconstructed with attenuation correction using the transmission data and a Shepp 0.5 filter (cutoff 0.5 cycles/projection rays). Image processing was performed with MEDx (Sensor Systems, Sterling, VA, U.S.A.) as previously described (Mawlawi et al., 2001). Briefly, correction for PET frame misalignment due to head movement and PET to MRI registration were performed using the within- and between-modality automatic image registration algorithms (Woods et al., 1992, 1993). Because noise introduces errors in automatic image registration processing (Woods et al., 1992), PET frames were first denoised using a level 2, order 5 Battle-Lemarie wavelet (Mawlawi et al., 2001). The denoised PET frame acquired from 40 to 45 minutes was chosen as the reference frame and was registered to the MRI. The transformation matrix (TM1) was saved. In 5 of 28 studies, the
Regions of interest
The striatum was divided into five anatomic regions of interest (ROIs) and three functional subdivisions (see Table 1 and Fig. 1).
Functional and anatomic subdivisions
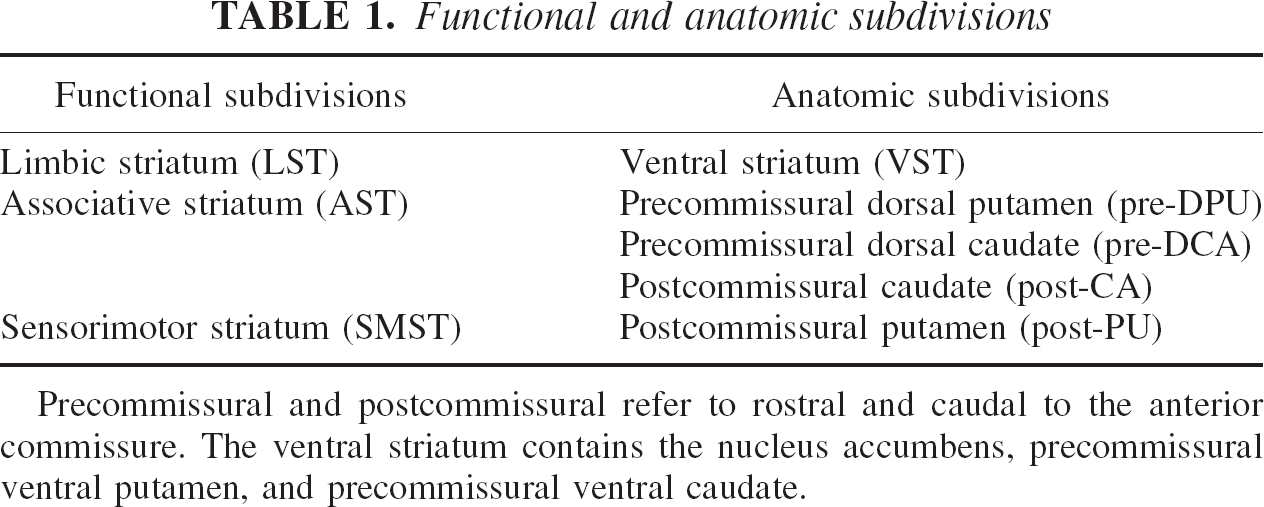
Precommissural and postcommissural refer to rostral and caudal to the anterior commissure. The ventral striatum contains the nucleus accumbens, precommissural ventral putamen, and precommissural ventral caudate.
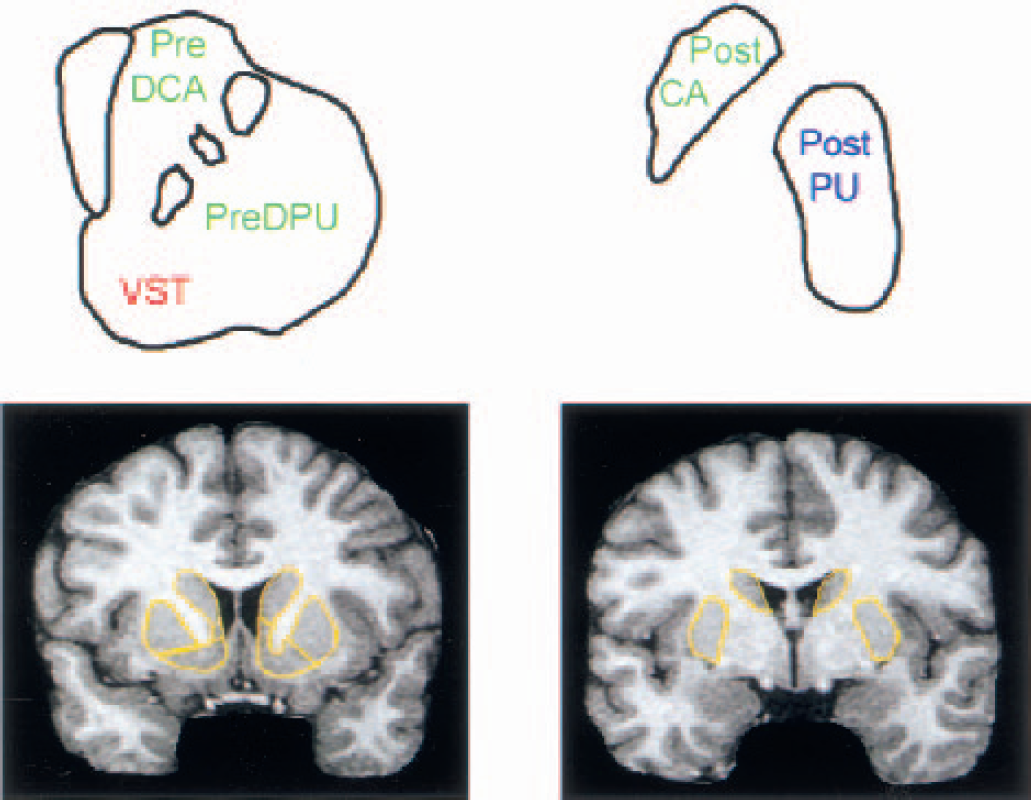
Striatal subregions.
Derivation of outcome measures
D2 receptor availability was estimated with the specific-to-nonspecific equilibrium partition coefficient (V3″). Two analytical techniques were used to derive V3″: an equilibrium analysis (Laruelle et al., 1994) and a simplified reference tissue kinetic model (SRTM) (Lammertsma and Hume, 1996). [11C]Raclopride has a similar affinity for D2 and D3 receptors (Sokoloff et al., 1990), and, unless otherwise specified, we use the term D2 receptors to denote both D2 and D3 receptors.
Equilibrium analysis was applied to the PET frames obtained from 40 to 90 minutes. The degree of equilibrium obtained during this time frame was assessed by measuring the change of the activity in the ROI over time. The slope of the ROI activity over time was expressed as a percentage of the mean value obtained from 40 to 90 minutes. The activity (μCi/mL) in the ROIs was averaged from 40 to 90 minutes. The nondisplaceable distribution volume (including free and nonspecifically bound radiotracer), V2, was derived as the ratio of the activity in the cerebellum measured during the 40- to 90-minute period (ACER) to CSS. Specific binding was defined as the difference in activity in the ROI (AROI) and ACER. V3″ was then calculated as the ratio of specific to nonspecific binding (Laruelle et al., 1994):

The SRTM analysis was implemented as previously described (Mawlawi et al., 2001) and applied to the entire data set (0–90 minutes).
In both analyses, the reduction in D2 receptor availability after amphetamine (ΔV3″) was expressed in terms of the relative reduction in V3″:
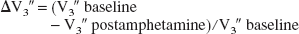
The relation between V3″ and receptor parameters is described by V3″ = f2Bmax/KD, where f2 is the free fraction in nondisplaceable distribution volume, Bmax is the number of available binding sites, and KD is the [11C]raclopride equilibrium dissociation constant. The relation between f2 and f1 is given by the inverse of the nondisplaceable distribution volume (f2 = f1/V2).
Voxel-wise analysis
Voxel-based analysis was performed using Statistical Parametric Mapping 99 (SPM; Wellcome Department of Cognitive Neurology, University College London, U.K.). A mean PET image at equilibrium was created by averaging the MRI coregistered PET frames acquired during the equilibrium interval (40–90 minutes). Maps of V3″ were created by applying Eq. 1 to all brain voxels of the mean PET images, using the value of ACER derived from the ROI analysis. Maps of ΔV3″ were then created by applying Eq. 2 to the baseline and postamphetamine V3″ maps. Each subject's MRI was normalized to the SPM T1-template image using SPM software, and the same transformation was applied to V3″ PET maps. Smoothing with an isotropic Gaussian filter (FWHM = 4 mm), corresponding to twice the voxel size (normalized voxels are 2 × 2 × 2 mm3) was applied to conform to the SPM Gaussian field requirements. The significance of the amphetamine effect was assessed with a voxel-wise paired
Partial volume effects correction
Partial volume effects (PVE) correction analysis was performed using a modification of the method of Rousset et al. (1998) as previously described (Mawlawi et al., 2001). Briefly, binary images were generated for each ROI from each subject's MRI, such that voxels contained within the ROI were set to 1 and all other voxels were set to 0 (n = 11 images per scan for the right and left VST, pre-DCA, pre-DPU, post-CA, post-PU and background). The binary images were then realigned to the location of the original PET images within the field of view, since the resolution of the PET camera varies within the field of view. These images were then smoothed using a model of the point-spread function of the camera, creating 11 blurred image sets with voxel values between 1 and 0. The geometric transfer matrix (GTM), which describes the contribution of each source region to the measured regional activity, was generated. The true activity in each ROI was calculated by multiplying the vector of the regional measured activity by the inverse of the GTM. In this analysis, a “realistic” resolution model was applied, which takes into account the resolution of the PET camera, the reconstruction filter (Shepp 0.5), and subject movement during the scan (Mawlawi et al., 2001). This resolution model has a FWHM at the center of the field of view of 5.1 mm. Partial volume effects corrected V3″ was calculated by applying Eq. 1 to PVE-corrected ROI activities, and PVE corrected ΔV3″ was calculated by applying Eq. 2 to PVE corrected V3″.
Statistical analysis
Statistical analysis was performed with repeated measures ANOVA with condition (baseline and postamphetamine) as repeated factor (unless otherwise specified).
RESULTS
Scan parameters
Injected dose was 13.4 ± 3.8 mCi for the baseline scan and 10.9 ± 4.0 mCi for the postamphetamine scan (decay corrected for the time of infusion,
Plasma analysis
The concentration of parent compound ([11C]raclopride) was constant throughout the 40- to 90-minute period under both conditions, with an average change of −9 ± 23%/h for the baseline scan and 6 ± 27%/h after amphetamine (
Cerebellum volume of distribution
The volume of distribution of the cerebellum (V2) was 0.34 ± 0.08 mL g−1 at baseline and 0.34 ± 0.08 mL h−1 after amphetamine (
Region-of-interest volumes
The ROI volumes, as well as their contribution the total striatal volume, are listed in Table 2. The AST was the largest subdivision (contributing to 62 ± 3% of the whole striatum) followed by the SMST (27 ±3%) and the LST (12 ± 4%).
Regional volumes
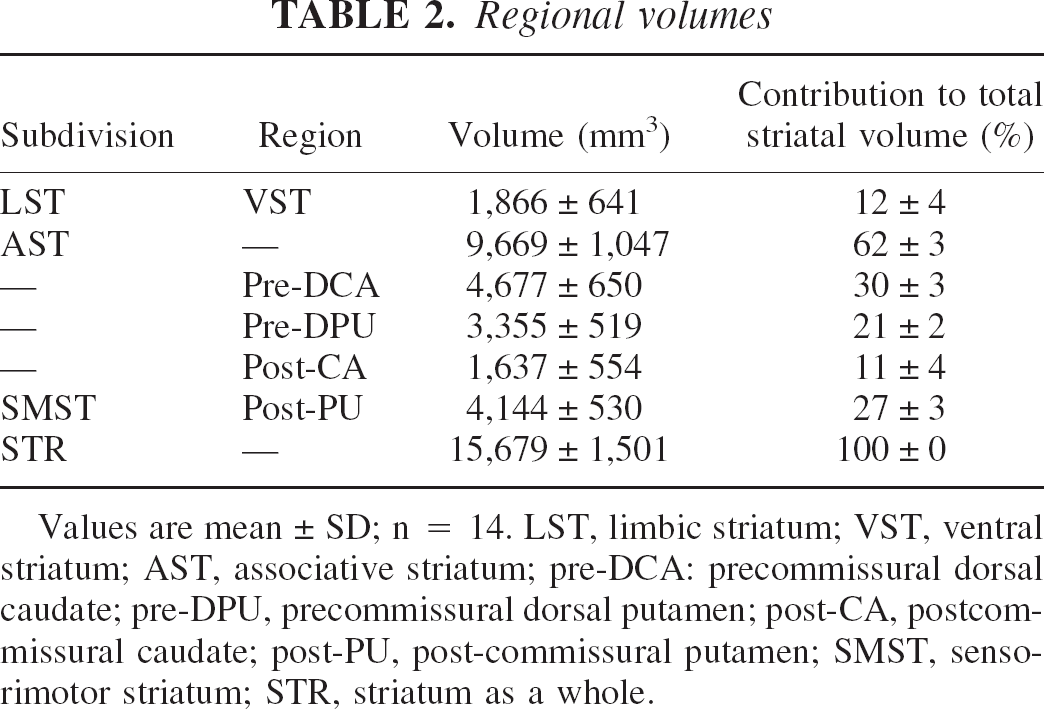
Values are mean ± SD; n = 14. LST, limbic striatum; VST, ventral striatum; AST, associative striatum; pre-DCA: precommissural dorsal caudate; pre-DPU, precommissural dorsal putamen; post-CA, postcommissural caudate; post-PU, post-commissural putamen; SMST, sensorimotor striatum; STR, striatum as a whole.
Quality of equilibrium state
Activity in all ROIs decreased during the 40- to 90-minute interval as follows: −2.7 ± 11.6%/h (baseline) and −3.0 ± 12.5%/h (amphetamine condition) in the cerebellum; −4.9 ± 15.8%/h (baseline) and −8.4 ± 19.7%/h (amphetamine) in the VST; −11.9 ± 11.0%/h (baseline) and −11.4 ± 13.5%/h (amphetamine) for the pre-DCA; −7.2 ± 10.9%/h (baseline) and −9.7 ± 12.3%/h (amphetamine) in the pre-DPU; −11.8 ± 11.5%/h (baseline) and −13.4 ± 18.7%/h (amphetamine) for the post-CA; −11.0 ± 9.3%/h (baseline) and −10.4 ± 16.2%/h (amphetamine) in the post-PU. The decrease for each condition was significantly different from zero for all regions except for the cerebellum and VST (both baseline and amphetamine conditions). No significant differences in the slopes were observed between the baseline and amphetamine condition in any region.
Region-of-interest analysis
Figure 2 illustrates the time–activity curves of [11C]raclopride during the bolus–plus–constant-infusion experiments obtained under control conditions and after injection of amphetamine in the same subject. Figure 3 shows the PET images of [11C]raclopride distribution at baseline and after amphetamine in the same subject.
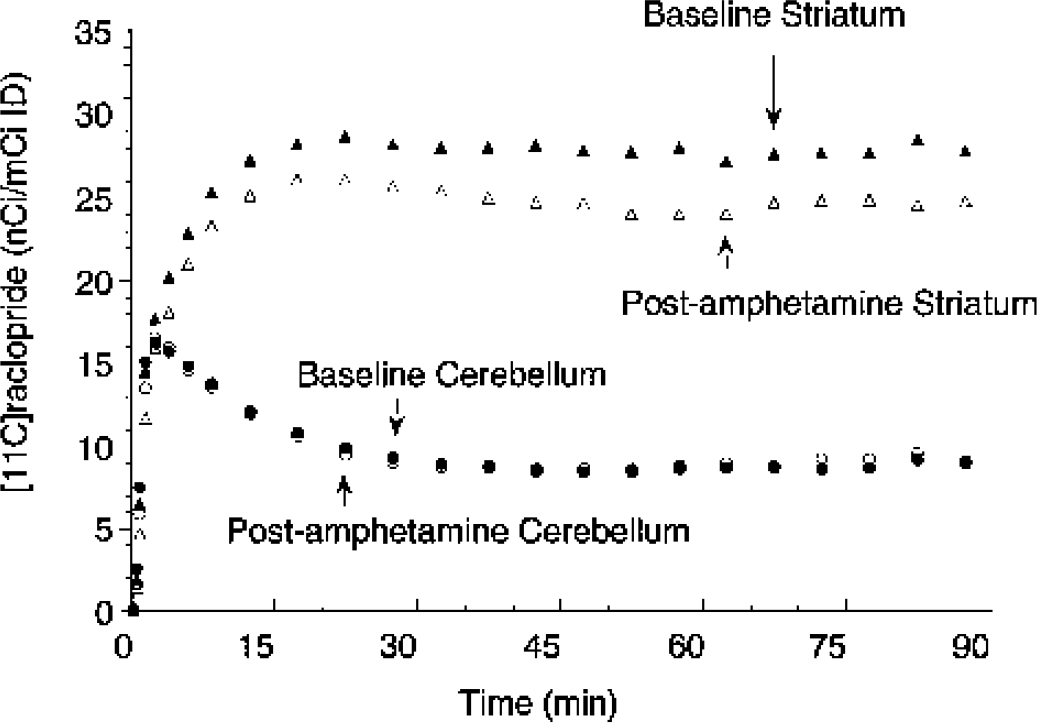
Activity in the striatum (triangles) and cerebellum (circles) during bolus plus constant infusion of [11C]raclopride at baseline (closed symbols) and after administration of amphetamine (0.3 mg/kg, open symbols). Amphetamine administration induced significant decrease in striatal activity but no change in cerebellum activity. Equilibrium measurements were obtained during the 40- to 90-minute interval.
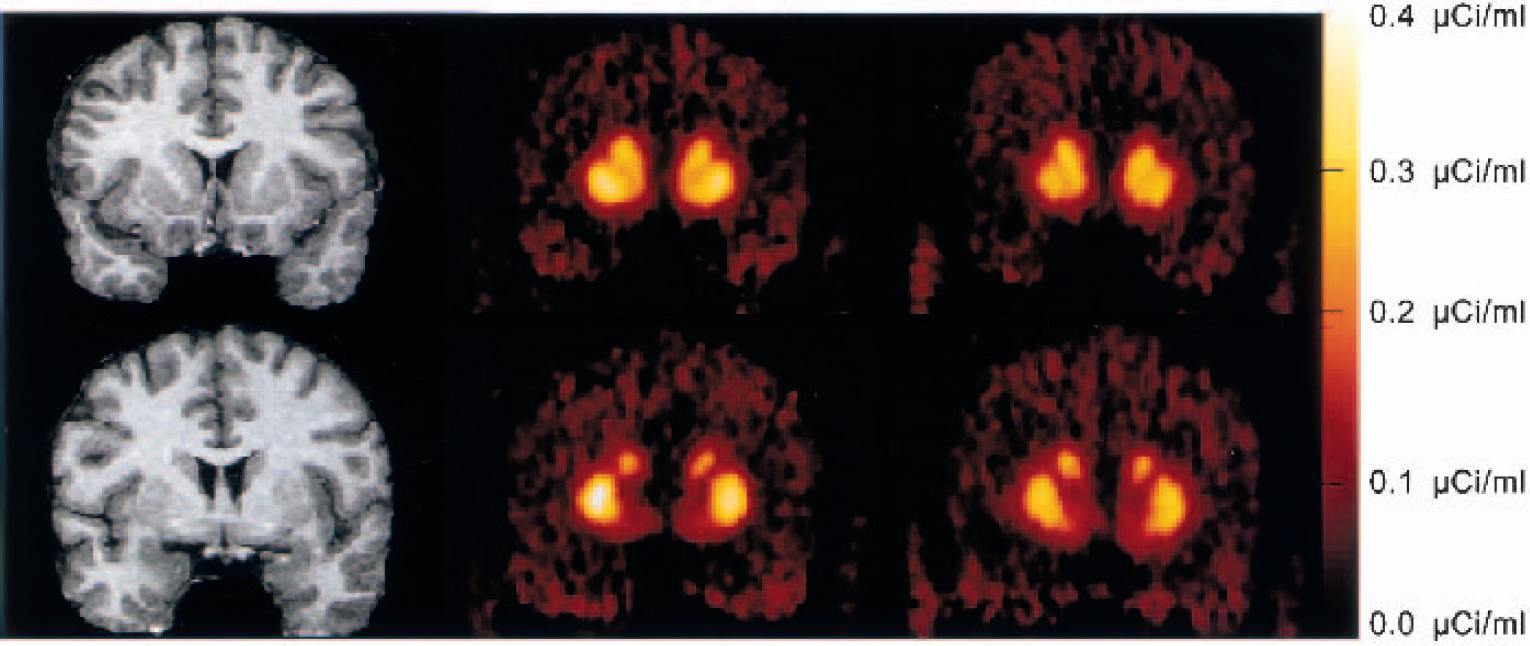
Coregistered magnetic resonance imaging scans and positron emission tomography (PET) [11C]raclopride coronal images (
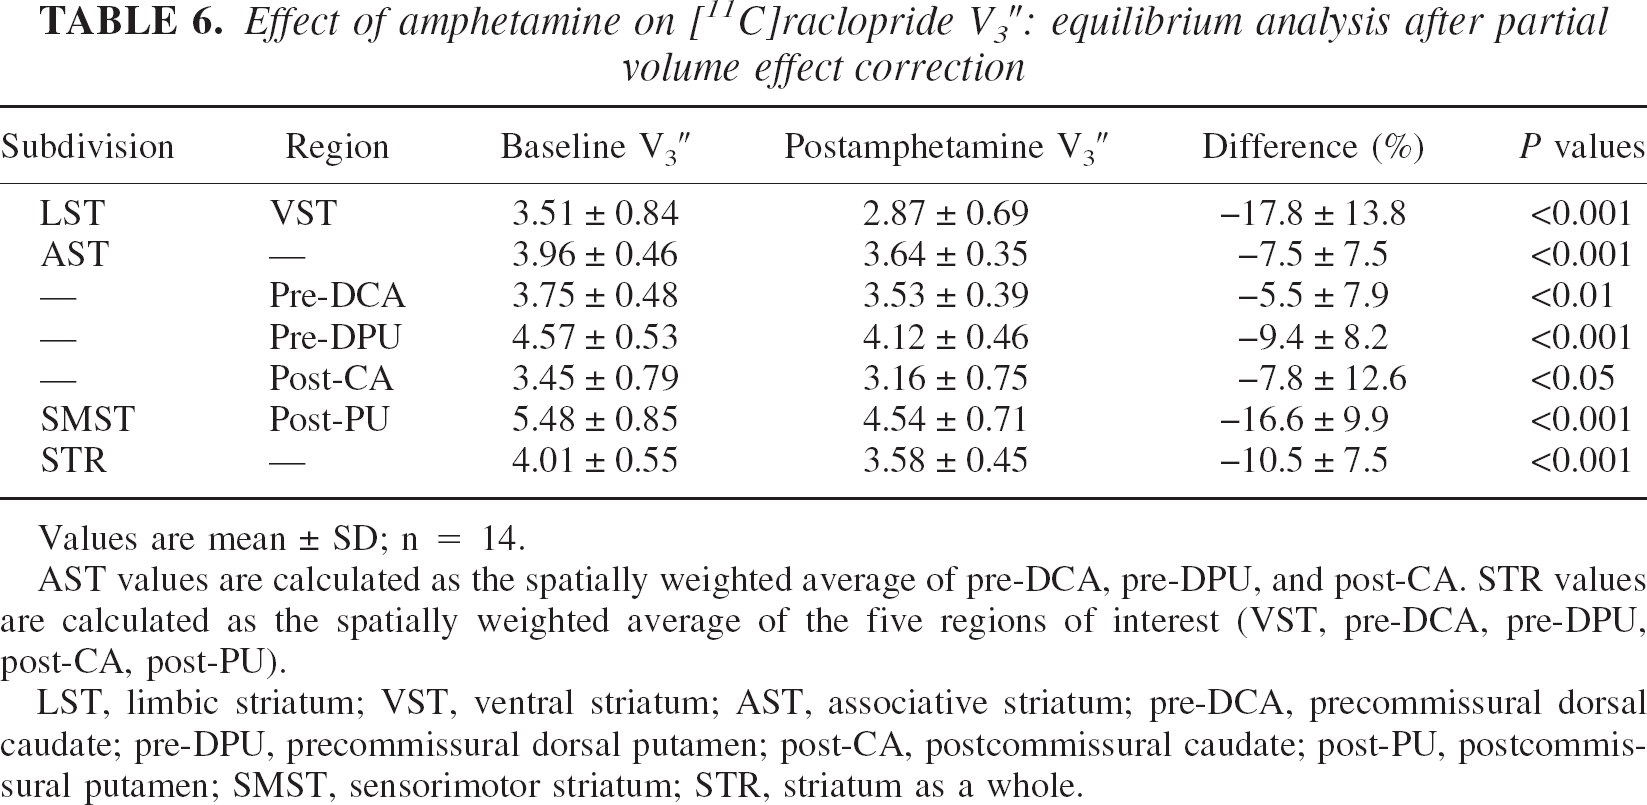
Effect of amphetamine on [11C]raclopride V3″: equilibrium analysis
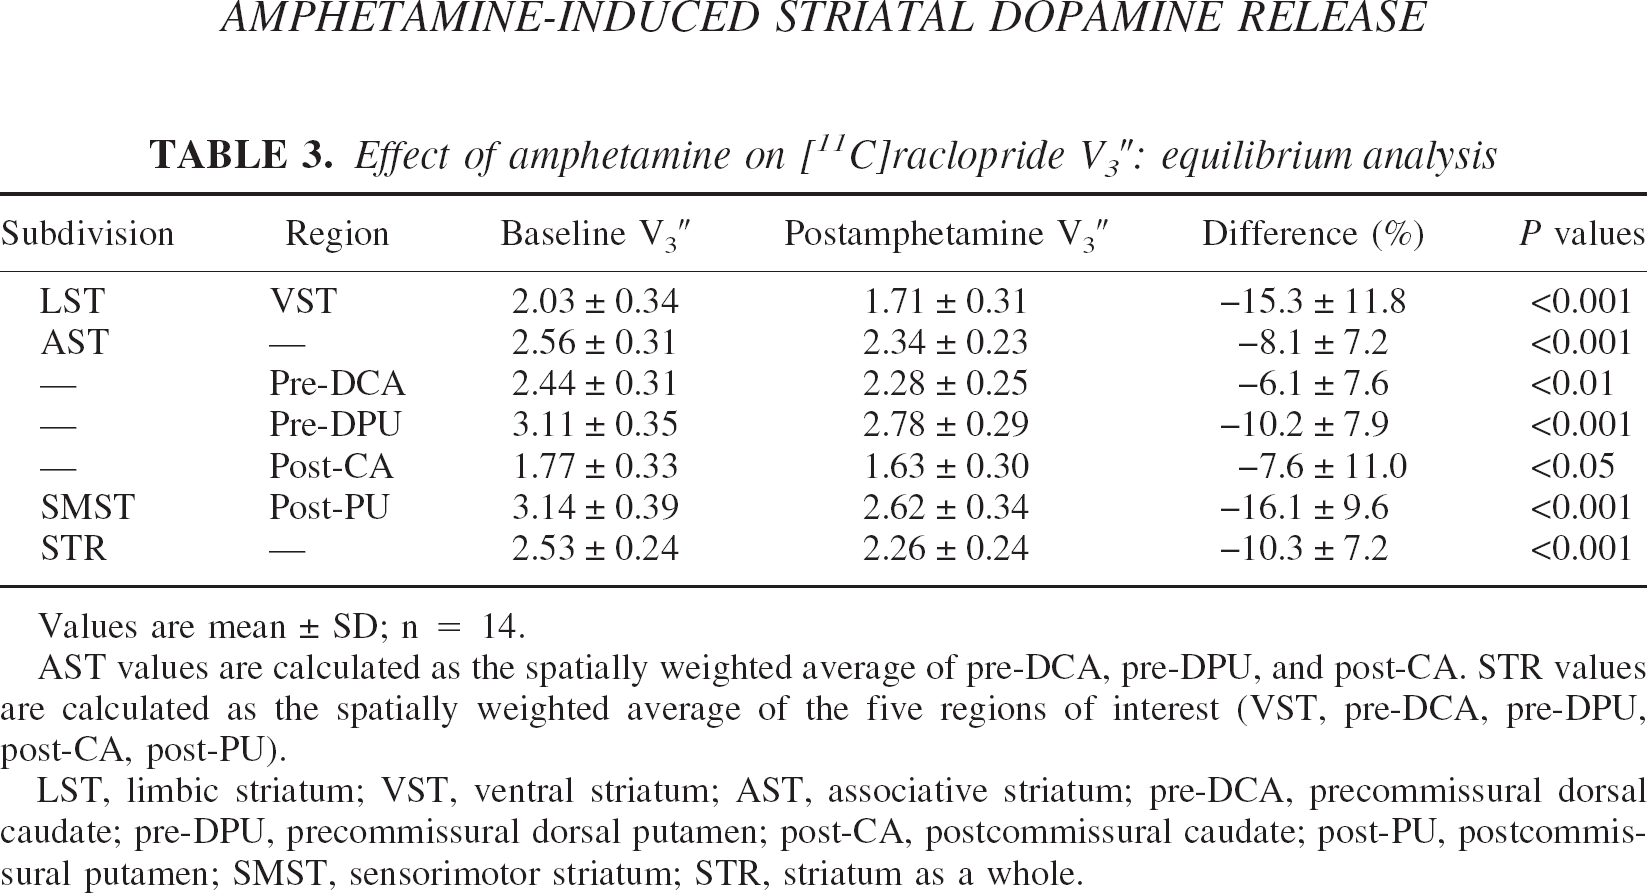
Values are mean ± SD; n = 14.
AST values are calculated as the spatially weighted average of pre-DCA, pre-DPU, and post-CA. STR values are calculated as the spatially weighted average of the five regions of interest (VST, pre-DCA, pre-DPU, post-CA, post-PU).
LST, limbic striatum; VST, ventral striatum; AST, associative striatum; pre-DCA, precommissural dorsal caudate; pre-DPU, precommissural dorsal putamen; post-CA, postcommissural caudate; post-PU, postcommissural putamen; SMST, sensorimotor striatum; STR, striatum as a whole.
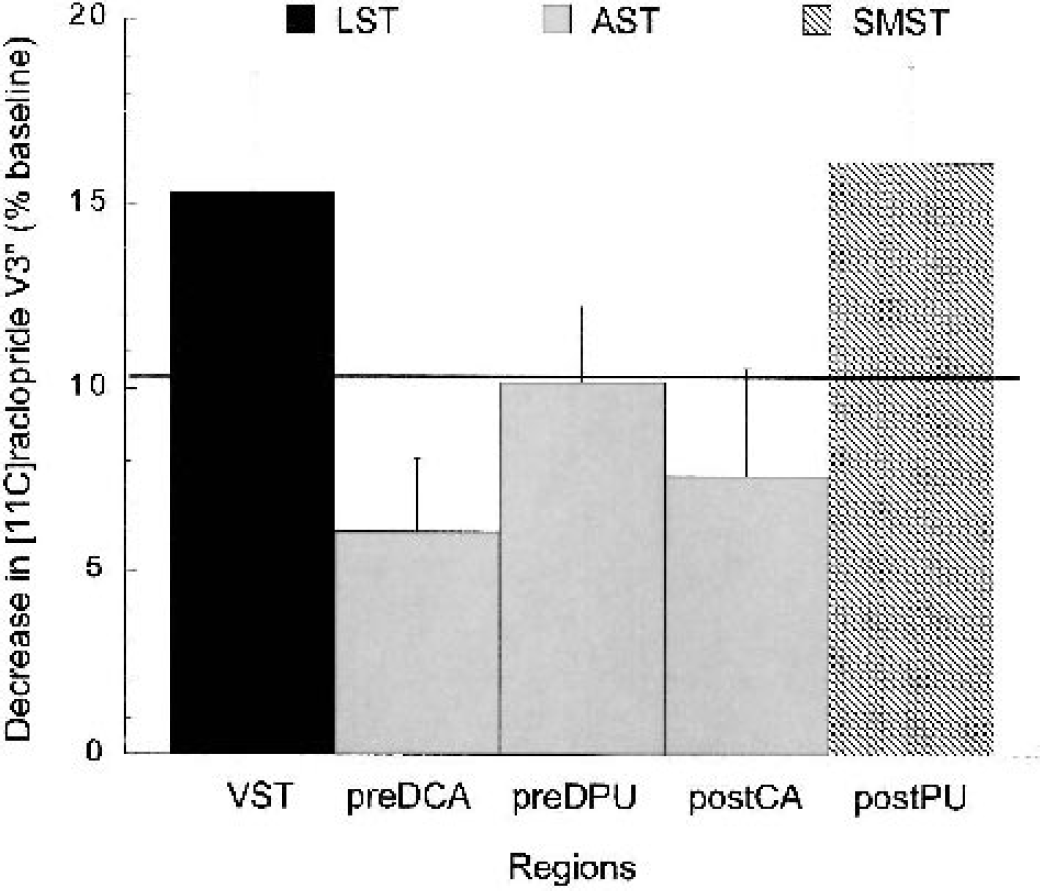
Mean ± SEM decrease in [11C]raclopride D2 receptor availability (V3″) expressed in percentage change from baseline (ΔV3″) in five subregions of the striatum in 14 healthy subjects after administration of 0.3 mg/kg amphetamine (equilibrium analysis, uncorrected for partial volume effects). Regions include: VST (ventral striatum), pre-DCA (precommissural dorsal caudate), pre-DPU (precommissural dorsal putamen), post-CA (postcommissural caudate) and post-PU (postcommissural putamen). Bar patterns represent the functional classification of these regions into limbic (black bar), associative (gray bars), and sensorimotor (striped bar) striata. The solid line represents the percent decrease seen in the striatum as a whole. Amphetamine induced significant reduction in [11C]raclopride V3″ in all regions. Significant between-region differences in the amphetamine effect were observed (
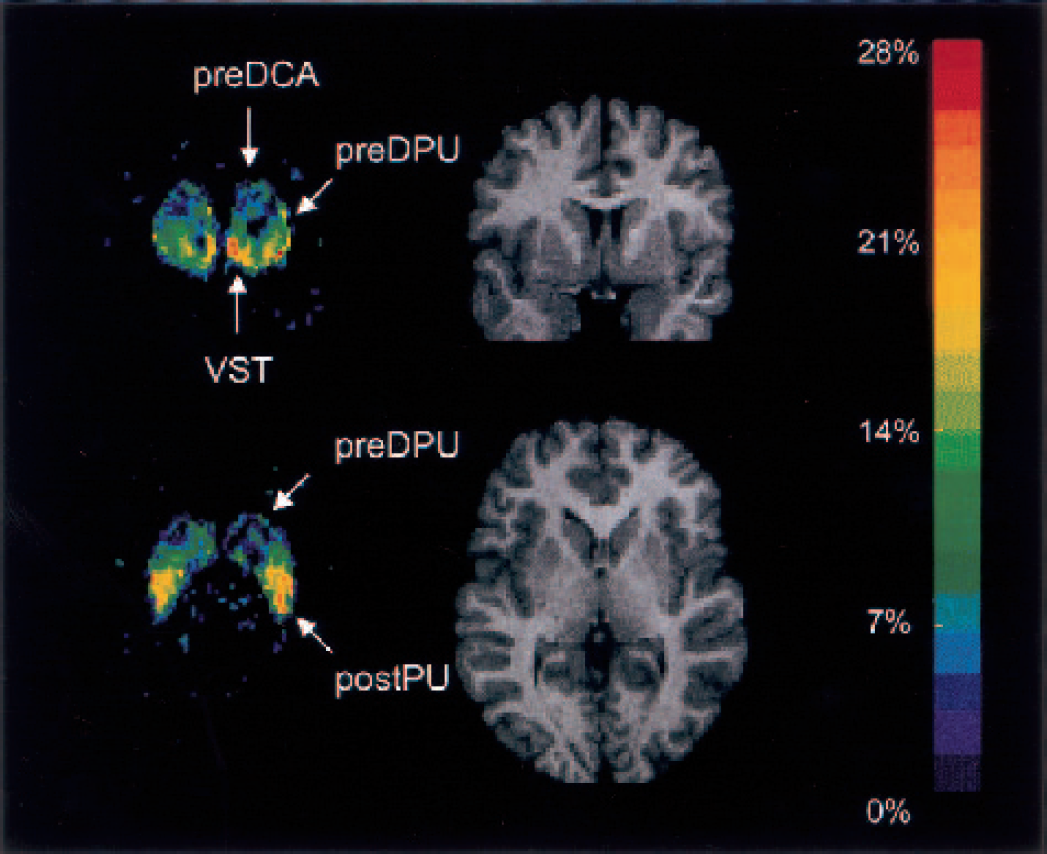
Effect of amphetamine on [11C]raclopride V3″: simplified reference tissue model analysis
Values are mean ± SD; n = 14.
AST values are calculated as the spatially weighted average of pre-DCA, pre-DPU, and post-CA. STR values are calculated as the spatially weighted average of the five regions of interest (VST, pre-DCA, pre-DPU, post-CA, post-PU).
LST, limbic striatum; VST, ventral striatum; AST, associative striatum; pre-DCA, precommissural dorsal caudate; pre-DPU, precommissural dorsal putamen; post-CA, postcommissural caudate; post-PU, postcommissural putamen; SMST, sensorimotor striatum; STR, striatum as a whole.
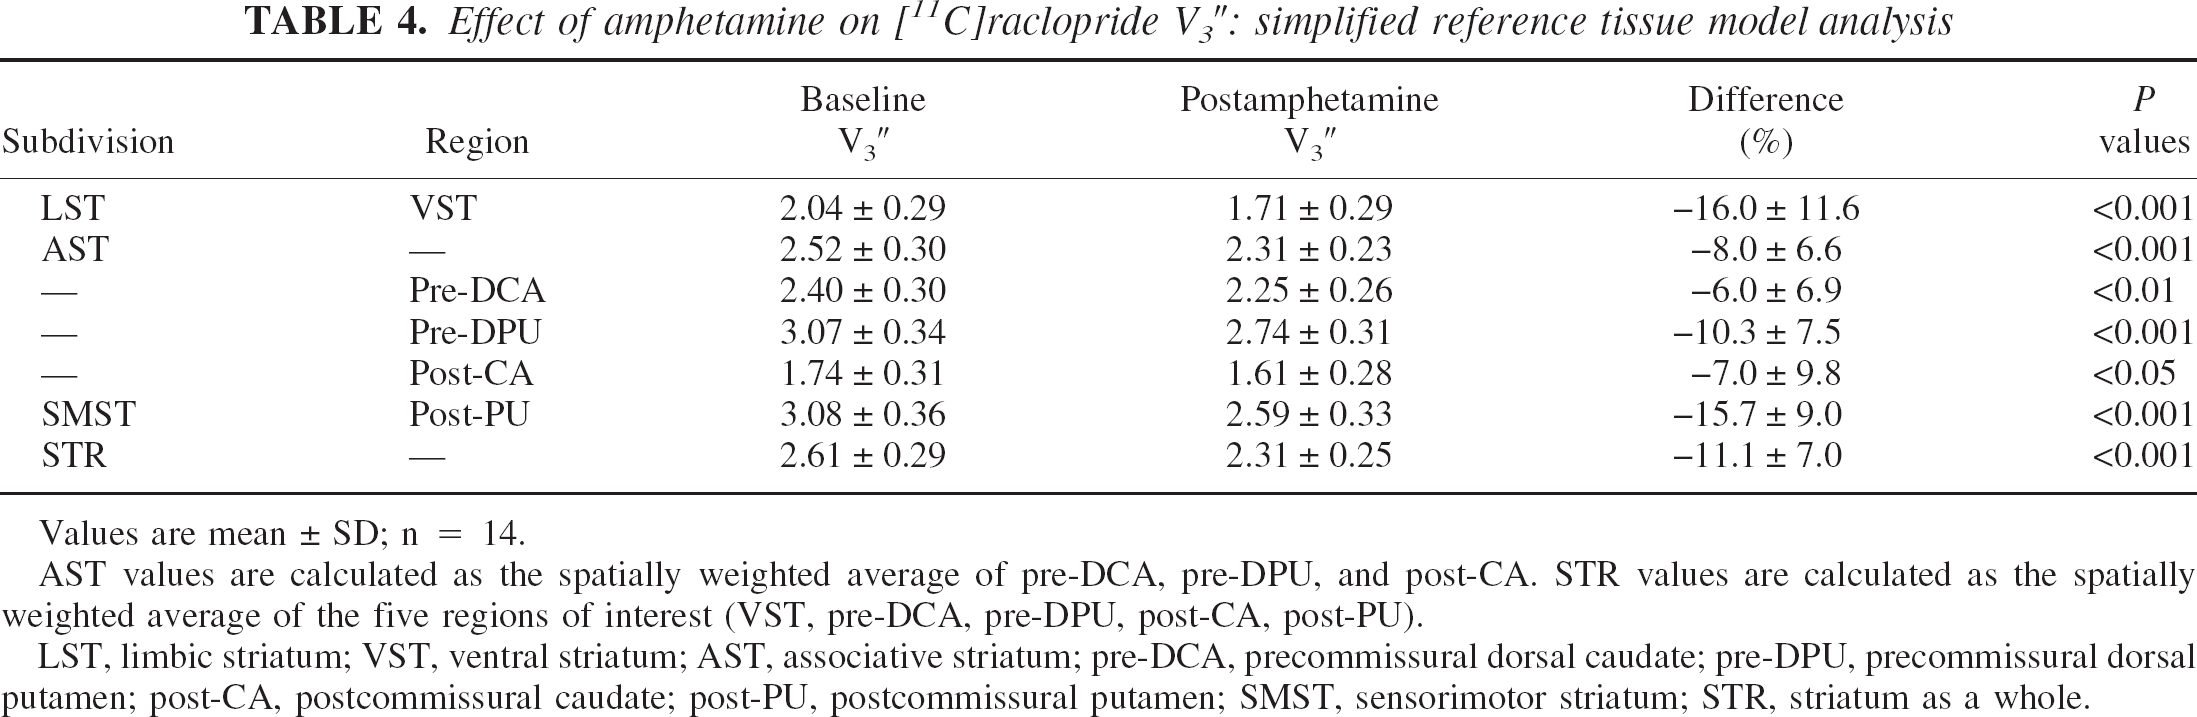
Coronal and transaxial views of the ΔV3″ map normalized to the Montreal Neurological Institute T1-template magnetic resonance imaging (MRI) scan. The images represent the voxel-based average ΔV3″ across subjects. The color scale was coded to represent the percent decrease in V3″ after amphetamine, from dark blue (0%) to red (−28%). For visual clarity, only voxels in which baseline V3″ exceeded 1 are shown. The equivalent planes from one subject's normalized MRI scan are shown for comparison. These views illustrate the two locations of highest amphetamine effect. The coronal plane, at the level of the anterior striatum, shows high displacement in the VST, low displacement in the pre-DCA, and intermediate values in the pre-DPU. The transaxial view illustrates the second area of high displacement in the post-PU, and the rostrocaudal gradient of displacement in the putamen. Pre-DCA, precommissural dorsal caudate; pre-DPU, precommisural dorsal putamen; VST, ventral striatum; post-CA, postcommissural caudate; post-PU, postcommissural putamen.
Figure 6 shows the
Effect of amphetamine on [11C]raclopride V3″: statistical parametric mapping analysis
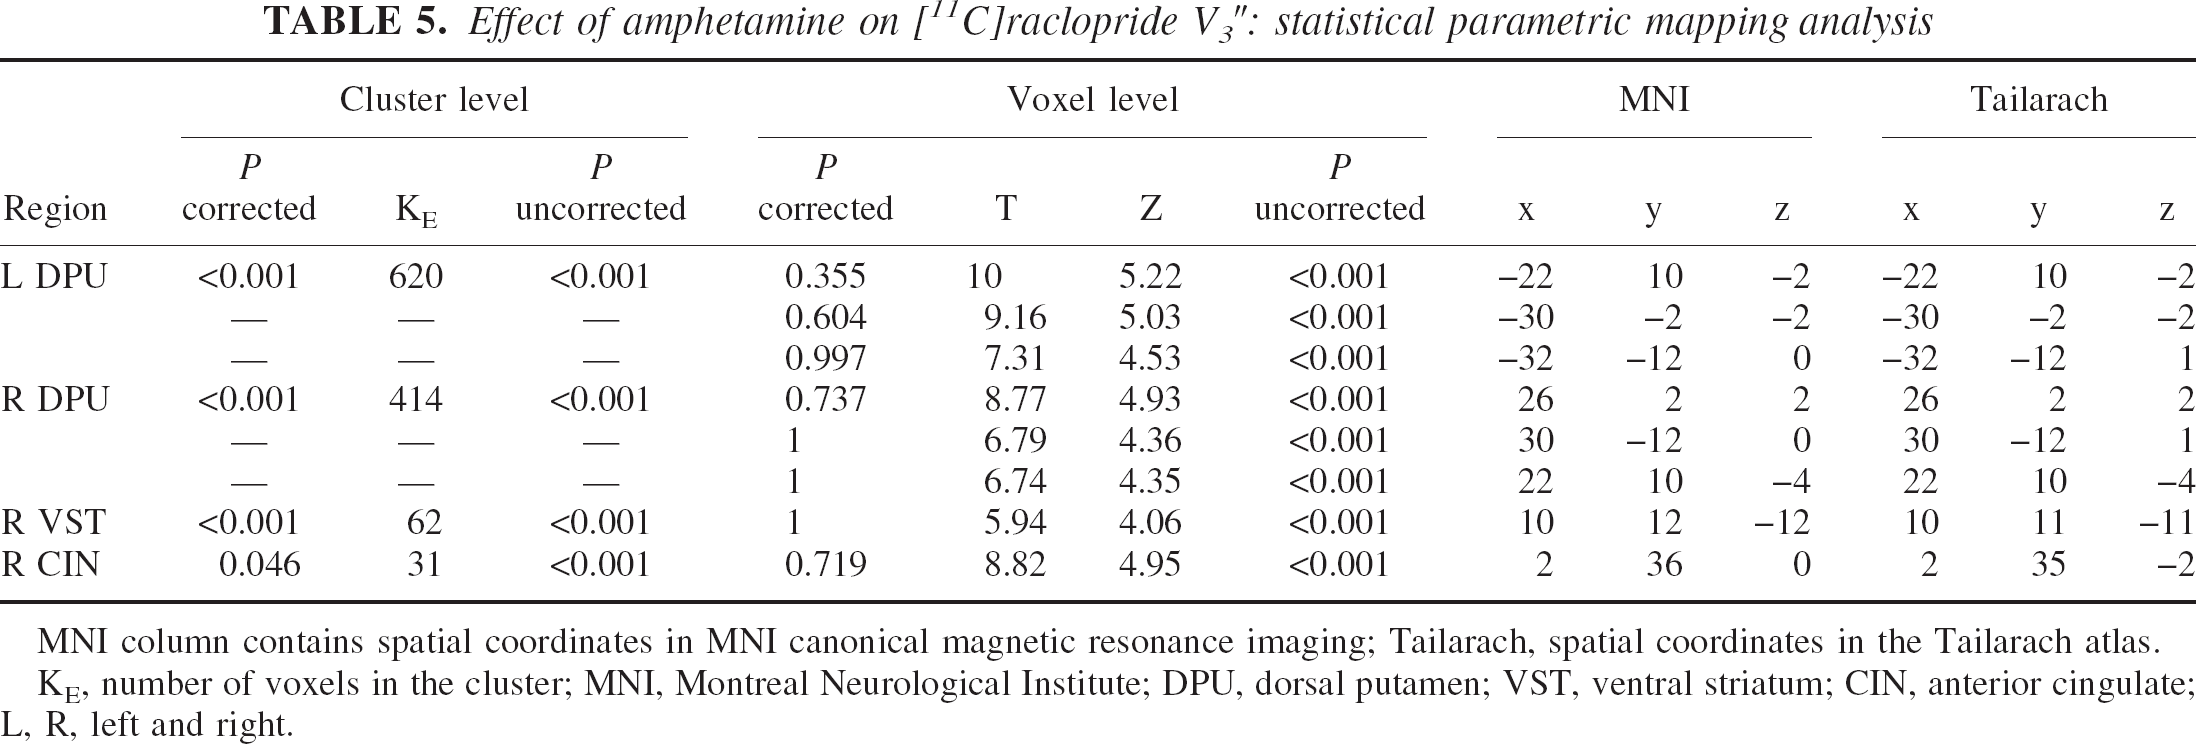
MNI column contains spatial coordinates in MNI canonical magnetic resonance imaging; Tailarach, spatial coordinates in the Tailarach atlas.
KE, number of voxels in the cluster; MNI, Montreal Neurological Institute; DPU, dorsal putamen; VST, ventral striatum; CIN, anterior cingulate; L, R, left and right.
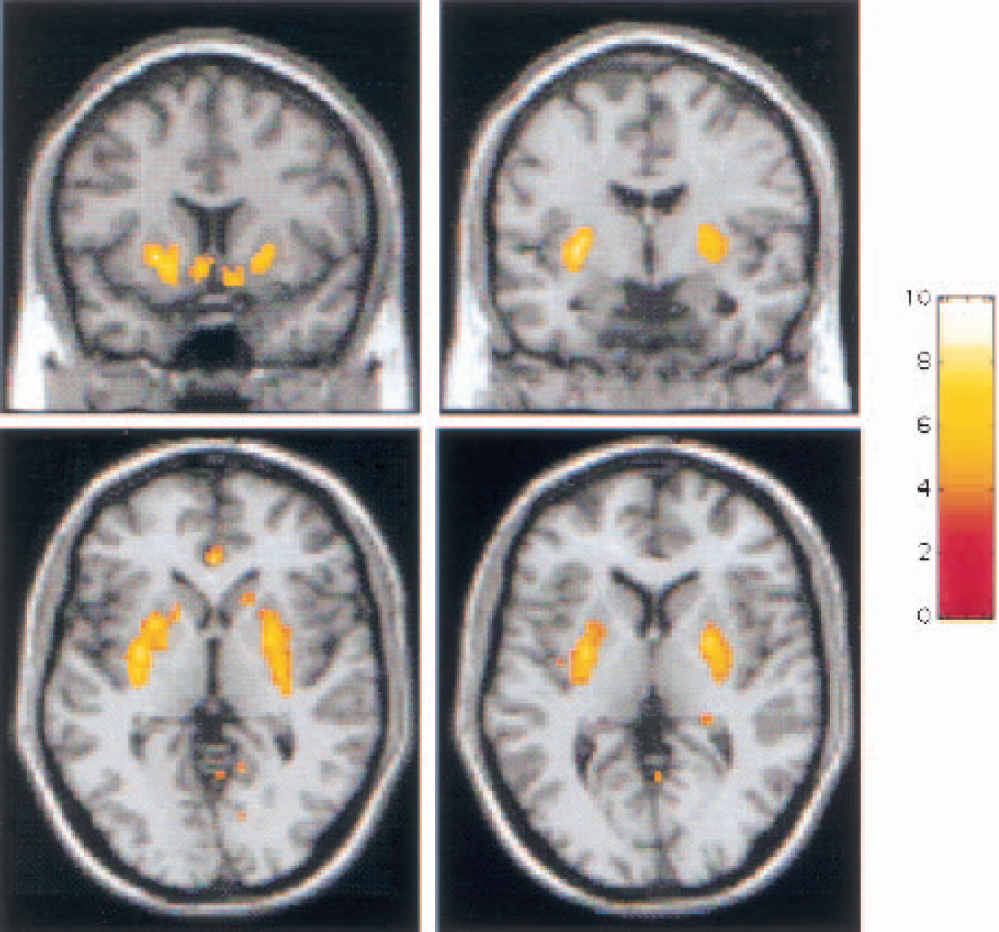
Map of
Partial volume effects correction
Values of V3″ and ΔV3″ after PVE correction are listed in Table 6. Partial volume effects correction resulted in a significant increase in the measured values of V3″ for each ROI (
Effect of amphetamine on [11C]raclopride V3″: equilibrium analysis after partial volume effect correction
Values are mean ± SD; n = 14.
AST values are calculated as the spatially weighted average of pre-DCA, pre-DPU, and post-CA. STR values are calculated as the spatially weighted average of the five regions of interest (VST, pre-DCA, pre-DPU, post-CA, post-PU).
LST, limbic striatum; VST, ventral striatum; AST, associative striatum; pre-DCA, precommissural dorsal caudate; pre-DPU, precommissural dorsal putamen; post-CA, postcommissural caudate; post-PU, postcommissural putamen; SMST, sensorimotor striatum; STR, striatum as a whole.
Partial volume effects correction resulted in small but significant changes in ΔV3″ in the striatal subregions. Partial volume effects correction increased ΔV3″ in regions with high ΔV3″ values (VST and post-PU). In the VST, ΔV3″ increased from −15.3 ± 11.8% to −17.8 ± 13.8% (
The between-region differences in ΔV3″ after PVE correction were similar to the between-region differences seen in ΔV3″ before correction: the VST and pre-DPU were significantly higher than the three other regions (post-CA, post-PU and pre-DCA).
Plasma amphetamine levels
The mean plasma amphetamine level was 40.2 ± 13.6 ng/mL. No significant relationships were observed between amphetamine plasma levels and ΔV3″ in any of the ROIs (VST:
Subjective response
After amphetamine, subjects' ratings of euphoria and energy significantly increased (repeated measures ANOVA with time as repeated factor,
Of the four self-report items, only euphoria was significantly correlated with ΔV3″, such that a greater increase in euphoria was associated with higher [11C]raclopride displacement. This association was observed in the VST and SMST (Fig. 7), as well as at the level of the striatum as a whole (
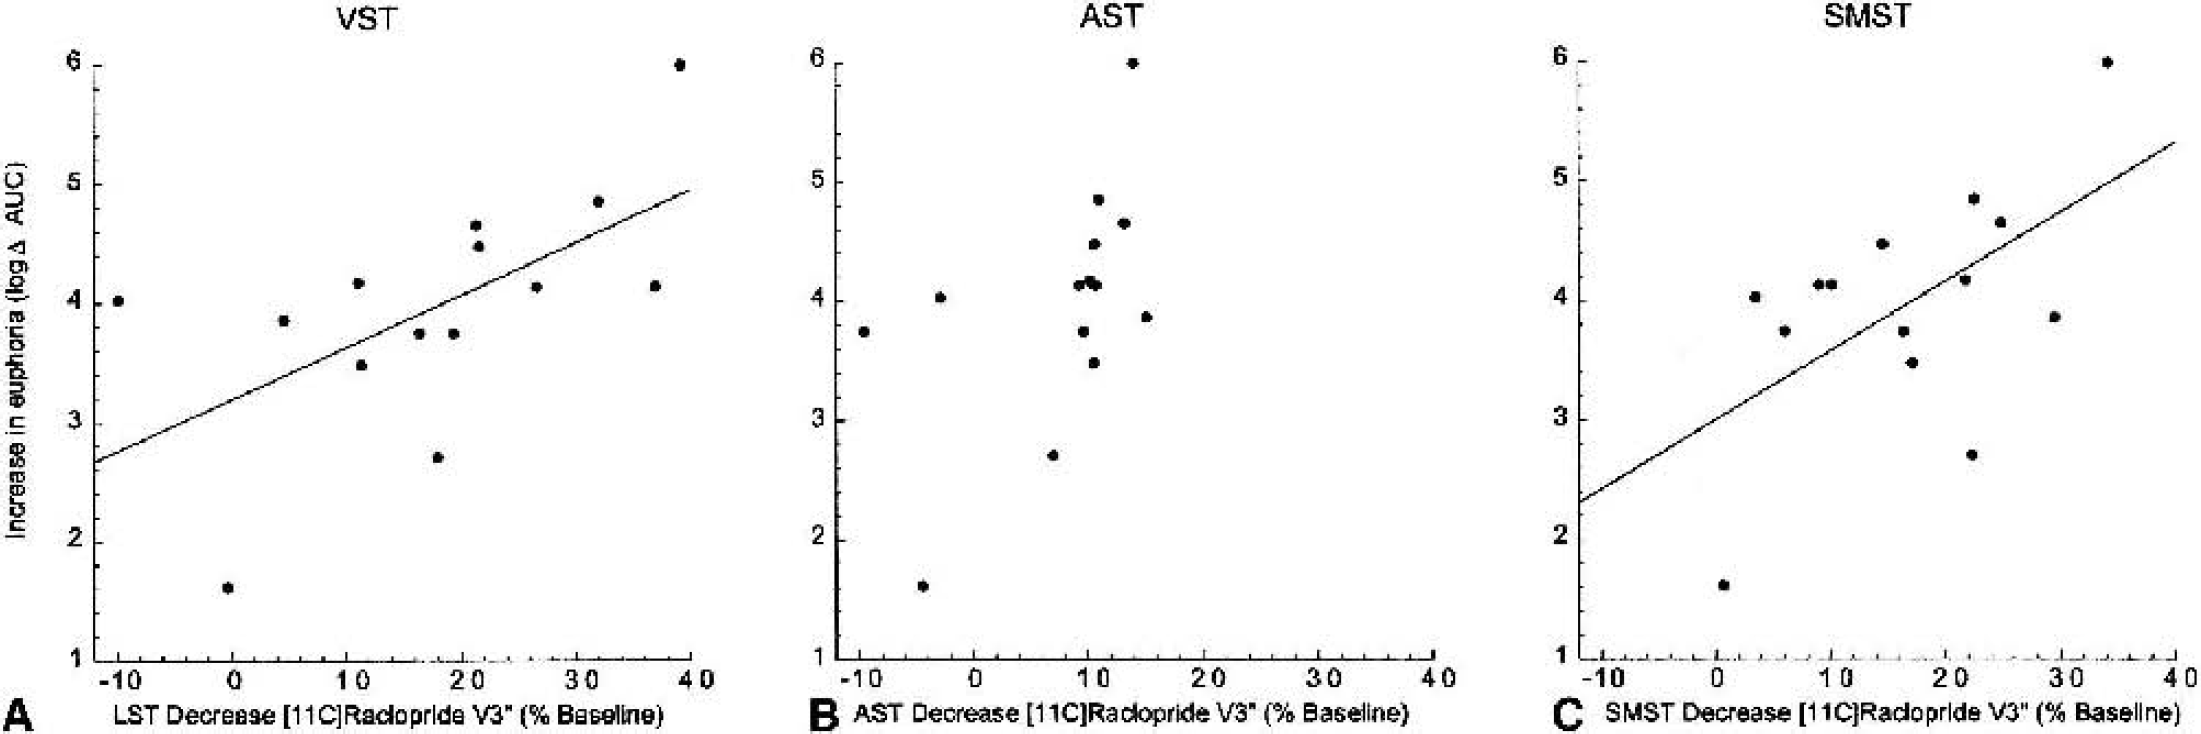
Correlation between subjective report of amphetamine-induced euphoria and decrease in [11C]raclopride V3″ in the limbic striatum (LST;
No association was found between baseline V3″ and amphetamine-induced changes in euphoria in any subregion (VST:
DISCUSSION
The aim of this study was to evaluate amphetamine-induced changes in [11C]raclopride V3″ in the functional subdivisions of the human striatum. Significant differences were observed: the amphetamine effect was higher in the limbic and sensorimotor subdivisions compared with the associative subdivision. These regional differences do not seem to be due to artifacts of the imaging process: the paired-bolus–plus–infusion protocol provided an unbiased estimate of V3″, both ROI and voxelwise analyses showed the same pattern of effect, and the findings were confirmed after PVE correction.
Paired-bolus–plus–infusion protocol
The accurate measurement of changes in D2 receptor availability after a psychostimulant challenge requires a quantitative approach that is not affected by changes in regional CBF or peripheral clearance of the radiotracer induced by the challenge (see discussion in Laruelle, 2000). In this study, we used a new approach to this measurement (paired-bolus–plus–constant-infusion studies), which provides several advantages over previously used methods.
The most frequently used method to evaluate changes in [11C]raclopride V3″ after a challenge is to perform two experiments with a single-bolus [11C]raclopride injection (Volkow et al., 1994, 1997, 1999
A second method to evaluate ΔV3″ after a challenge is to administer the tracer as a bolus followed by a constant infusion and to obtain the baseline and postchallenge measurements over the course of a single study. This method has been used extensively with [123I]IBZM (Laruelle et al., 1995; Abi-Dargham et al., 1998; Kegeles et al., 1999; Anand et al., 2000; Parsey et al., 2001) and [11C]raclopride (Breier et al., 1997; Watabe et al., 2000). The bolus–plus–constant-infusion technique circumvents some of the difficulties associated with the paired single-bolus paradigm (Carson et al., 1993; Laruelle et al., 1995; Mawlawi et al., 2001) as follows: (1) Under sustained equilibrium conditions, there is no net transfer of the radiotracer in and out of the brain, and the uptake is insensitive to changes in regional CBF; (2) The bolus–plus–constant-infusion paradigm allows measurement of distribution volumes without arterial sampling because arterial and venous concentrations of the radiotracer equilibrate; (3) The bolus–plus–constant-infusion method allows more efficient PVE correction because it is applied only once, using the mean measured ROI activity acquired during the equilibrium interval.
Despite these advantages, initial experiments in our laboratory showed that the single-bolus–plus–constant-infusion protocol was problematic for measuring amphetamine-induced changes in [11C]raclopride V3″ in the subregions of the striatum. It takes about 40 minutes of infusion for [11C]raclopride to reach equilibrium (Breier et al., 1997; Watabe et al., 2000; Mawlawi et al., 2001). Assuming the prechallenge measurement is obtained during 10 minutes (40- to 50-minute interval), the earliest time point at which amphetamine can be given is at 50 minutes. It then takes another 20 to 30 minutes for [11C]raclopride to dissociate and reach a new equilibrium, such that the postamphetamine measurement cannot begin until 70 to 80 minutes into the scan. Therefore, the postchallenge measurement must be performed after considerable decay of the isotope. This factor was a concern for the measurement of the striatal subregions, since high counting statistics are needed to preserve resolution.
Therefore, we modified this protocol such that two studies were performed with a bolus plus constant infusion of [11C]raclopride, one at baseline and the second after amphetamine. Like the paired single-bolus protocol, the paired-bolus–plus–constant-infusion protocol provides better and equal counting statistics for the measurement of both pre- and postamphetamine V3″, while maintaining the advantages of this method. This approach takes advantage of the long-lasting effect of amphetamine on D2 receptor availability. Recent experiments performed with [11C]raclopride (Carson et al., 2001) have confirmed the initial observation made with [123I]IBZM that the effect of amphetamine on D2 receptor BP is stable and prolonged (>4 h) (Laruelle et al., 1997). Because the applicability of this methodology rests on the long duration of the amphetamine effect, it should not be used for other challenges without appropriate validation.
A limitation of the bolus-plus-infusion protocol is that an appropriate equilibrium state may not be established in every subject during the
Finally, the use of V3″ as an outcome measure to estimate the effect of amphetamine on D2 receptor availability implies that f2 is unaffected by amphetamine. This assumption was validated in this data set, supporting the use of ΔV3″ to estimate the reduction in Bmax/KD ratio induced by the challenge. Together, these considerations support the robustness of the imaging method used in this study for the quantification of the change in D2 receptor availability after a challenge.
Region-of-interest analysis
The decrease in [11C]raclopride V3″ measured at the level of the whole striatum in this study was −10.3 ± 7.2% (n = 14). Using [123I]IBZM, we previously observed a striatal ΔV3″ of −8.7 ± 7.2% after the same dose of amphetamine in healthy volunteers (n = 43, aged 38 ± 10 y, 36 men and 7 women). This ΔV3″ value was derived from pooling four independent samples studied under identical experimental conditions (Laruelle et al., 1995, 1996; Abi-Dargham et al., 1998; Kegeles et al., 1999) and was not statistically different from ΔV3″ measured with [11C]raclopride in the present study (
The specific aim of this study was to examine the impact of amphetamine on dopamine transmission in the limbic, associative, and sensorimotor subdivisions of the striatum. Analysis of the PET data showed that amphetamine induced a significantly larger reduction in D2 receptor availability in the limbic (−15.3 ± 11.8%) and sensorimotor (−16.1 ± 9.6%) regions compared with the associative regions (−8.1 ± 7.2%) of the striatum.
In a previous study of 7 healthy volunteers, Drevets et al. (2001) also studied the effect of amphetamine in striatal subregions. That study was performed with the same radiotracer, the same dose of intravenous amphetamine, and the same camera as the present study, although a different protocol (paired single-bolus studies), a different analytical approach (SRTM), and different striatal subregions were used. Although the criteria used to delineate the VST and pre-DCA differed between the two studies, both sets of criteria are expected to identify similar regions. Ventral striatum ΔV3″ measured in this study (−15.3 ± 11.8%) was in close agreement with VST ΔV3″ reported by Drevets et al. (2001) (−15.4 ± 10.6%). The pre-DCA ΔV3″ measured here (−6.1 ± 7.6%) was also consistent with that reported in the dorsal caudate (−4.5 ± 8.2%) by Drevets et al. (2001).
Comparison of results within the putamen are more difficult because the main difference between the subregions in the present study and those of Drevets et al. (2001) is the method used to subdivide the putamen. In the present study, the plane of the AC was used to divide the putamen into its associative (precommissural) and sensorimotor (postcommissural) compartments along its rostrocaudal axis. A significant difference was found between these compartments: pre-DPU ΔV3″ (−10.2 ± 7.9%) was significantly lower than post-PU ΔV3″ (−16.1 ± 9.6%,
To improve the comparability between the studies, we reanalyzed our data using the regional criteria provided for the dorsal and ventral putamen in the study by Drevets et al. (2001). Using these criteria, we measured a ΔV3″ of −11.5 ± 10.3% and −15.2 ± 9.8% in the dorsal and ventral putamen, respectively, which are consistent with the decreases reported by Drevets et al. (2001). The difference between dorsal and ventral putamen ΔV3″ was not significant (
Voxel-based analysis
Voxel-based analysis has some advantages over ROI analysis: it is less labor intensive and allows the detection of effects whose location are not within anatomically predefined regions. Voxel-based methods, however, involve spatial normalization and smoothing, which may limit the power to detect changes in small and anatomically predefined regions. Therefore, in this study we performed both ROI and voxel-based analyses, to compare the results generated by both techniques.
Using voxel-based analysis, significant ΔV3″ clusters were seen in the VST and putamen, and no significant clusters were detected in the caudate. This result was generally consistent with the results of the ROI analysis, except that ΔV3″ in the caudate was significant in the ROI analysis. The discrepancy between the ROI-based and voxel-based analyses of the caudate suggest a loss of power associated with the voxel-based method and prompted us to examine in more detail the factors that may account for this difference. Since the SPM analysis included the whole brain as the search volume, the absence of significant clusters in the caudate was thought to be related to the penalty imposed by the large search volume. However, even after restricting the search volume to the caudate alone no significant clusters were detected in this region (data not shown).
Since the voxel-based analysis involves both spatial smoothing and normalization of the data, we investigated this issue further by performing an ROI analysis on V3″ maps that had been either smoothed, normalized, or both. Four analyses were generated: (1) individual ROIs were applied to the individual original V3″ maps (without smoothing or normalization); 2) individual ROIs were applied to individual V3″ maps smoothed using a 4-mm FWHM filter (no normalization); (3) a set of ROIs drawn on the Montreal Neurological Institute single-subject T1 template was applied to spatially normalized (but not smoothed) V3″ maps; and (4) this set of template ROIs was applied to spatially normalized and smoothed V3″ maps.
The results from this comparison (Table 7) showed that smoothing and normalization, alone or in combination, had virtually no effect on ΔV3″ itself or its significance level. Evidently, the loss of power observed in the SPM analysis was not due to spatial normalization or smoothing, but rather to the intrinsic voxel-by-voxel analytic process and its correction for multiple comparisons.
Impact of spatial smoothing and normalization on ΔV3″
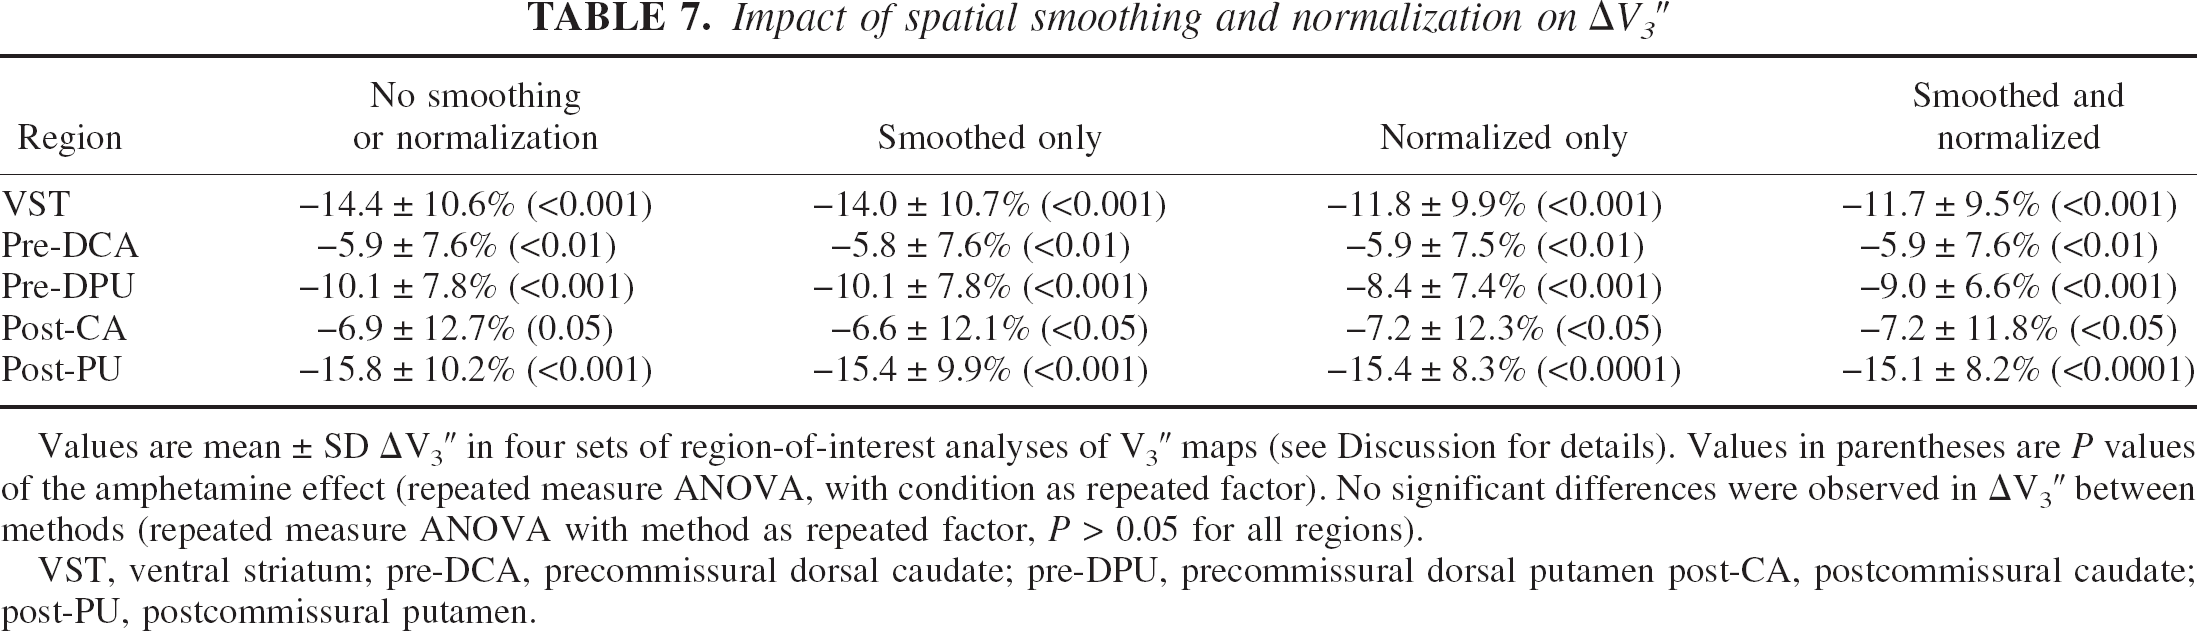
Values are mean ± SD ΔV3″ in four sets of region-of-interest analyses of V3″ maps (see Discussion for details). Values in parentheses are
VST, ventral striatum; pre-DCA, precommissural dorsal caudate; pre-DPU, precommissural dorsal putamen post-CA, postcommissural caudate; post-PU, postcommissural putamen.
From this set of analyses, we conclude that, when a hypothesis pertains to an
Partial volume effects correction
The limited resolution of the imaging process results in signal blurring (activity spilling over across regions). The quantification of activity in a given ROI is therefore affected by two reciprocal interactions. First, a proportion of the activity originating in the ROI will be recorded outside of this region (spill-out), resulting in underestimation of the true activity (partial recovery). Second, a proportion of the activity originating from the adjacent regions will be recorded in the ROI (spill-in), resulting in an overestimation of the true activity (contamination). The net effect of partial recovery and contamination depends on the gradient of true activity between the ROI and the adjacent regions. The GTM describes the structure of the activity exchange between the regions, based on their spatial relations and the image resolution. Multiplying the measured activity by the inverse of the GTM provides an estimate of the true activity distribution (Rousset et al., 1998; Mawlawi et al., 2001).
On [11C]raclopride images, the striatum as a whole is surrounded by background activity. Partial volume effects correction resulted in a significant increase in V3″ but no change in ΔV3″. This result indicates that PVE correction is not required for experiments with a within-subject design in which the ROI is surrounded by background activity that is not affected by the challenge. We previously proposed that the estimate of 5-HT1A receptor occupancy by pindolol in the dorsal raphe nuclei measured with [11C]WAY 100635 is not biased by the very large PVE in this region, since this structure is located in the middle of a large region devoid of specific binding (Martinez et al., 2001). The observation that PVE correction did not change ΔV3″ in the striatum as a whole confirms this hypothesis. The situation, however, is more complex for the striatal subregions, since they are surrounded by other regions with specific binding.
Partial volume effects correction resulted in significant changes in ΔV3″ in 4 of 5 subregions. Partial volume effects correction had no impact on post-CA ΔV3″, a region that, similar to the striatum as a whole, is almost completely surrounded by background activity. In the other associative regions (pre-DCA and pre-DPU), PVE correction resulted in small but significant decreases in ΔV3″, due to the removal of contamination from the high-displacement regions (post-PU and the VST). Conversely, in the post-PU and the VST, PVE correction significantly increased ΔV3″, owing to the removal of contamination from the low-displacement regions (pre-DCA and pre-DPU). Thus, for adjacent regions differentially affected by a challenge, PVE correction enhances the detection of between-region differences in ΔV3″.
Mechanisms underlying between-region differences in ΔV3″
The technique used in this study does not directly measure dopamine release, but rather its impact on [11C]raclopride binding. Therefore, the mechanisms potentially accounting for regional differences in ΔV3″ fall into two general categories: regional differences in the potency of dopamine to reduce [11C]raclopride binding (postsynaptic factors) or regional differences in amphetamine-induced dopamine release (presynaptic factors). Data from this study do not allow us to differentiate between these scenarios, and the microdialysis literature is, in this regard, inconclusive. The fact that amphetamine may induce larger dopamine release in the nucleus accumbens compared with the caudate-putamen is supported by some (Sharp et al., 1987; Di Chiara and Imperato, 1988) but not all (Robinson and Camp, 1990) rodent microdialysis studies (see discussion in Drevets et al., 2001). In primates, Bradberry et al. (2000) showed with microdialysis that systemic cocaine administration resulted in a greater increase in dopamine release in the ventral striatum compared to the dorsal striatum rostral to the AC, a finding consistent with this study. We are unaware of microdialysis studies comparing stimulant-induced dopamine release in the AST and SMST in primates. Such a study would be helpful to the interpretation of the results reported here.
Dopamine neurons projecting to the VST (dorsal tier of the SN) express fewer D2 autoreceptors and dopamine transporters (DAT) than the dopamine neurons of the nigrostriatal system (Hurd et al., 1994; Haber et al., 1995). Lower D2 autoreceptor function is compatible with higher amphetamine-induced dopamine release because stimulation of these receptors decreases the firing activity of dopamine neurons (Bunney and Aghajanian, 1978). It is difficult to predict the effect of lower DAT expression on the amphetamine effect. Since amphetamine promotes dopamine efflux via reverse transport through the DAT (Sulzer et al., 1995), lower DAT density would be expected to be associated with lower amphetamine-induced dopamine release. In contrast, a higher density of DAT unoccupied by amphetamine may preserve more reuptake activity in regions with high DAT. In any case, these differences in D2 autoreceptors and DAT expression between dopamine neurons of the dorsal and ventral tier do not fully explain the regional differences in ΔV3″ observed in this study.
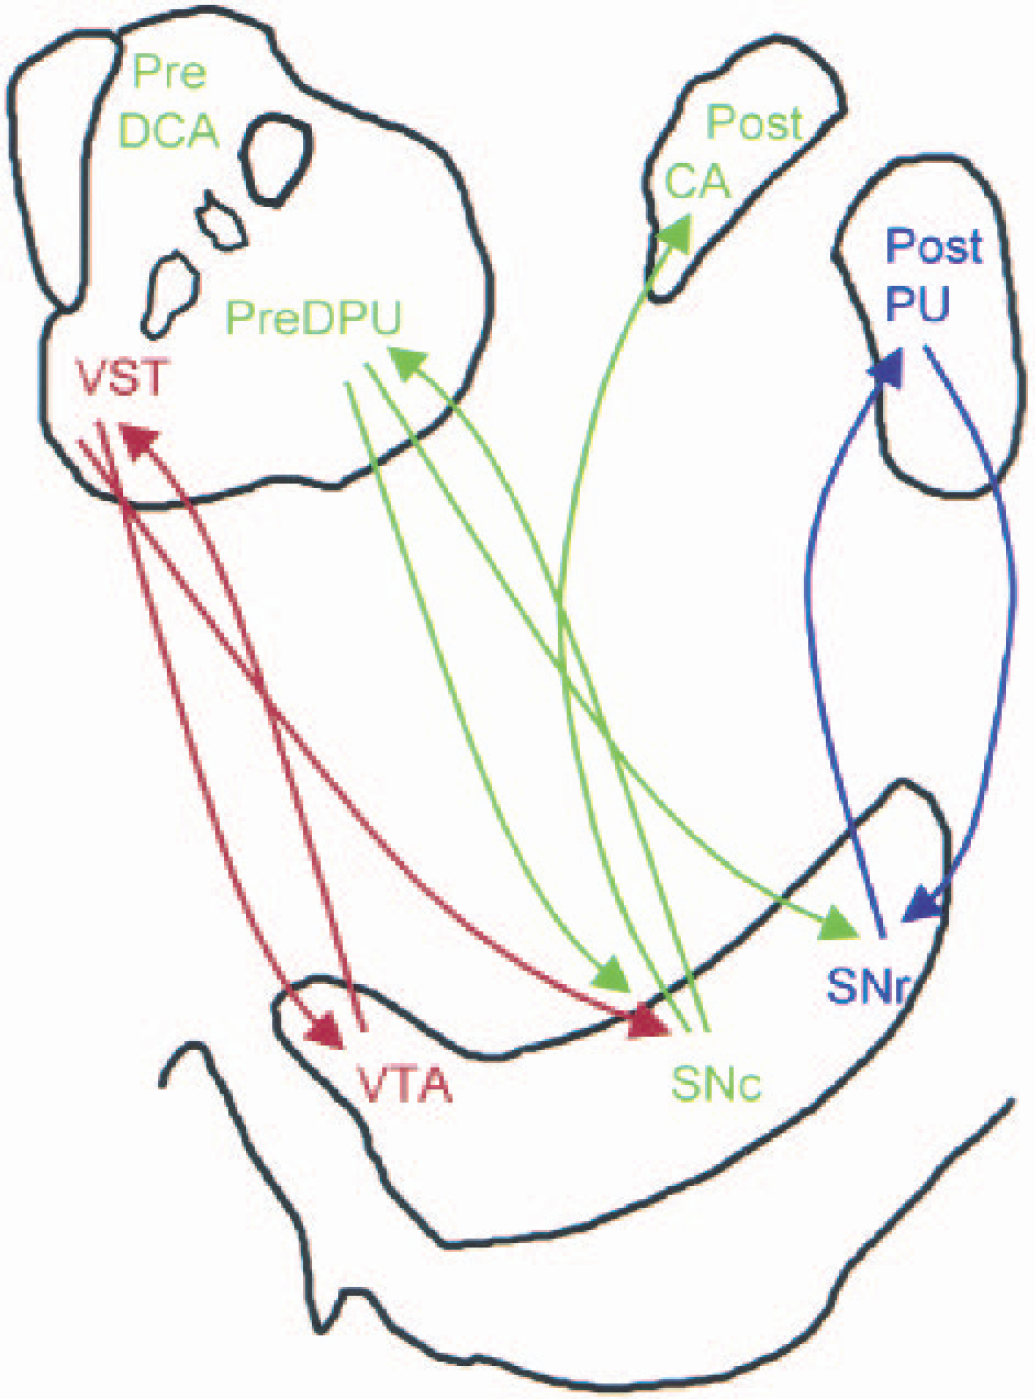
Simplified representation of striatonigrostriatal subcircuits. The structures at the top represent the precommisural (left) and postcommissural (right) striata; the structure at the bottom represents the ventral tegmental area (VTA)–substantia nigra (SN). Limbic, associative (AST), and sensorimotor (SMST) subdivisions of the striatum are color-coded in red, green, and blue, respectively. Ascending arrows represent dopamine projections from the VTA/SN to the striatum and descending arrows represent γ-aminobutyric acid (GABA)-ergic projections from the striatum to the VTA/SN. Each striatal subdivision sends reciprocal GABAergic projections to the region of the midbrain from where they receive their dopamine inputs. In addition, the ventral striatum (VST) sends nonreciprocal connections to the midbrain region where dopamine neurons projecting the AST are located, and the AST sends nonreciprocal connections to the midbrain region where dopamine neurons projecting the SMST are located. Through this feed-forward spiral of nonreciprocal connections, dopamine-mediated information progresses from the limbic to cognitive to sensorimotor areas of the striatum. This organization provides a framework for a hypothetical interpretation of the amphetamine data reported in this study. It is proposed that, after amphetamine, each dopamine cell group receives inhibitory feedback from the area it projects to via reciprocal connections. In addition, the dopamine cell group projecting to the AST will receive inhibitory influence from the VST. This supplemental inhibitory influence may result in lower dopamine release in the AST, which, in turn, would weaken the inhibitory influence of the AST to dopamine cells projecting to the SMST. Thus, a pattern of asymmetrical inhibitions after amphetamine may result in an on-off-on phenomenon along the limbic–associative–motor cascade. Pre-DCA, precommissural dorsal caudate; pre-DPU, precommisural dorsal putamen; post-CA, postcommissural caudate; post-PU, postcommissural putamen; SNr, substantia nigra reticularis; SNc, substantia nigra pars compacta. (Adapted from Fig. 12 in Haber et al., 2000.)
GABAergic neurons descending from the striatum to the VTA/SN make direct contact with dopamine neurons (a direct inhibitory effect on dopamine neurons), or make contact with GABAergic interneurons (an indirect inhibitory or stimulatory effects on dopamine activity). Given the inhibition of dopamine cell firing observed after amphetamine (Bunney and Aghajanian, 1978), it is likely that, under this condition, the inhibitory influence predominates. Whereas each dopamine cell group receives inhibitory feedback from the area it projects to via reciprocal connections, dopamine cells projecting to the AST may receive additional inhibition from the VST.
This additional inhibition could result in lower dopamine release in the AST compared with the VST. Because of this relatively lower dopamine release in the AST, the inhibitory influence from the AST to the dopamine cells projecting to the SMST would be relatively weaker, resulting in higher dopamine release in the SMST compared with the AST. Such an asymmetrical regulation of midbrain dopamine neurons could result in the pattern of dopamine release seen in this study. Further research is necessary to test this hypothesis.
Relation with subjective experience
In this study, no associations were observed between baseline V3″ values and the subjective effects of amphetamine. This result contrasts with the report of Volkow et al. (1999a), who observed that low baseline D2 receptor availability was associated with a larger euphoric response after injection of methylphenidate.
In contrast, a significant association was observed between increased euphoria and higher ΔV3″ in the VST, SMST, and striatum as a whole. Plasma amphetamine levels did not account for this association. This result confirms and extends results of three previous imaging studies in healthy subjects. Using SPECT and [123I]IBZM, Laruelle et al. (1995) reported a significant association between striatal ΔV3″ and the increase in euphoria induced by amphetamine. Using [11C]raclopride, Volkow et al. (1999b) reported an association between increase in “high” ratings and striatal ΔV3″ induced by methylphenidate. Drevets et al. (2001) reported that the change in euphoria correlated with ΔV3″ of [11C]raclopride in the VST and in the ventral putamen. Because the ventral putamen as defined in Drevets et al. (2001) overlaps significantly with the post-PU in this study, both studies concur that this association is stronger in post-PU and VST compared with the associative regions.
It is notable that four studies (Laruelle et al., 1995; Volkow et al., 1999b; Drevets et al., 2001, and the present study) observed a relation between ΔV3″ and the subjective euphoric experience in psychostimulant-naive subjects. Previous studies conducted in psychostimulant-naive subjects under controlled environmental conditions have identified large between-subject differences in the euphoric effects of amphetamine (Wachtel and de Wit, 1999). The results of these imaging studies show that this variability is at least partially accounted for by the magnitude of dopamine release and stimulation of D2 receptor transmission elicited by amphetamine. To the extent that the rewarding effects of a drug is a predictor of subsequent use (Davidson et al., 1993), these data indicate that a strong neurobiologic response of the dopamine system to amphetamine may constitute a risk factor in the development of addiction.
CONCLUSIONS
This study revealed dynamic differences in dopamine transmission among functional subdivisions of the human striatum: amphetamine induced a larger displacement of [11C]raclopride in the limbic and sensorimotor subdivisions than in the associative subdivision. We conclude that these regional differences in ΔV3″ are unlikely to result from an artifact of the imaging process. These differences were observed using both the paired-bolus–plus–infusion method (the present study) and the paired-single-bolus method (Drevets et al., 2001). In the present study, they were observed regardless of the method of analysis used to derive V3″ (equilibrium or SRTM) and of the image analysis technique (ROI-based and voxel-based analyses). They did not result from a partial volume effect, since PVE correction magnified these differences.
Further research is warranted to establish the mechanisms involved in these regional differences and to explore their consequences in the development of the addiction. Striatal dopamine has been postulated to improve the signal-to-noise ratio of corticostriatal information flow and to promote synaptic plasticity of these pathways (Arbuthnott et al., 2000). Therefore, a differential effect of amphetamine among these functional subdivisions of the striatum may, on repeated exposure, fundamentally alter the normal limbic–associative–motor integration. The results of the present study also raise interesting questions relative to the increase in amphetamine-induced dopamine release measured in patients with schizophrenia in the striatum as a whole (Laruelle et al., 1996; Breier et al., 1997; Abi-Dargham et al., 1998). Because of the small contribution of the VST to the overall striatal signal, the dysregulation of dopamine release observed in these patients is unlikely to be restricted to mesolimbic projections. Given that the AST provides the larger contribution to the overall striatal volume, it is tempting to speculate that a disruption of dopamine release in this area is involved in schizophrenia. Finally, the observation of a relation between increase in euphoria experienced by the subjects and stimulation of D2 receptors by dopamine in some, but not all, dopaminergic pathways illustrates the potential of PET dynamic neuroreceptor imaging as a tool to study the neurochemical circuits underlying human emotion.
Footnotes
Acknowledgments:
The authors would like to thank Grace Abrena, David Amstel, Sue Chung, Nicole Eftychiou, Ingrid Gelbard-Stokes, Elizabeth Hackett, Leyla Khenissi, Kimchung Ngo, Julie Montoya, Chaka Peters, Audrey Perez, Beatriu Reig, Janine Rodenhiser-Hill, Norm Simpson, and Kris Wolff for excellent technical assistance.