
Abstract
Background:
Although, several studies have assessed the association of the phospholipase A2 receptor (PLA2R) and HLA-DQA1 SNPs with primary membranous nephropathy (PMN), results were inconsistent and between-studies heterogeneity needs to be investigated.
Objectives:
The aim of this review was to summarize existing data on the contribution of 10 SNPs in the PLA2R and HLA-DQA1 genes to PMN susceptibility and to investigate the between-studies heterogeneity by subgroup analyses and meta-regressions.
Design:
This study was performed according to the PRISMA guidelines for systematic reviews and meta-analyses.
Data sources and methods:
An electronic literature search for eligible studies among all papers published prior to January 10, 2024, was conducted through PubMed, EMBASE, Web of science and Scopus databases. Meta-analyses together with subgroup analyses and meta-regressions were performed for the 10 following SNPs: rs4664308, rs3749117, rs3749119, rs35771982, rs3828323, rs16844715, rs1511223, rs6757188, rs2715918, and rs2187668.
Results:
Combined analyses revealed a significant increase in PMN risk conferred by the following alleles: rs4664308*A, rs3749117*T, rs3749119*C, rs35771982*G, rs3828323*C, rs16844715*C, rs1511223*A, rs2715918*A, and rs2187668*A, all P-values < .001. Moreover, the PLA2R-rs4664308/HLA-DQA1-rs2187668 interaction was significantly associated with an increased PMN risk, P < .001. However, there was a substantial between-studies heterogeneity for some SNPs. Subgroup analyses by ethnicity for the 9 PLA2R SNPs did not show any cross-ethnic disparity. Inversely, the risk conferred by the HLA-DQA1 rs2187668*A allele was significantly higher in Caucasians (OR [95% CI] = 3.929 [3.251–4.748]) than in Asians (OR [95% CI] = 2.537 [1.94–3.318], P = .007. Besides, meta-regressions revealed for the majority of investigated SNPs significant correlations of the effect size with albumin, 24-hours proteinuria, serum creatinine, and eGFR levels. Hence, the influence on PMN risk conferred by the PLA2R and HLA-DQA1 SNPs was rather noted in patients with a severe disease.
Conclusion:
This meta-analysis showed that 9 out of the 10 investigated SNPs in PLA2R and HLA-DQA1 genes were associated with increased PMN risk. Heterogeneity could be due to disparate patient groups in terms of disease presentation for almost all SNPs, and ethnicity for the HLA-DQA1 rs2187668 SNP.
Registration:
This review has been registered on PROSPERO: CRD42024506729. Available from: https://www.crd.york.ac.uk/prospero/display_record.php?ID=CRD42024506729
Plain language summary
Why was the study done? Primary membranous nephritis (PMN) is the most common etiology of adult-onset nephrotic syndrome. Understanding risk factors, particularly genetic ones, would provide a better understanding of its pathophysiological mechanisms in order to prevent and treat patients more effectively. What did the researchers do? The research team summarized published data on genetic factors associated with PMN including phospholipase A2 receptor (PLA2R) and HLA-DQA1 genes. What did the researchers find? The total number of included studies was 27. Nine out of ten genetic factors were found to be associated with PMN risk. Moreover, we noted significant interaction between PLA2R and HLA-DQA1 in potentializing PMN risk. Nevertheless, there was a significant between-studies heterogeneity which was found to be explained in part by disease severity. What do the findings mean? This study has identified some important some genetic factors associated with PMN together with confounding factors that could influence the aforementioned association.
Keywords
Introduction
Membranous nephropathy (MN) is the most common etiology of adult-onset nephrotic syndrome. 1 Approximately 20% of MN are secondary membranous nephropathy (SMN) which can be related to an autoimmune disease such as systemic lupus erythematosus or due to infections, drugs, or cancers. 2 The remaining 80% of MN are referred to as idiopathic or primary membranous nephropathy (PMN). 2
Since the discovery in 2009 of the phospholipase A2 receptor (PLA2R) as a target autoantigen in PMN by Beck et al 3 several proteomic and genomic studies focusing on PLA2R have been carried out to better understand its pathogenic mechanisms. In addition, some authors have hypothesized that renal overexpression of PLA2R may trigger an autoimmune response, resulting in the production of PLA2R antibody (Ab). 4 Indeed, PLA2R expression study by direct immunofluorescence and immunochemistry revealed a significant increase in PLA2R deposit in case of PMN comparatively to SMN or tubular nephropathies.4,5 Besides, the PLA2R Ab production by autoreactive B cells requires the presentation of PLA2R epitopes to T cells by class II human leukocyte antigens (HLA) including HLA-DR, -DP, and -DQ. Hence, numerous studies investigated HLA class II polymorphisms in PMN risk.
Three previous meta-analyses assessing PMN genetic risk; 2 for the PLA2R rs4664308 polymorphism (SNP) in 20206,7; and 1 for the HLA-DQA1 rs2187668 SNP in 2018 8 ; have been already published. Nevertheless, these aforementioned meta-analyses included only a few studies (7–11) and revealed a high level of between-study heterogeneity with inconsistent results.6,8 Moreover, subgroup analyses by ethnicity failed to explain the heterogeneity and the between-studies inconsistency.6,8 Furthermore, these previous meta-analyses did not perform extensive meta-regressions in order to investigate the aforementioned between-studies heterogeneity. Therefore, including more studies and a deeper investigation of the sources of heterogeneity are needed. In addition, the risk conferred by the PLA2R rs4664308 SNP (OR = 2.27)6,7 and the HLA-DQA1 rs218668 SNP (OR = 3.34) 8 represents only a small part of the genetic component predisposing to PMN. Indeed, other SNPs could contribute to PMN susceptibility, and thus require further investigation to better characterize the predisposing genetic landscape.
The aim of this review was to summarize existing data on the contribution of 10 SNPs in the PLA2R and HLA-DQA1 genes to PMN susceptibility and to investigate the between-studies heterogeneity by subgroup analyses and meta-regressions.
Materials and Methods
Search strategy
This study was performed according to the PRISMA guidelines for systematic reviews and meta-analyses. 9 An electronic literature search for eligible studies among all papers published prior to January 10, 2024, was conducted through PubMed, EMBASE, Web of science, and Scopus databases. The following search string was used: (([PLA2R] OR [phospholipase A2 receptor] OR [HLA-DQA]) AND ([Polymorphism] OR [SNP] OR [Variant] OR [Mutation] OR [Allele] OR [Allelic] OR [Genotype] OR [Genotypic] OR [rs4664308] OR [rs3749117] OR [rs3749119] OR [rs35771982] OR [rs3828323] OR [rs16844715] OR [rs1511223] OR [rs6757188] OR [rs2715918] OR [rs2187668]) AND ([membranous nephropathy] OR [membranous nephritis])). The literature search was carried out without any language restriction.
Selection criteria
All studies were independently assessed and evaluated by 2 reviewers (Tarak Dhaouadi, T.D. and Imen Sfar, I.S.) for the inclusion and the exclusion. The following selection criteria were adopted:
Inclusion criteria:
Studies of case-control (retrospective) or cohort (prospective) design.
Studies assessing the association between PLA2R and/or HLA-DQA1 polymorphisms and PMN risk.
Studies providing precise results with genotypes or alleles frequencies.
Exclusion criteria:
Genotype frequencies are not consistent with the Hardy-Weinberg Equilibrium (HWE) as recommended by Trikalinos et al. 10
Studies carried out in patients with SMN.
Case series of subjects, narrative or systematic review, comments, or meta-analysis.
If many studies have been carried out using duplicate cases, only the study with complete data and the largest sample size was included.
Definition of primary membranous nephropathy
Primary membranous nephropathy was defined as a biopsy-proven MN with negative antinuclear antibody and serology of hepatitis B, C, and HIV, and the absence of neoplasm evidence.
Data extraction
Data were extracted using a predeveloped form and entered in an Excel datasheet. Two investigators (T.D. and I.S.) independently extracted the following information: first author, year of publication, study design, country, ethnicity, mean or median age, gender ratio (M/F), number of patients, number of controls, mean or median albumin (g/L), mean or median urinary protein (g/24 hours), mean or median serum creatinine, mean or median eGFR, PLA2R, and HLA-DQA1 SNPs genotyping method, the frequencies of genotypes and alleles for each of the following SNPs: rs4664308, rs3749117, rs3749119 rs35771982, rs3828323, rs16844715, rs1511223, rs6757188, rs2715918, and rs2187668 (Table 1). A third investigator (Awatef Riahi) compared the results of the extracted data for potential discrepancies.
Characteristics of included studies.
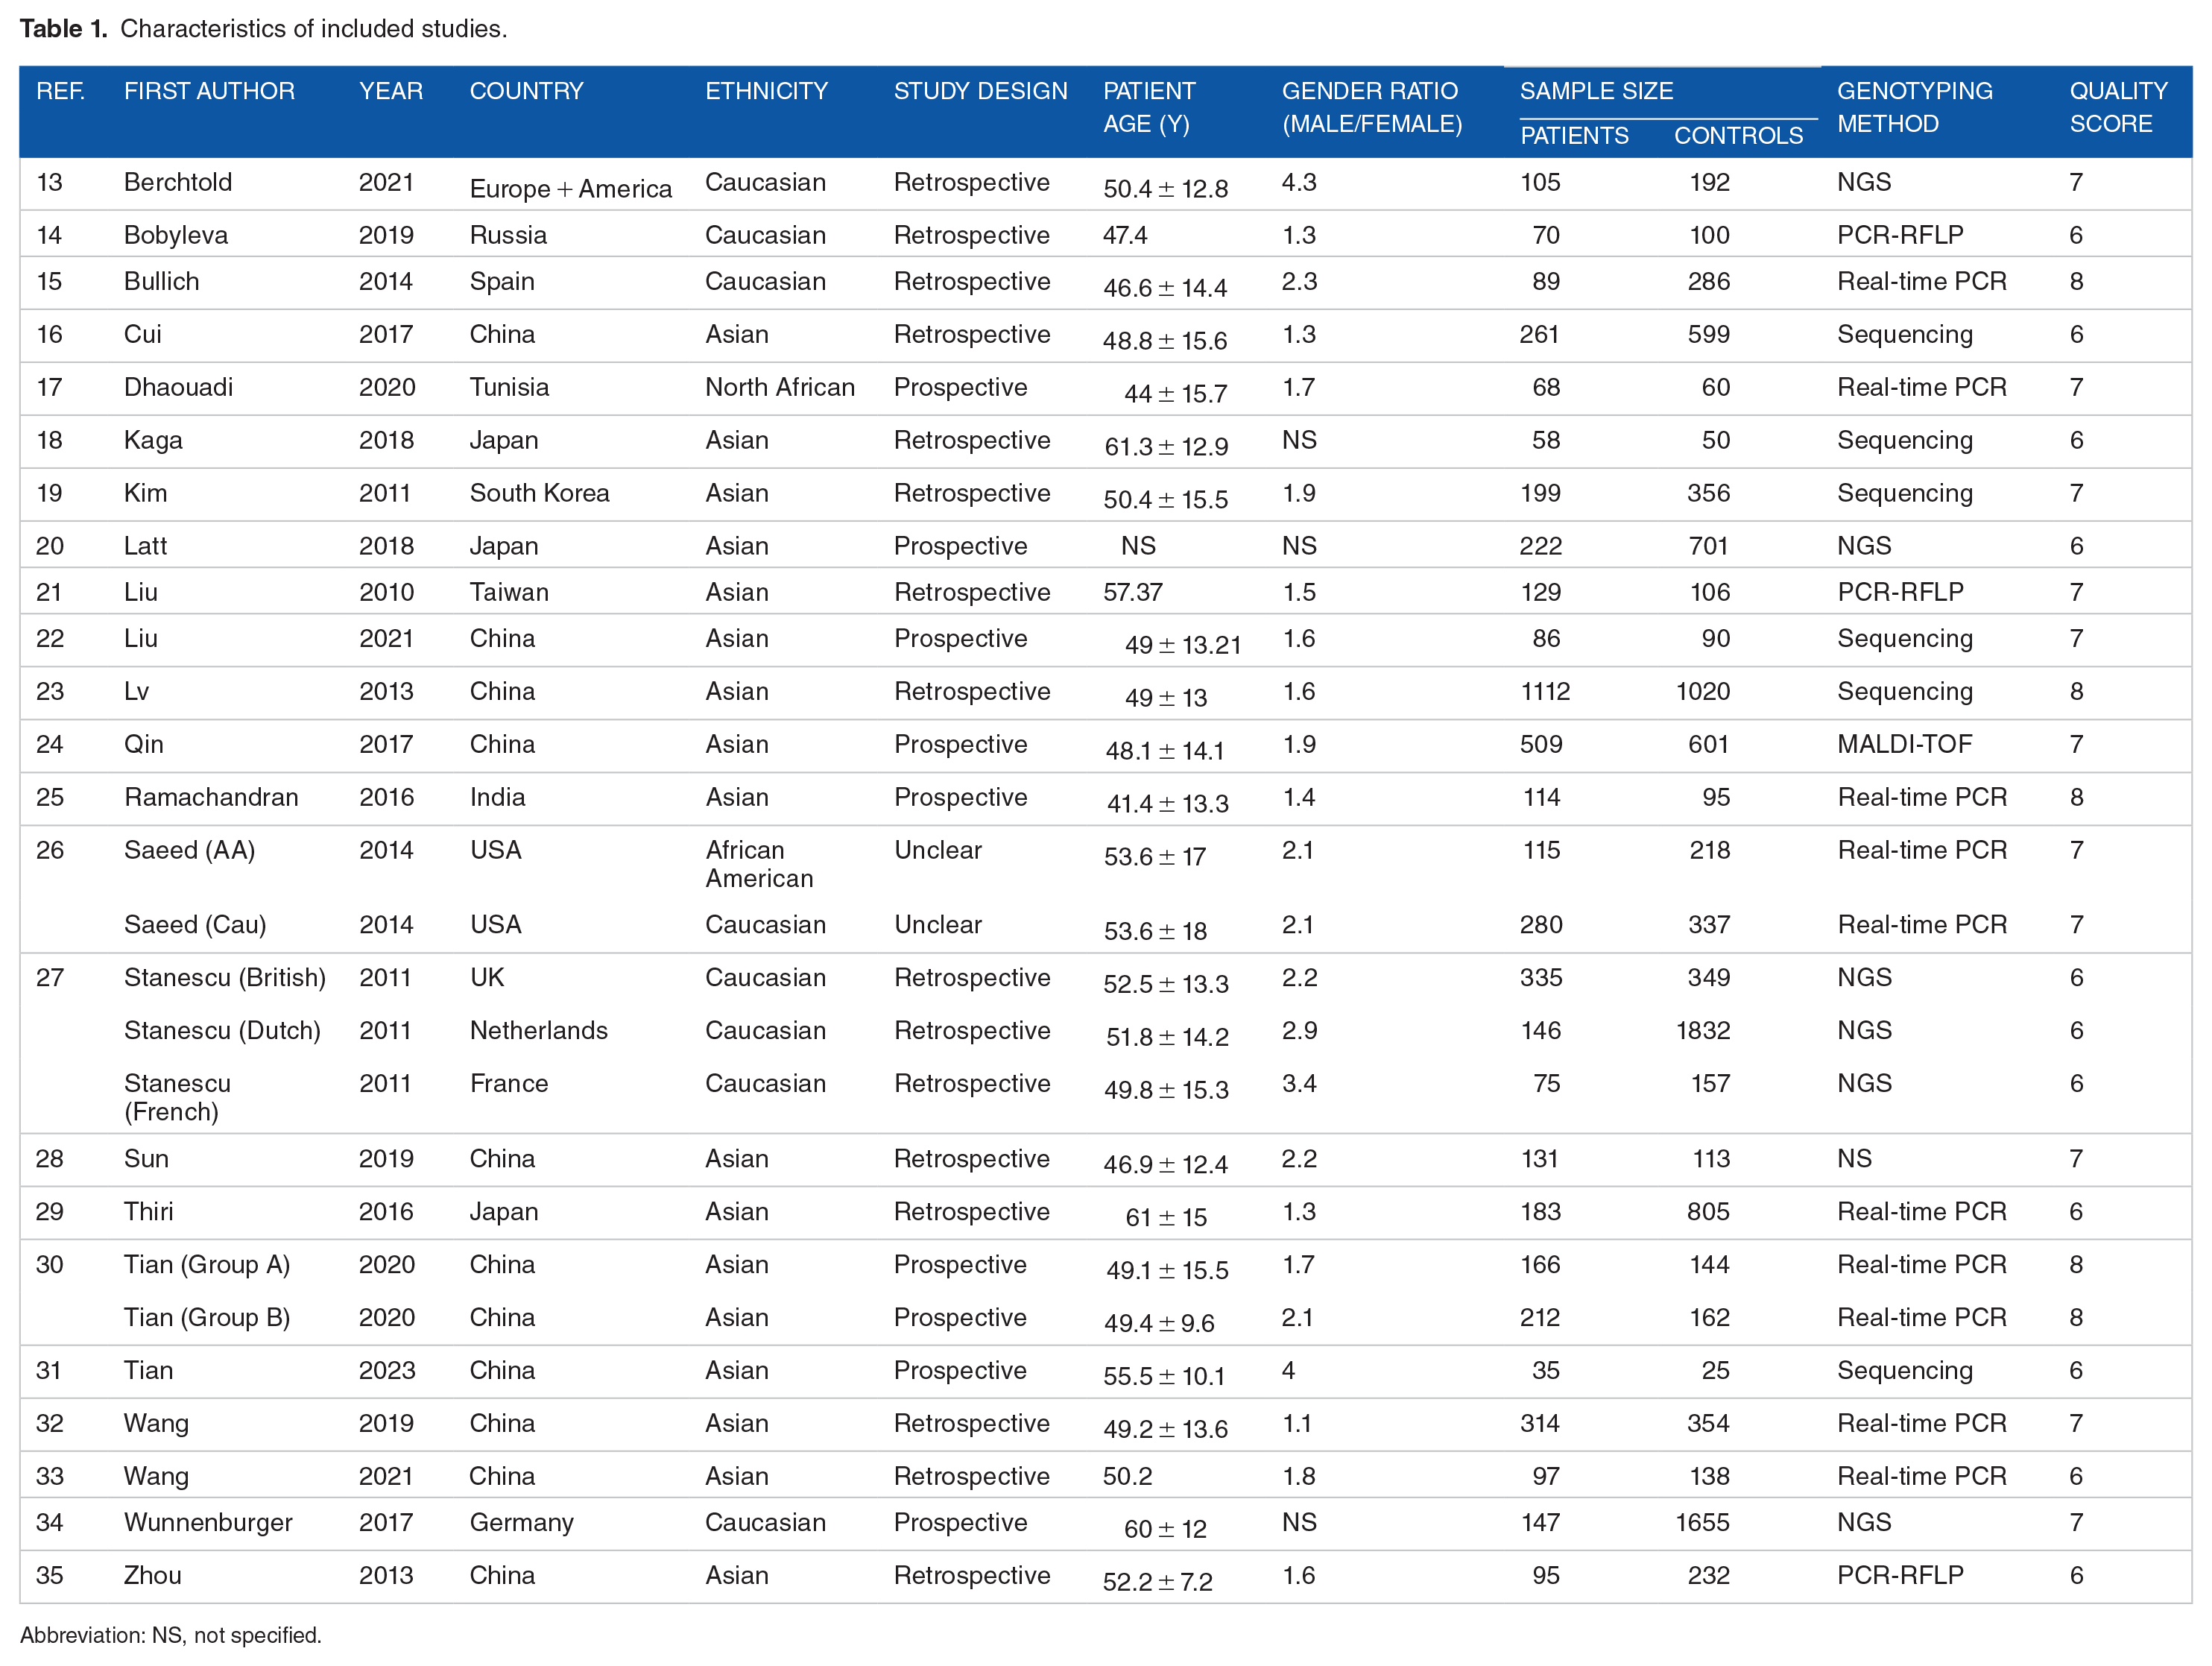
Abbreviation: NS, not specified.
Quality assessment
The quality of eligible studies was assessed independently by 2 reviewers (T.D. and I.S.) using the Newcastle-Ottawa Scale (NOS) 11 which is based on the following 3 general categories: selection (4 points), Comparability of the study groups (2 points), and ascertainment of outcome (3 points). Studies with a score ⩾7 were classified as high-quality reports. Additionally, risk of bias was assessed for each included study through a generic form (Excel spreadsheet) and visualized via the Cochrane ROBVIS online tool (https://mcguinlu.shinyapps.io/robvis/). Two additional independent reviewers (Taïeb Ben Abdallah and Yousr Gorgi) examined the quality-assessment results.
Study endpoints
The primary endpoint of this meta-analysis was to estimate the strength of the association between PLA2R and HLA-DQA1 SNPs and PMN risk. The secondary endpoint was to evaluate potential confounding factors that might influence the impact of the aforementioned SNPs on PMN risk in order to identify the sources of heterogeneity.
Statistical analysis
Statistical analysis was carried out using the Cochrane Review Manager 5.4 software, the OpenMeta-Analyst software, and the online available software MetaGenyo (https://metagenyo.genyo.es/). The associations of PLA2R and HLA-DQA1 SNPs with PMN risk were assessed using pooled Odds Ratios (ORs) with the 95% confidence interval (95% CI). The statistical significance of pooled ORs was tested by Z-test with a threshold of significance set at .05. Random effects models (DerSimonian-Laird) were used as recommended by Borenstein et al. 12 Indeed, as long as the eligible studies were carried out in genetically diverse populations, the random-effects model applies. 12 Forest-plots were generated to display the distribution of effect size (OR) across included studies. Sensitivity analyses were carried out to test the results stability by omitting sequentially each individual study. The heterogeneity of between-studies was tested by Q test (significance threshold: 0.1), quantified via I2 calculation (proportion of true effects variance) and analyzed through the determination of 95% prediction intervals (PI). PI were obtained through the CMA Prediction Intervals free software. The calculation of the 95% PI was based on the following 4 items: OR, upper bound of 95% CI, Tau2, and number of included studies. Subsequently, the heterogeneity was explored for potential sources by subgroup analyses and meta-regressions. Briefly, studies were stratified by continent and type of treatment. Meta-regressions were performed using age, gender ratio (male/female), the control/patient ratio, the minor allele frequency (MAF) in control group, albumin, urinary protein, serum creatinine, and eGFR as independent variables. Both univariate and multivariate models of meta-regression were generated in order to assess the presence of potential confounding factors. Publication bias were assessed by Egger’s test and visualized through the generation of funnel plots. HWE was examined for each study and for every SNP by assessing both individual-univariate and multivariate-adjusted P-values. HWE adjusted P-values in control groups are available for each SNP in Table 2. In this study, the codominant genetic model (allele contrast) was applied. Additionally, results of recessive and dominant genetic models were displayed.
HWE adjusted P-values in control groups.

Abbreviation: NS, not specified.
A Supplemental File 1 with additional tables and figures is available with the full-manuscript. A PRISMA checklist is available as a Supplemental File 2.
Systematic review registration
This review has been registered on PROSPERO: CRD42024506729, Available from: https://www.crd.york.ac.uk/prospero/display_record.php?ID=CRD42024506729.
Results
Search results and study characteristics
A PRISMA flow diagram was generated to depict the study selection process (Figure 1). Overall, 27 studies with a total of 5353 PMN cases and 10,777 controls were included in the present study.13–35 The characteristics of included studies are summarized in Table 1. Genotyping data of cases and controls are depicted in Supplemental Tables S1–S10. Biological features of included studies patients are illustrated in Supplemental Table S11. Eighteen studies were included for the rs4664308 SNP,13–17,20,22,23,25,27,28,30,32–34 13 for the rs3749117 SNP,16,18,22,23,25–27,30,33 10 for the rs3749119 SNP,13,18,20,25,29–33 16 for the rs35771982 SNP,16,18–23,25,26,29–31,33,35 12 for the rs3828323 SNP,13,18,19,25–27,30,31,35 5 for the rs16844715 SNP,13,20,22,29,31 7 for the rs1511223 SNP,13,26,27,29 6 for the rs6757188 SNP,13,21,26,31,32 4 studies for the rs2715918 SNP,18,22,31,32 and 17 for the rs2187668 SNP.13,15,16,18,20,22–27,32–34 The NOS quality score results for each included study are shown in Table 1. Included SNPs characteristics are described in Supplemental Table S12. Risks of bias are summarized in Figure 2.

PRISMA flow diagram for study selection.
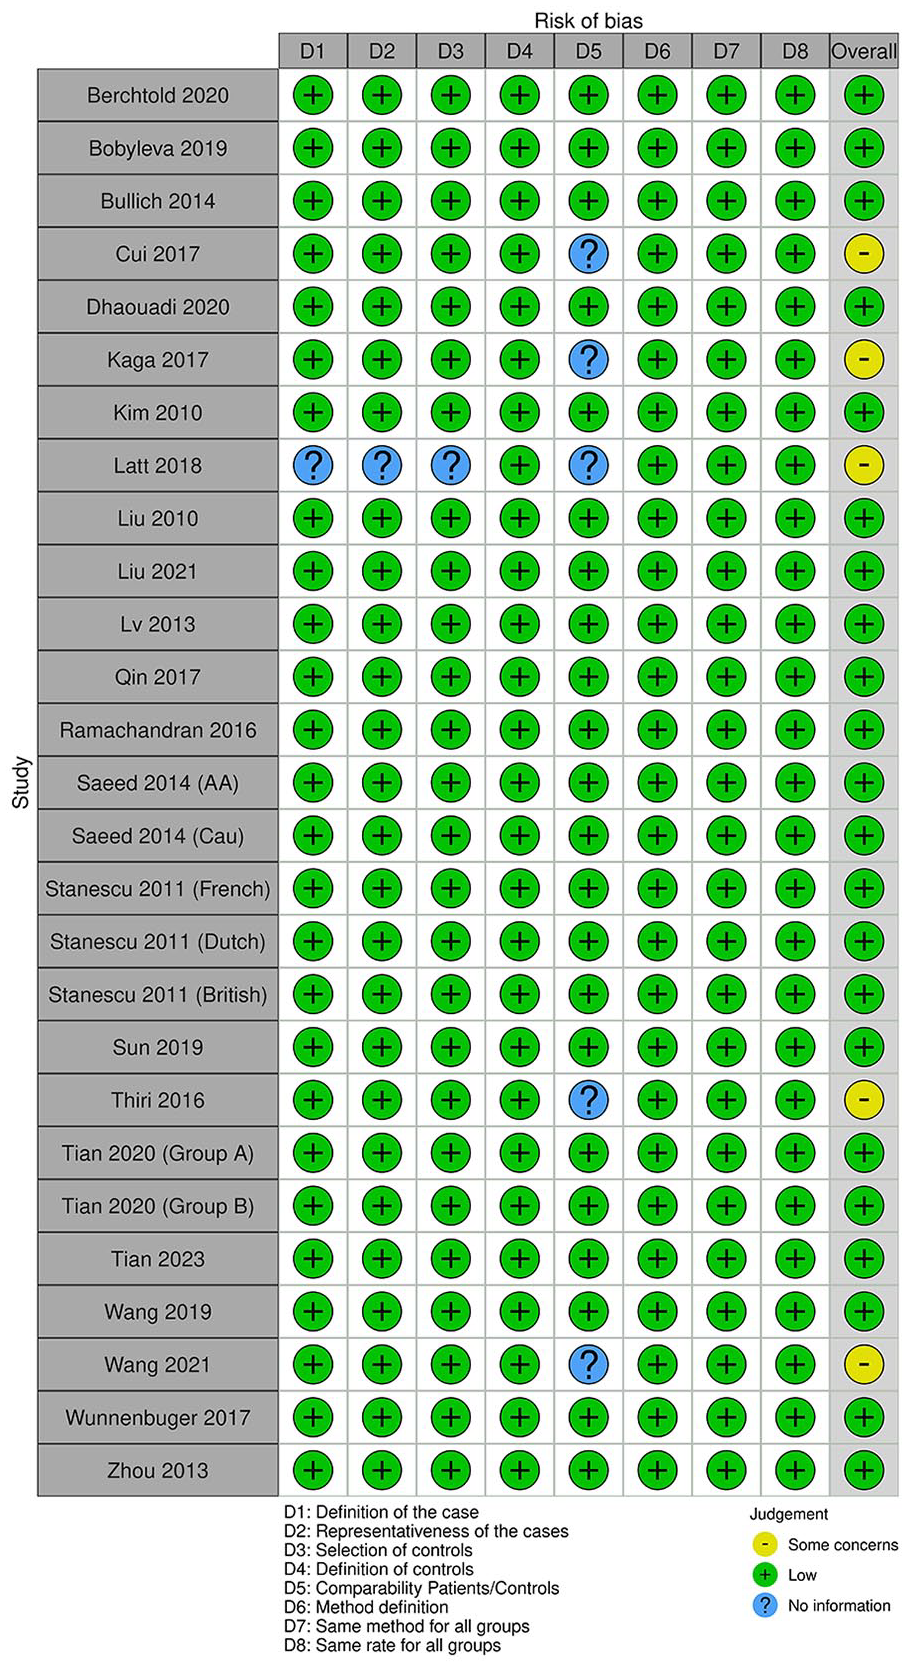
Summary of study risk of bias.
PLA2R rs4664308 SNP meta-analysis
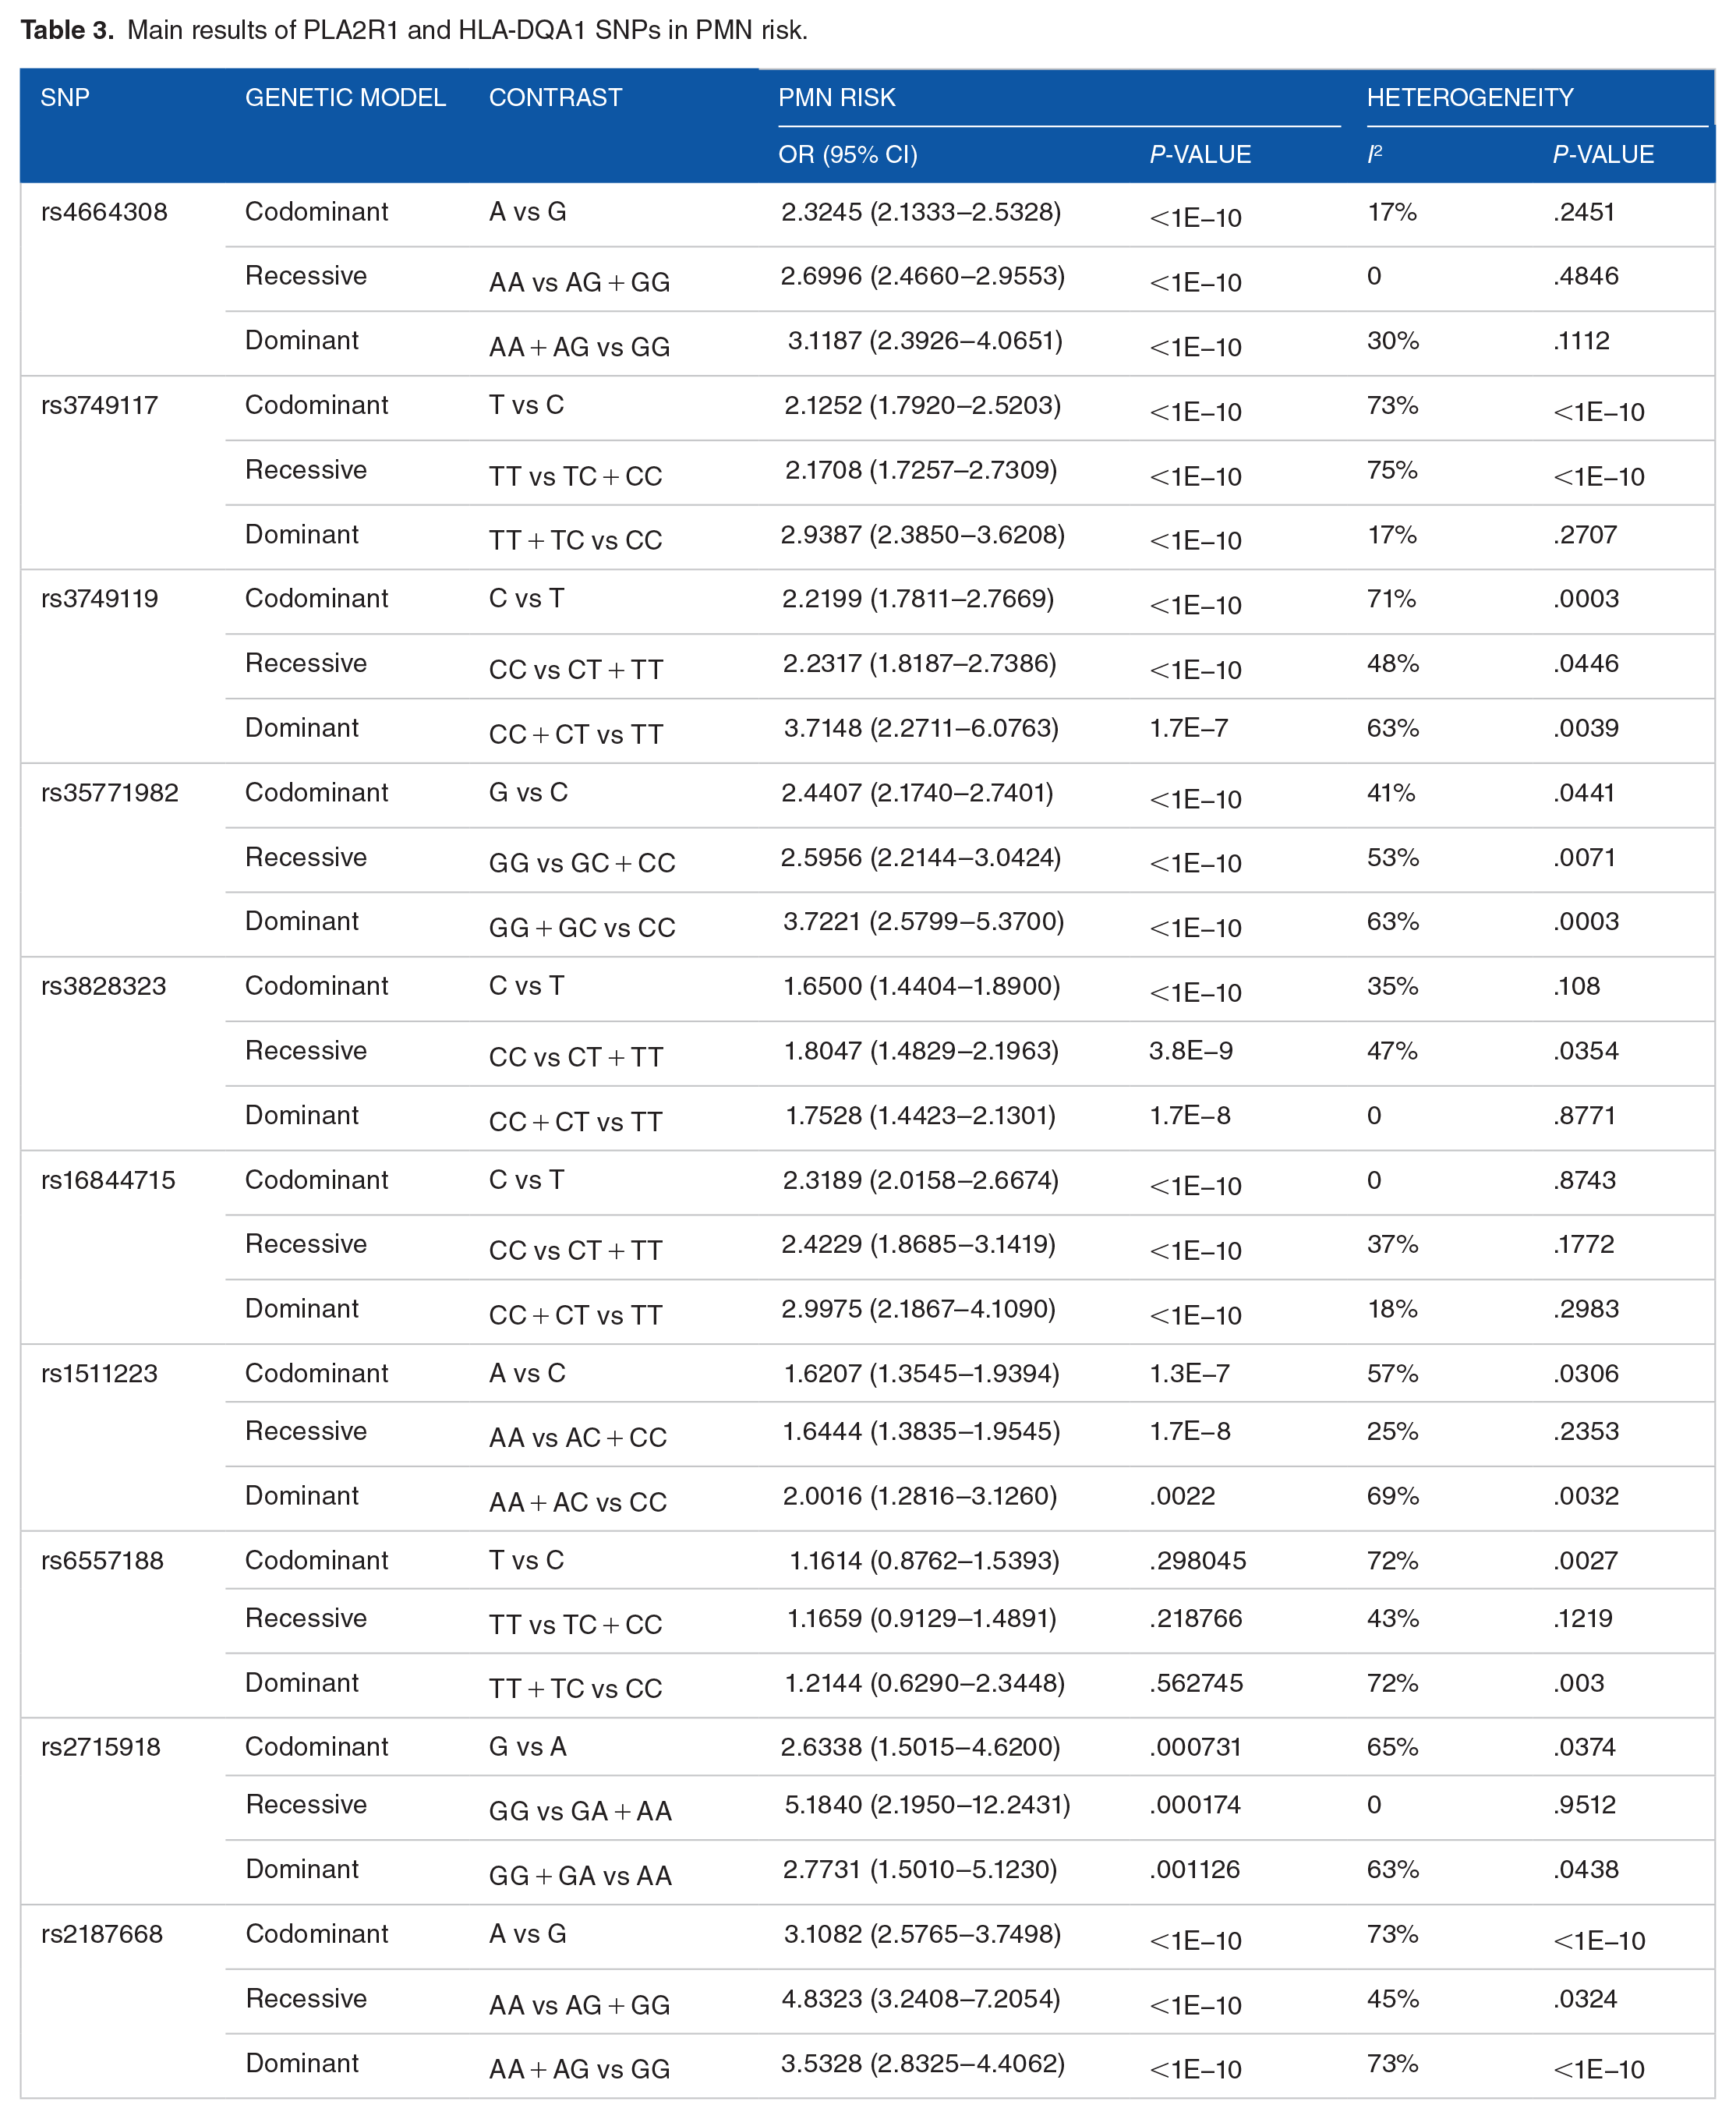
The rs4664308*A wild (major) allele was significantly associated with increased PMN risk, OR (95% CI) = 2.32 (2.13–2.53), P < 1E−10 (Figure 3). This association noted with the codominant model was also statistically significant when recessive and dominant models were applied (Table 3). Besides, there was a low level of between-studies heterogeneity, I2 = 17%, Tau2 = 0.0057, 95% PI = (1.93–2.8), and P = .25. Subgroup analysis by ethnicity revealed that the increase of PMN risk conferred by the A allele remained significant in all ethnic groups, Caucasian, Asian, and North-African (Supplemental Figure S1). Subsequent meta-regression revealed significant negative correlation of the effect size with both gender ratio (M/F) and albumin level, P = .045 and P = .015, respectively (Supplemental Table S13 and Supplemental Figure S2).

Forest plot for the association between the PLA2R rs4664308 SNP and PMN risk: Significant increase in PMN risk in case of rs4664308*A allele with a low between-studies inconsistency.
Main results of PLA2R1 and HLA-DQA1 SNPs in PMN risk.
PLA2R rs3749117 SNP meta-analysis
The integrated analysis revealed a significant association between the rs3749117*T wild allele and susceptibility to PMN, OR (95% CI) = 2.13 (1.79–2.52), P < 1E−10 (Figure 4). Likewise, recessive and dominant genetic models exhibited significant association with PMN risk (Table 3). Nevertheless, the heterogeneity between included studies was substantial, I2 = 73%, Tau2 = 0.0642, 95% PI = (1.18–3.83), P < 1E−10. Subgroup analysis by ethnicity showed that both the association with PMN risk and the between-studies heterogeneity remained statistically significant in all ethnic groups (Supplemental Figure S3). Meta-regression revealed significant positive correlations of the effect size with age and urinary protein level and a negative correlation with albumin level, P = .012, P = .035, and P = .013, respectively (Supplemental Table S14).

Forest plot for the association between the PLA2R rs3749117 SNP and PMN risk: Significant increase in PMN risk in case of rs3749117*T allele with a significant between-studies inconsistency.
PLA2R rs3749119 SNP meta-analysis
The rs3749119*C wild allele was significantly associated with PMN susceptibility, OR (95% CI) = 2.22 (1.78–2.77), P < 1E−10 (Figure 5). This significant association was also noted in recessive and dominant genetic models (Table 3). However, there was a significant amount of between-studies heterogeneity, I2 = 71%, Tau2 = 0.0821, 95% PI = (1.09–4.51), P < 1E−10. There was only 1 included study performed in a Caucasian population while all the other studies were carried out in Asian groups. Hence, subgroup analysis did not bring further explanation of the observed heterogeneity (Supplemental Figure S4). Meta-regression revealed a significant negative correlation between the effect size and albumin level, P = .024 (Supplemental Table S15).

Forest plot for the association between the PLA2R rs3749119 SNP and PMN risk: Significant increase in PMN risk in case of rs3749119*C allele with a significant between-studies inconsistency.
PLA2R rs35771982 SNP meta-analysis
Combined analysis showed a significant association of the rs35771982*G major allele with increased PMN risk, OR (95% CI) = 2.44 (2.17–2.74), P < 1E−10 (Figure 6). Both recessive and dominant genetic models confirmed this significant association with PMN (Table 3). Nonetheless, there was a significant between-studies heterogeneity, I2 = 41%, Tau2 = 0.0199, 95% PI = (1.76–3.39), P = .04. As the mainstream of included studies were performed in Asian populations, the subgroup analysis did not provide the present study with information on potential sources of heterogeneity (Supplemental Figure S5). Inversely, the meta-regression model showed significant negative correlations of the effect size with albumin level and eGFR and a positive correlation with urinary protein level, P = .013, P = .001, and P = .045 (Supplemental Table S16 and Supplemental Figure S6). Therefore, the association of the rs35771982*G allele with PMN risk is rather observed in case of severe disease with lower albumin and eGFR levels and higher 24-hours proteinuria.

Forest plot for the association between the PLA2R rs35771982 SNP and PMN risk: Significant increase in PMN risk in case of rs35771982*G allele with a significant between-studies inconsistency.
PLA2R rs3828323 SNP meta-analysis
The rs3828323*C wild allele was significantly associated with PMN susceptibility, OR (95% CI) = 1.65 (1.44–1.89), P < 1E−10 (Figure 7). Likewise, recessive and dominant genetic models confirmed the significant association between the rs382832 SNP and PMN risk (Table 3). Besides there was a moderate between-studies heterogeneity, I2 = 35%, Tau2 = 0.0188, 95% PI = (1.17–2.32), P = .11. Subgroup analysis by ethnicity revealed that the association remained significant in all ethnic groups (Supplemental Figure S7). Conversely, meta-regression revealed a significant negative correlation of the effect size with albumin level (P = .002), and a positive correlation with 24-hours proteinuria level (P = .027) (Supplemental Table S17 and Supplemental Figure S8).

Forest plot for the association between the PLA2R rs3828323 SNP and PMN risk: Significant increase in PMN risk in case of rs3828323*C allele with a moderate between-studies inconsistency.
PLA2R rs16844715 SNP meta-analysis
Only 5 studies were included in the rs16844715 SNP meta-analysis. The C major allele was significantly associated with increased PMN risk, OR (95% CI) = 2.32 (2.02–2.67), P < 1E−10 (Figure 8). This association was also significant when recessive and dominant genetic models were applied (Table 3). In addition, there was no evidence of heterogeneity between included studies, I2 = 0%, Tau2 = 0, 95% PI = (2.02–2.67), P = .87.

Forest plot for the association between the PLA2R rs16844715 SNP and PMN risk: Significant increase in PMN risk in case of rs16844715*C allele without any between-studies inconsistency.
PLA2R rs1511223 SNP meta-analysis
Seven studies were involved in the rs1511223 SNP meta-analysis. The combined analysis showed a significant association of the A wild allele with susceptibility to PMN, OR (95% CI) = 1.62 (1.35–1.94), P < 1E−10 (Figure 9). Both recessive and dominant models confirmed this significant association (Table 3). However, the was a significant between-studies heterogeneity, I2 = 57%, Tau2 = 0.0311, 95% PI = (0.97–2.7) P = .03. Subgroup analysis by ethnicity was not informative as the majority of included studies were performed in Caucasian groups (Supplemental Figure S9). Subsequent meta-regression revealed a significant negative correlation between the effect size and the rs1511223*C minor allele frequency in control groups, P = .015 (Supplemental Table S18 and Supplemental Figure S10).
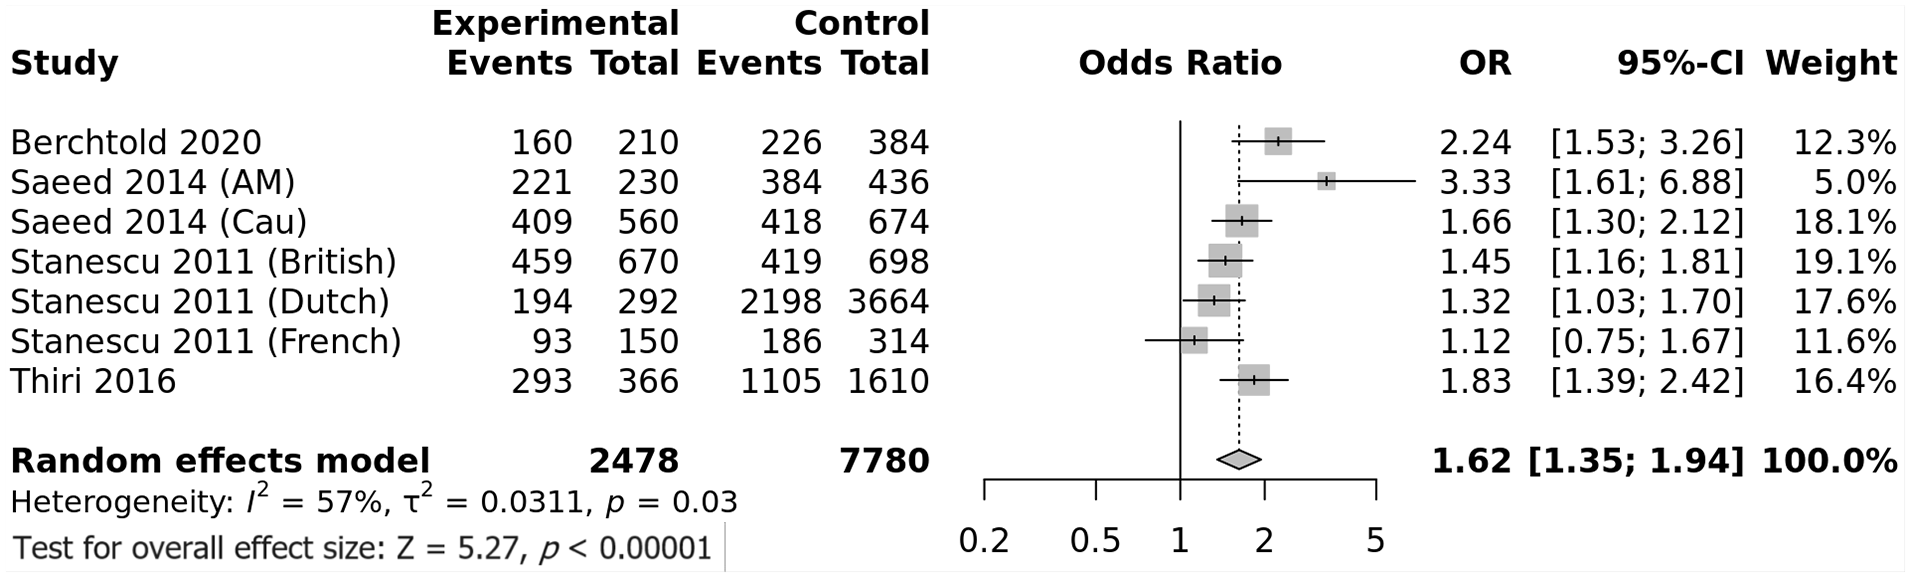
Forest plot for the association between the PLA2R rs1511223 SNP and PMN risk: Significant increase in PMN risk in case of rs1511223*A allele with a significant between-studies inconsistency.
PLA2R rs6757188 SNP meta-analysis
Six studies were included to assess the impact of the rs6757188 on predisposition to PMN. Combined analysis did not show any association between the T major allele and PMN risk, OR (95% CI) = 1.16 (0.88–1.54), P = .3 (Figure 10). Similarly, no association observed when recessive and dominant genetic models were applied (Table 3). Of note, there was a important amount of between-studies heterogeneity, I2 = 72%, Tau2 = 0.0827, 95% PI = (0.48–2.84), P = .0027. Subgroup analysis by ethnicity did not unveil any useful information on heterogeneity as the association between the rs6757188 SNP and PMN risk remained non-significant in all ethnic groups (Supplemental Figure S11). Inversely, meta-regression showed significant positive correlations of the effect size with the control/patient ratio and the C minor allele frequency in control groups, P = .002 and P < .0001, respectively (Supplemental Table S19 and Supplemental Figure S12).
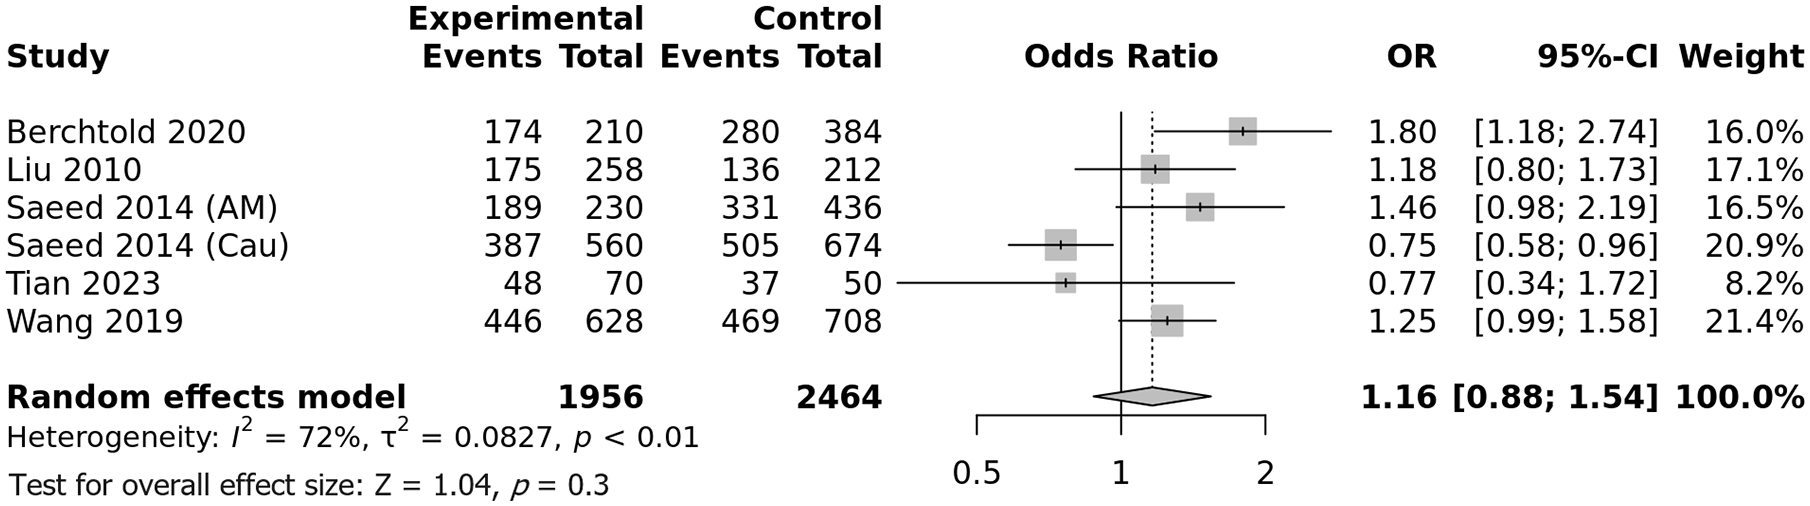
Forest plot for the association between the PLA2R rs6757188 SNP and PMN risk: No association between the rs6757188 SNP and PMN risk with a significant between-studies inconsistency.
PLA2R rs2715918 SNP meta-analysis
Only 4 studies investigated the influence of the rs2715918 on susceptibility to PMN. All included studies were performed in Asian populations. The rs2715918*A minor allele was significantly associated with increased PMN risk, OR (95% CI) = 2.63 (1.5–4.62), P = .0007 (Figure 11). Both recessive and dominant genetic models confirmed the significant association with predisposition to PMN (Table 3). Nevertheless, there was a significant heterogeneity between included studies, I2 = 65%, Tau2 = 0.1945, 95% PI = (0.27–5.32), P = .04. Subsequent meta-regression revealed significant negative correlations of the effect size with the gender ratio (P = .021) and the A allele frequency in control groups (P = .005) and a positive correlation with the 24-hours proteinuria level (P = .011) (Supplemental Table S20 and Supplemental Figure S13).

Forest plot for the association between the PLA2R rs2715918 SNP and PMN risk: Significant increase in PMN risk in case of rs2715918*A allele with a significant between-studies inconsistency.
HLA-DQA1 rs2187668 SNP meta-analysis
Combined analysis showed a significant association of the rs2187668*A minor allele with increased PMN risk, OR (95% CI) = 3.11 (1.5–4.62) P < 1E−10 (Figure 12). This association with increased PMN risk remained significant when recessive and dominant models were applied (Table 3). However, there was a considerable amount of between-studies heterogeneity, I2 = 73%, Tau2 = 0.1, 95% PI = (1.54–6.29), P < 1E−10. Subgroup analysis by ethnicity revealed that if heterogeneity was significant in both Caucasian and Asian populations, the risk conferred by the A allele was significantly higher in Caucasians (OR [95% CI] = 3.929 [3.251–4.748]) than in Asians (OR [95% CI] = 2.537 [1.94–3.318], P = .007) (Figure 13). Moreover, meta-regression showed significant negative correlation between the effect size and both albumin and eGFR levels and positive correlations with 24-hours proteinuria and serum creatinine levels, all P-values < .0001 (Supplemental Table S21 and Supplemental Figure S15).

Forest plot for the association between the HLA-DQA1 rs2187668 SNP and PMN risk: Significant increase in PMN risk in case of rs2187668*A allele with a significant between-studies inconsistency.

Subgroup analysis by ethnicity for the HLA-DQA1 rs2187668 SNP: Significant higher PMN risk conferred by the rs2187668*A allele in Caucasians comparatively to Asians and Americans.
Interaction between PLA2R rs4664308 and HLA-DQA1 rs2187668 SNPs
Only 3 studies15,25,27 provided the rs4664308/rs2187668 genotype combinations in PMN patients and controls. The high-risk combination was defined as the rs4664308*A/A genotype with rs2187668*G/A or A/A genotypes whereas the low-risk combination was defined as the rs4664308*G/G with the rs2187668*G/G genotypes. Comparatively to all other combinations, the high-risk combination conferred a significant increase in PMN risk, OR (95% CI) = 6.54 (4.38–9.71), P < 1E−10 (Figure 14A). Furthermore, when compared to low-risk combination, the high-risk combination was associated with an even higher risk of PMN, OR (95% CI) = 15.1 (4.94–46.19), P < 1E−10 (Figure 14B). However, both comparisons suffered from between-studies heterogeneity as the small number of included studies did not allow to suitably estimate Tau2.

Forest plot for the association of the PLA2R rs4664308/HLA-DQA1-rs2187668 interaction with PMN risk: Significant interaction between rs4664308 and rs2187668 in increased PMN risk.
Sensitivity analysis
The sensitivity analysis revealed that association results were stable for all performed meta-analyses (Supplemental Figures S15–S24), suggesting a high level of integrity with reliable results.
Publication bias
Generated funnel plots (Figure 15) were found to be overall symmetrical and Egger’s tests confirmed these findings with non-significant P-values for the 10 investigated SNPs (0.6949, 0.8552, 07506, 0.3805, 0.2065, 0.086, 0.2552, 0.6636, 0.948, and 0.6886), which indicated that results were not weakened by publication biases.

Funnel plots assessing publication bias: Symmetrical funnel plots with no evidence of publication biases. A: rs4664308 SNP. B: rs3749117 SNP. C: rs3749119 SNP. D: rs35771982 SNP. E: rs3828323 SNP. F: rs16844715 SNP. G: rs1511223 SNP. H: rs6757188 SNP. I: rs2715918 SNP. J: rs2187668 SNP.
Overall, apart from the rs6757188 SNP, all other SNPs in the PLA2R and HLA-DQA1 genes were found to be associated with PMN risk. For most SNPs, the association with PMN risk was influenced by serum albumin, eGFR, and 24-hours proteinuria levels. Moreover, combined results revealed a significant interaction between PLA2R and HLA-DQA1 genes in the increased risk of PMN.
Discussion
PMN is an antibody-mediated glomerular disease caused by the formation of a large number of IgG4 immune-complexes in the subepithelial space of the glomerular basement membrane. 3 In the majority of PMN patients, these IgG4 colocalize with the PLA2R 3 which have been reported to be overexpressed on podocytes. 5 In addition, to their diagnostic specificity for PMN, anti-PLA2R Abs have also been reported to be of a prognostic significance and could predict a non-remission outcome.17,25
Like other autoimmune diseases, PMN etiology is complex including multigenetic background and environmental factors. 17 Among genetic factors, PLA2R and HLA genes were the most associated with PMN risk. In fact, over the past decade several studies focused on PLA2R and HLA-DQA1 gene polymorphisms, though with inconsistent findings. Although, previous meta-analyses were published in 2018 for the HLA-DQA1 rs2187668 SNP, 8 and in 2020 for the PLA2R rs4664308 SNP,6,7 the literature search cut-off time in our study was fresher. Besides, to the best of our knowledge, this study was the first to summarize published results on PMN risk conferred by the following PLA2R SNPs, rs3749117, rs3749119, rs35771982, rs3828323, rs16844715, rs1511223, rs6757188, and rs2715918. In addition, while previous meta-analyses involved 7 to 11 studies, our meta-analysis included 27 reports which could provide a more comprehensive and accurate estimation of PLA2R and HLA-DQA1 SNPs influence on PMN risk. Moreover, we have integrated the results of 8 other SNPs which were not previously meta-analyzed, together with a meta-analysis of the PLA2R-rs4664308/HLA-DQA1-rs2187668 SNPs interaction effect on PMN risk. Furthermore, we assessed the between-studies heterogeneity by building univariate and multivariate models of meta-regression.
The present study revealed that the PLA2R rs4664308*A allele was associated with approximately 132% increase in PMN risk with a low level of between-studies heterogeneity. In addition, if the subgroup analysis displayed a stable association among all ethnic groups, meta-regression showed a negative correlation with albumin level in PMN patients. This peculiar finding indicates that the association with PMN risk is greater in patients with a deeper hypoalbuminemia. Hence, the rs4664308 SNP could as well influence the disease presentation and prognosis. Nevertheless, more studies are needed to accurately assess its impact on treatment response and PMN outcome.
Besides, the PLA2R rs3749117*T allele was associated with just over 2-fold increased risk of PMN. Nonetheless, there was a considerable amount of heterogeneity which could not be explained by ethnicity-subgroup analysis. Interestingly, meta-regression revealed an inverse correlation of the association strength with albumin level on the one hand, and a positive correlation with 24-hours proteinuria level on the other hand. Hence, the association between the rs3749117*T allele and PMN risk was rather noted in case of a more severe disease with lower levels of albumin and greater proteinuria. However, prognostic studies are needed to verify this particular result.
This study showed that the PLA2R rs3749119*C was associated with roughly 122% increased PMN risk. Nevertheless, there was a high between-studies heterogeneity and the predicted risk might fluctuate between 9% and 351% increase in PMN risk. Almost all included studies were performed in Asians, thus, subgroup analysis by ethnicity could not be useful. Conversely, meta regression revealed that the effect size was negatively correlated with albumin level. This finding indicated that the association of the rs3749119*C allele with PMN risk was greater in patients with lower albumin level.
In the current study, the PLA2R rs35771982*G allele was associated with approximately 2.44-fold higher PMN risk. The heterogeneity was moderate and the true effect in 95% of comparable populations could vary from 1.76 to 3.39 times. Subgroup analysis by ethnicity was of no help as most include studies were carried out in Asian populations. Inversely, meta-regression showed negative correlations of the association strength with albumin and eGFR levels and a positive correlation with 24-hours proteinuria amount. Therefore, the association of the rs35771982*G allele with PMN risk was rather observed in case of severe disease with lower albumin and eGFR levels and higher 24-hours proteinuria. However, the rs35771982 impact on disease presentation and outcome has to be assessed in future studies.
Besides, the combined analysis revealed a 65% increase in PMN risk conferred by the PLA2R rs3828323*C allele. Between-studies heterogeneity was moderate and true effect could fall between 44% and 89% increased PMN risk. While subgroup analysis did not show any cross-ethnic disparity, meta-regression unveiled a negative correlation of the association strength with albumin level and a positive correlation with 24-hours proteinuria extent. This finding indicated that the rs3828323*C allele effect on PMN risk could be greater in case of severe disease with lower albumin level and higher 24-hours proteinuria level.
In this study, the PLA2R rs16844715*C allele was associated with approximately 2.32 times increased PMN risk and no between-studies heterogeneity was noted. Of note only 5 studies were included in the rs16844715 SNP meta-analysis. Hence, further studies examining the influence of this SNP on PMN risk are needed.
Integrated analysis showed a 62% increase in PMN risk conferred by the PLA2R rs1511223*A allele, though with a significant amount of heterogeneity. Thus, the true effect in 95% of comparable populations could vary between a 3% decrease and 170% increase in PMN risk. As most of included studies were performed in Caucasian populations, subgroup analysis by ethnicity was not informative. Interestingly, the protective C allele frequency in control groups was negatively correlated with the effect size. Hence, the association between the rs1511223 and PMN risk seemed to be rather noted in populations with lower frequency of the protective C allele.
In the present study, the PLA2R rs6757188 SNP was not found to be associated with PMN risk, with though an important amount of between-studies heterogeneity. Therefore, the true effect could fall between 52% decrease and 54% increase in PMN risk. Subsequent subgroup analysis by ethnicity did not provide the analysis with useful information about heterogeneity sources. Conversely, the protective C allele frequency in control groups was positively correlated with the strength of the association with susceptibility to PMN. Of note, only 6 studies were included in the rs6557188 SNP meta-analysis. Thus, studies on independent and large cohorts are required to better evaluate the influence of the rs6557188 on PMN risk.
In this study, only 4 reports were included in the PLA2R rs2715918 SNP meta-analysis. The A allele was associated with 163% increased PMN risk. Nonetheless, a substantial amount of between-studies heterogeneity was noted, and the true effect could fall between 73% decrease and 432% increase in PMN risk. As all included studies were carried out in Asian populations subgroup analysis by ethnicity could not be informative on heterogeneity sources. Inversely, meta-regression revealed significant correlation of the effect size with gender ratio, the A minor allele frequency in control groups, and the 24-hours proteinuria level. Hence, and like for other studied SNPs, the strength of the association with PMN risk could be influenced by disease severity in the selected patient groups as well as other clinical and biological features.
Besides, the combined analysis revealed that the HLA-DQA1 rs2187668*A allele conferred 3.11-fold higher PMN risk. However, the between-studies heterogeneity was important, and the true effect in 95% of comparable populations could vary between 1.5- and 6.29-fold higher PMN risk. Subgroup analysis revealed the PMN risk conferred by the A allele was significantly higher in Caucasians (≈4) comparatively to Asians (2.537). In addition, meta-regression showed significant correlations of the effect size with albumin, 24-hours proteinuria, serum creatinine, and eGFR levels. Thus, the risk of PMN conferred by the rs2187668*A allele was greater in patients with a more severe disease.
In the current study, we sought to summarize the PLA2R-rs4664308/HLA-DQA1-rs2187668 interaction influence on PMN risk. Unfortunately, only 3 studies15,25,27 reported genotype combinations in both patients and controls. The high-risk combination, rs4664308*A/A genotype associated with rs2187668*G/A or A/A, conferred 6.54-fold higher PMN risk when compared to all other combinations. Moreover, and when compared to the low-risk combination, the high-risk combination was associated with a 15.1-fold increase in PMN risk. Nevertheless, between-studies heterogeneity was significant. Hence, more studies are needed to better estimate the PLA2R/HLA-DQA1-interaction impact on susceptibility to PMN, and to more accurately investigate the sources of heterogeneity.
In summary, the present meta-analysis revealed that PLA2R and HLA-DQA1 SNPS could play a significant role in susceptibility to PMN. However, it is noteworthy to admit the substantial between studies heterogeneity for some studied SNPs. To the best of our knowledge, this study was the first to perform several meta-regressions in order to explore the aforementioned heterogeneity. Meta-regression provided the study with some interesting findings such as significant correlations with disease severity. However, there are some limitations that need to be acknowledged. Firstly, like other autoimmune disease, PMN risk depends on several factors such as environmental, infectious, psychological, and genetic factors, and as the present study analyses derived from pooling PLA2R and HLA-DQA1 SNPs aggregate findings without any access to raw data, there was a lack of further adjustment for baseline characteristics. Secondly, the majority of included studies were performed in Caucasians and Asians. Hence, the present meta-analysis results cannot be generalized to sub-Saharan-African and South-American populations. Thirdly, some of investigated SNPs included only a few numbers of studies and consequently require replication in independent large cohorts. Fourthly, only 3 study investigated the PLA2R-rs4664308/HLA-DQA1-rs2187668 interaction influence on PMN risk which prevented us from accurately analyzing the between-studies heterogeneity. Moreover, other gene-gene interactions could influence susceptibility to PMN which need further investigation in future studies.
Conclusion
This study demonstrated that several PLA2R and HLA-DQA1 SNPs as well as the PLA2R-rs4664308/HLA-DQA1-rs2187668 interaction could influence the susceptibility to PMN. However, more studies in independent cohorts are needed, mainly in Sub-Saharan African and South-American populations to further validate the results of the present meta-analysis.
Supplemental Material
sj-docx-1-bmi-10.1177_11772719241259602 – Supplemental material for Association of 10 Polymorphisms in PLA2R1 and HLA DQA1 Genes with Primary Membranous Nephropathy Risk: A Meta-Analysis and a Meta-Regression
Supplemental material, sj-docx-1-bmi-10.1177_11772719241259602 for Association of 10 Polymorphisms in PLA2R1 and HLA DQA1 Genes with Primary Membranous Nephropathy Risk: A Meta-Analysis and a Meta-Regression by Tarak Dhaouadi, Awatef Riahi, Taïeb Ben Abdallah, Yousr Gorgi and Imen Sfar in Biomarker Insights
Supplemental Material
sj-docx-2-bmi-10.1177_11772719241259602 – Supplemental material for Association of 10 Polymorphisms in PLA2R1 and HLA DQA1 Genes with Primary Membranous Nephropathy Risk: A Meta-Analysis and a Meta-Regression
Supplemental material, sj-docx-2-bmi-10.1177_11772719241259602 for Association of 10 Polymorphisms in PLA2R1 and HLA DQA1 Genes with Primary Membranous Nephropathy Risk: A Meta-Analysis and a Meta-Regression by Tarak Dhaouadi, Awatef Riahi, Taïeb Ben Abdallah, Yousr Gorgi and Imen Sfar in Biomarker Insights
Footnotes
Acknowledgements
This study was granted and supported by the Research Laboratory in Immunology of Renal Transplantation and Immunopathology (LR03SP01), Charles Nicolle Hospital, Tunis El Manar University, Tunisia.
Abbreviations
Ab: antibody
eGFR: estimated glomerular filtration rate
HIV: human immunodeficiency virus
HLA: human leukocyte Antigen
MAF: minor allele frequency
NOS: Newcastle-Ottawa Scale
PI: prediction interval
PLA2R: phospholipase A2 receptor
PMN: primary membranous nephropathy
SMN: secondary membranous nephropathy
Declarations
Supplemental Material
Supplemental material for this article is available online.
References
Supplementary Material
Please find the following supplemental material available below.
For Open Access articles published under a Creative Commons License, all supplemental material carries the same license as the article it is associated with.
For non-Open Access articles published, all supplemental material carries a non-exclusive license, and permission requests for re-use of supplemental material or any part of supplemental material shall be sent directly to the copyright owner as specified in the copyright notice associated with the article.