
Abstract
Introduction:
Although, several studies have assessed the association of HLA Class I and II genes with inclusion body myositis (IBM), results were inconsistent and between-studies heterogeneity needs to be investigated.
Objectives:
The aim of this review was to summarize existing data on the contribution of HLA-DRB1 and HLA-B alleles to IBM susceptibility and to investigate the between-studies heterogeneity by subgroup analyses and meta-regressions.
Design:
This study was performed according to the PRISMA guidelines for systematic reviews and meta-analyses.
Methods:
An electronic literature search for eligible studies among all papers published prior to January 29, 2025, was conducted through PubMed, EMBASE, Web of science, and Scopus databases. Meta-analyses together with subgroup analyses and meta-regressions were performed for the two following HLA genes: HLA-DRB1 and HLA-B.
Results:
Combined analyses revealed a significant increase in IBM risk conferred by the HLA-DRB1*03 allele (9.21 (7.05–12.01)), the DRB*03:01 allele (8.44 (6.85–10.41)), the DRB1*01 allele (2.31 (1.82–2.93)), the DRB1*01:01 allele (2.63 (1.95–3.55)), the DRB1*15:02 allele (3.49 (2.12–5.75)), the B*08 allele (4.05 (2.58–6.38)), and the DQB1*02 allele (6.62 (4.5–9.74)), all p-values < 0.001. In addition, the DRB1*15:01 allele was found to be protective against IBM in all populations (0.48 (0.32–0.72)). Conversely, the DRB*11 allele was not associated with IBM risk, OR (95% CI) = 0.91 (0.54–1.51), p = 0.703.
Conclusion:
This meta-analysis demonstrated that HLA-DRB1, DQB1, and B loci could play a major role in IBM pathogenesis.
Registration:
This review has been registered on PROSPERO on June 25, 2024: CRD42024557948, Available from: https://www.crd.york.ac.uk/prospero/display_record.php?ID=CRD42024557948
Introduction
Sporadic inclusion body myositis (IBM) is the most common acquired myopathy occurring in subjects over the age of 50 years.1–3 Clinically, IBM is characterized by slowly progressive asymmetric weakness and atrophy of the proximal and distal muscles, mainly involving the quadriceps femoris and finger flexors.1–3 Pathological characteristics of IBM include both inflammatory and myodegenerative features.1–3 Hence, regarding the clinical and histological features, sporadic IBM displays some overlap with hereditary inclusion body myopathy, making differential diagnosis difficult. 3
Whether IBM is primarily an autoimmune or a degenerative disease with secondary triggered inflammation remains indeterminate.1,2 The presence of antibody to cytosolic 5′-nucleotidase 1A (anti-cN-1A Ab) in roughly 30%–60% of IBM cases4,5 as well as invading CD8+ T cells of health-appearing myofibers 1 suggests an immune-mediated component to disease pathogenesis. In addition, overexpression of HLA class I 6 and class II 7 in the myofibers of IBM patients provides further evidence for the autoimmune-origin hypothesis. However, the lack of response to conventional immunosuppressive treatments and the association with ageing support the possibility of a primarily degenerative disease. 1 Some authors hypothesized that the lack of response to immunosuppression might be due to impaired autophagic processes which result in rimmed vacuole formation and buildup of misfolded proteins. 2
Besides, multiple genetic factors seem to play important role during the development and the pathogenesis of sporadic IBM. 3 Due to the rarity of the disease, robust unbiased genome-wide association studies have not yet been completed in IBM. 1 Yet, several case/control studies examined susceptibility alleles inside and outside the HLA region.1–3 No loci outside the HLA region reached genome wide significance. 1 Conversely, the HLA 8.1 ancestral haplotype (8.1 AH); which includes A1, B8, DR3, and DQ2 alleles; was associated with IBM risk in Caucasian but not in Japanese. 1 However, no HLA allele was found to modify disease onset, severity or the presence of anti-cN-1A Ab.1,2 Moreover, the strength of the association of HLA risk alleles with susceptibility to IBM varied noticeably in previous studies. Hence, between-studies inconsistency needs to be extensively investigated.
The aim of this review was to summarize existing data on the contribution of HLA class I and class II alleles to IBM susceptibility and to investigate the between-studies heterogeneity by subgroup analyses and meta-regressions.
Material and methods
Search strategy
This study was performed according to the PRISMA guidelines for systematic reviews and meta-analyses. 8 An electronic literature search for eligible studies among all papers published prior to January 29, 2025, was conducted through PubMed, EMBASE, Web of science and Scopus databases. The following search string was used: ((Inclusion body myositis) AND ((HLA) OR (Human Leukocyte Antigen) OR (MHC) OR (Major Histocompatibility Complex) OR (6p21))). The literature search was carried out without any language restriction.
Selection criteria
All studies were independently assessed and evaluated by two reviewers (Tarak Dhaouadi, T.D. and Imen Sfar, I.S.) for the inclusion and the exclusion. The following selection criteria were adopted: Inclusion criteria:
Studies of case-control (retrospective) or cohort (prospective) design.
Studies assessing the association between HLA class I and class II alleles, and IBM risk.
Studies providing precise results with alleles and or haplotypes frequencies.
Exclusion criteria:
Studies carried out in patients with polymyositis, dermatomyositis and immune-mediated necrotizing myopathy.
Studies performed in patients with hereditary inclusion body myopathy.
Case series of subjects, narrative or systematic review, comments, or meta-analysis.
If many studies have been carried out using duplicate cases, only the study with complete data and the largest sample size was included.
Definition of inclusion body myopathy
Inclusion body myositis was defined as weakness and atrophy of muscles including quadriceps femoris and/or finger flexors, associated with specific pathological findings: (1) numerous rimmed vacuoles in atrophic muscle fibers, (2) a perivascular and endomysial inflammatory infiltrate, (3) CD8+ T cells surrounding and invading morphologically healthy muscle fibers in immunohistochemistry, and (4) a widespread HLA class I expression in morphologically healthy muscle fibers.4,5
Data extraction
Data were extracted using a predeveloped form and entered in an Excel datasheet. Two investigators (T.D. and I.S.) independently extracted the following information: (1) first author, (2) year of publication, (3) country, (4) ethnicity, (5) mean or median age, (6) mean or median onset age, (7) gender ratio (M/F), (8) number of patients, (9) number of controls, (10) associated autoimmune disease, and (11) HLA class I and class II genotyping method (Table 1). A third investigator (Awatef Riahi) compared the results of the extracted data for potential discrepancies.
Included studies characteristics.

AID: autoimmune disease including: (1) thyroid disease, (2) rheumatoid arthritis, (3) type I diabetes mellitus, (4) Sjögren syndrome, (5) psoriasis, (6) vitiligo, (7) sarcoidosis, (8) celiac disease, and (9) ulcerative colitis.
NS: not specified.
Quality assessment
The quality of eligible studies was assessed independently by two reviewers (T.D. and I.S.) using the Newcastle-Ottawa Scale (NOS). 9 This quality-assessment scale is based on the following three general categories: (1) selection (4 points), (2) Comparability of the study groups (2 points), and (3) ascertainment of outcome (3 points). Studies with a score ≥7 were classified as high-quality reports. Additionally, risk of bias was assessed for each included study through a generic form (Excel spreadsheet) and visualized via the Cochrane ROBVIS online tool (https://mcguinlu.shinyapps.io/robvis/). Two additional independent reviewers (Taieb Ben Abdallah and Yousr Gorgi) examined the quality-assessment results.
Study endpoints
The primary endpoint of this meta-analysis was to estimate the strength of the association HLA class I and class II, alleles and IBM risk. The secondary endpoint was to evaluate potential confounding factors that might influence the impact of the HLA alleles on IBM risk in order to identify the sources of heterogeneity.
Statistical analysis
Statistical analysis was carried out using the Cochrane Review Manager 5.4 software, the OpenMeta-Analyst software and the online available software MetaGenyo (https://metagenyo.genyo.es/). The associations of HLA-DRB1, HLA-B, and HLA-DQB1 alleles with IBM risk were assessed using pooled Odds Ratios (ORs) with the 95% confidence interval (95% CI). The statistical significance of pooled ORs was tested by Z-test with a threshold of significance set at 0.05. Random effects models (DerSimonian-Laird) were used as recommended by Borenstein. 10 Indeed, as long as the eligible studies were carried out in genetically diverse populations, the random-effects model applies. 10 Forest-plots were generated to display the distribution of effect size (OR) across included studies. Sensitivity analyses were carried out to test the results stability by omitting sequentially each individual study. The heterogeneity of between-studies was tested by Q test (significance threshold: 0.1), quantified via I2 calculation (proportion of true effects variance) and analyzed through the determination of 95% prediction intervals (PI). PI were obtained through the CMA Prediction Intervals free software. The calculation of the 95% PI was based on the following four items: (1) OR, (2) upper bound of 95% CI, (3) Tau2, and (4) number of included studies. Of note, 95% PI computation requires at least three included studies in a meta-analysis. Permission to use the CMA prediction intervals has been obtained since March 21, 2023 (Figure S1). Subsequently, the heterogeneity was explored for potential sources by subgroup analyses and meta-regressions. Briefly, studies were stratified by ethnicity (Caucasian and East-Asian) and meta-regressions were performed using age, onset age, gender ratio (Male/Female), and the risk allele frequency in control groups as independent variables. Both univariate and multivariate models of meta-regression were generated in order to assess the presence of potential confounding factors. In order to quantify the statistical reliability of data in the cumulative meta-analysis, Trial Sequential Analyses (TSA) were performed using the R Studio free software through the RTSA package (https://cran.r-project.org/web/packages/RTSA/index.html). Publication bias were assessed by Egger’s test and visualized through the generation of funnel plots. Of note, Egger’s test p-value computation requires at least three included studies in a meta-analysis.
A Supplemental File 1 with additional tables and figures is available with the full-manuscript. A PRISMA checklist is available as a Supplemental File 2.
Systematic review registration
This review has been registered on PROSPERO on June 25, 2024: CRD42024557948, Available from: https://www.crd.york.ac.uk/prospero/display_record.php?ID=CRD42024557948
Results
Search results and study characteristics
A PRISMA flow diagram was generated to depict the study selection process (Figure 1). Overall, 12 studies with a total of 1028 IBM cases and 25,259 healthy controls were included in the present study.11–22 The characteristics of included studies are summarized in Table 1. The frequencies of the following HLA-DRB1, HLA-B, and HLA-DQB1 in patients and controls are shown in tables S1, S2, S3, S4, S5, S6, S7, S8, and S9: (1) DRB1*03 allele, (2) DRB1*03:01 allele, (3) DRB1*01 allele, (4) DRB1*01:01 allele, (5) DRB1*11 allele, (6) DRB1*15:01 allele, (7) DRB1*15:02 allele, (8) B*08 allele, and (9) DQB1*02 allele. Eleven studies were included for the DRB1*03 allele,11–19,21,22 7 for the HLA-DRB1*03:01 allele,13,16–19,21,22 8 for the DRB1*01 allele,11–13,15,17,18,20,21 5 for the DRB1*01:01 allele,13,17,18,20,21 7 for the DRB1*11 allele,11,13,15,17,18,20,21 4 for the DRB1*15:01 allele,17,18,20,21 4 for the DRB1*15:02 allele,17,18,20,21 5 for the B*08 allele,11,12,14,15,21 and 3 for the DQB1*02 allele.11,13,21 The NOS quality score results for each included study are shown in Table 1. Risks of bias are summarized in Figure 2.

PRISMA flow diagram for study selection.
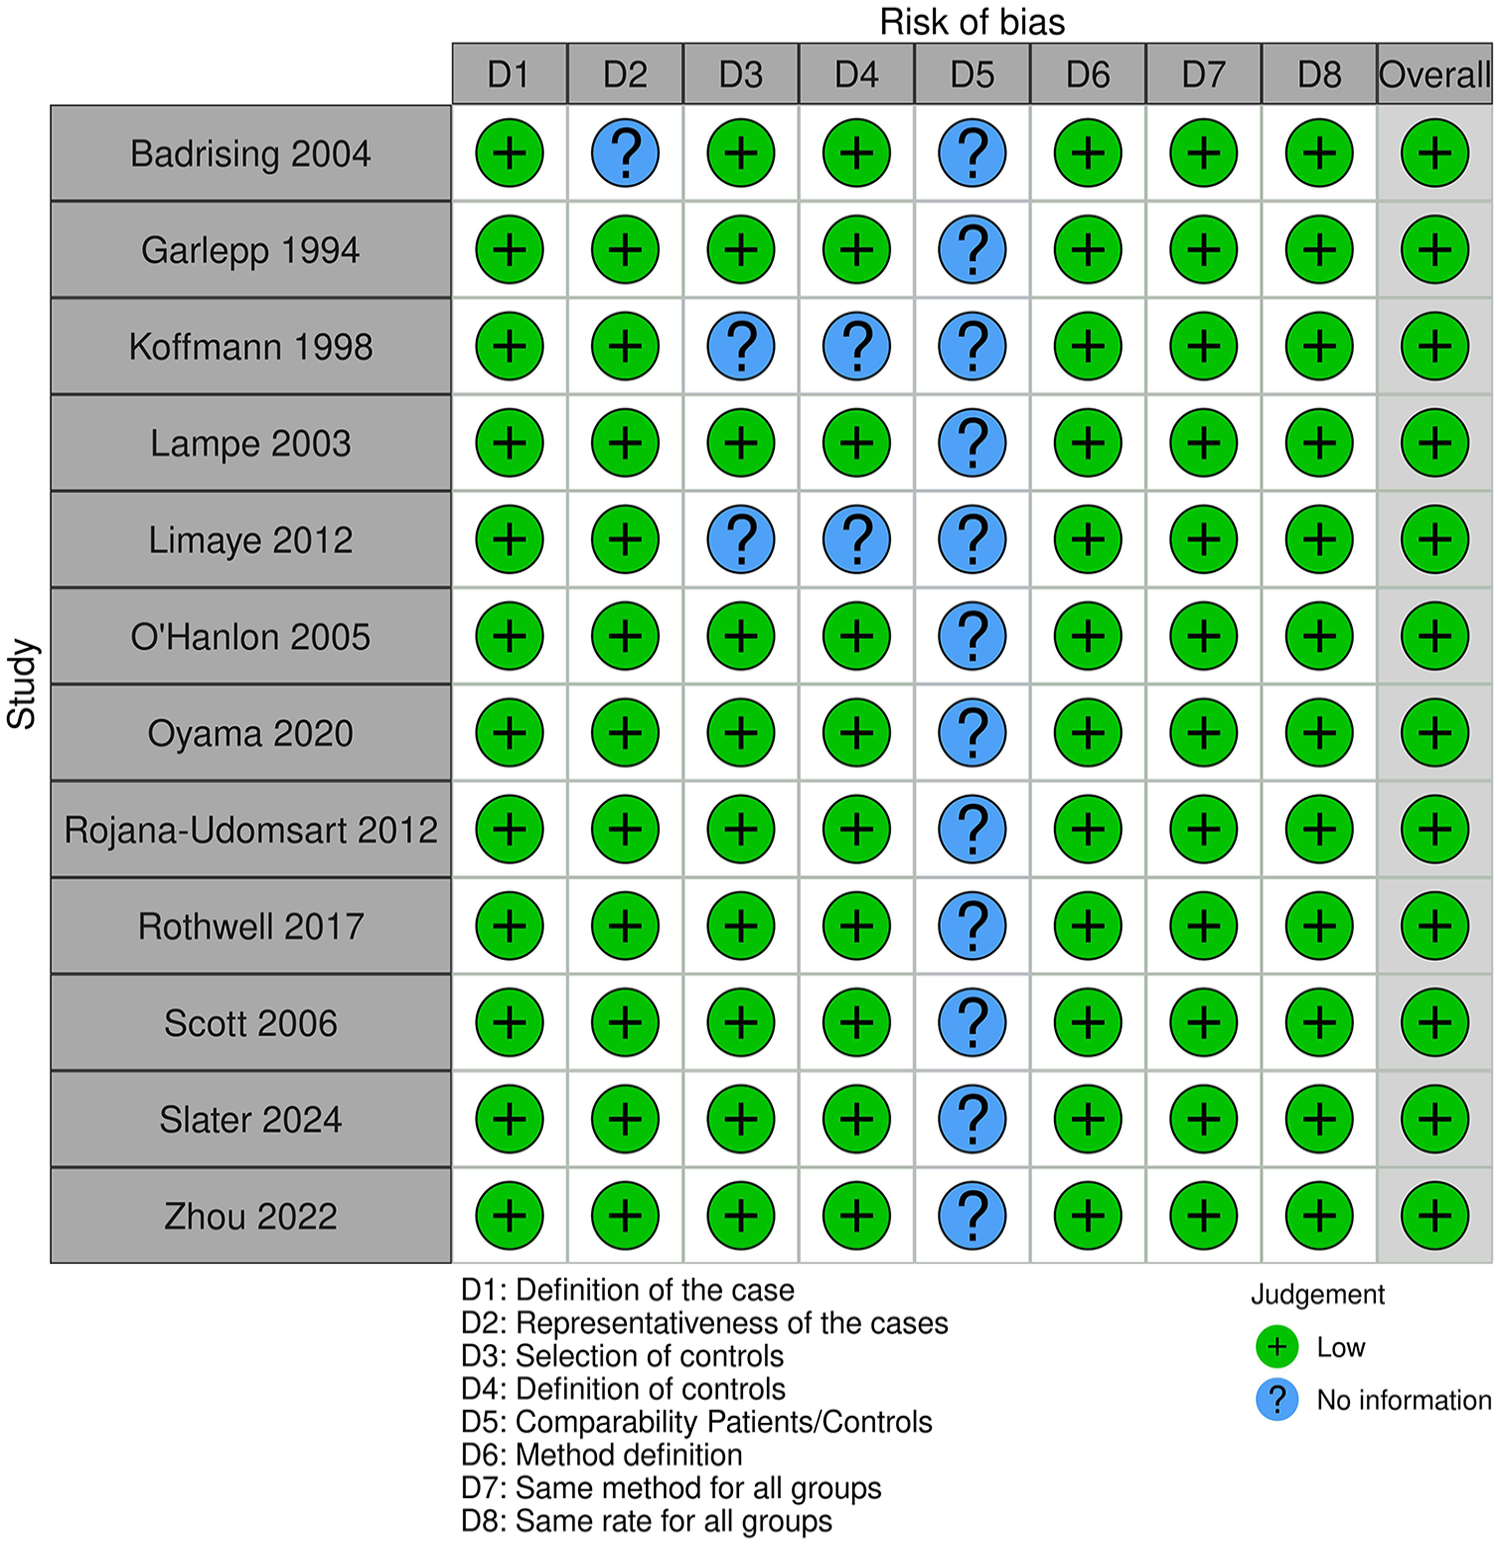
Summary of study risk of bias.
HLA-DRB1*03 allele meta-analysis
The HLA-DRB1*03 allele was significantly associated with increased IBM risk, OR (95% CI) = 9.21 (7.06–12.02), p < 1 E-10 (Table 2) (Figure 3). Nevertheless, there was a moderate level of between-studies heterogeneity, I2 = 49%, Tau2 = 0.0844, 95% PI = (4.52–18.79) and p = 0.03. Subgroup analysis by ethnicity could not be performed because there was only one study from the Asian subgroup. Subsequent meta-regression revealed a significant negative correlation of the effect size with the DRB1*03 allele frequency in control groups rate, p = 0.028 (Table S10) (Figure S2). Conversely, the effect size was not correlated with age, onset age, or gender-ratio (M/F) (Table S10) (Figure S3). Trial sequential analysis revealed that the DRB1*03 allele meta-analysis result is stable with no need for further studies in the future (Figure 4).
Main results of HLA-DRB1 and HLA-B associations with IBM risk.


Forest plot for the association between the HLA-DRB1*03 allele and IBM risk.

Trial sequential analysis for the DRB1*03 allele.
HLA-DRB1*03:01 allele meta-analysis
The integrated analysis revealed a significant association between the DRB1*03:01 allele and susceptibility to IBM, OR (95% CI) = 8.44 (6.85–10.41), p < 1 E-10 (Table 2) (Figure 5). In addition, the heterogeneity between included studies was low, I2 = 12%, Tau2 = 0.0098, 95% PI = 5.8–12.28), p = 0.34. Since there was only one study from the Asian subgroup, subgroup analysis by ethnicity could not be performed. Besides, meta-regression did not reveal any significant correlation of the effect size with age, onset age, gender-ratio (M/F) and the DRB1*0301 allele frequency in control groups (Table S11) (Figure S4). Subsequent TSA showed that the required sample size for the DRB1*0301 allele meta-analysis is reached (Figure 6).
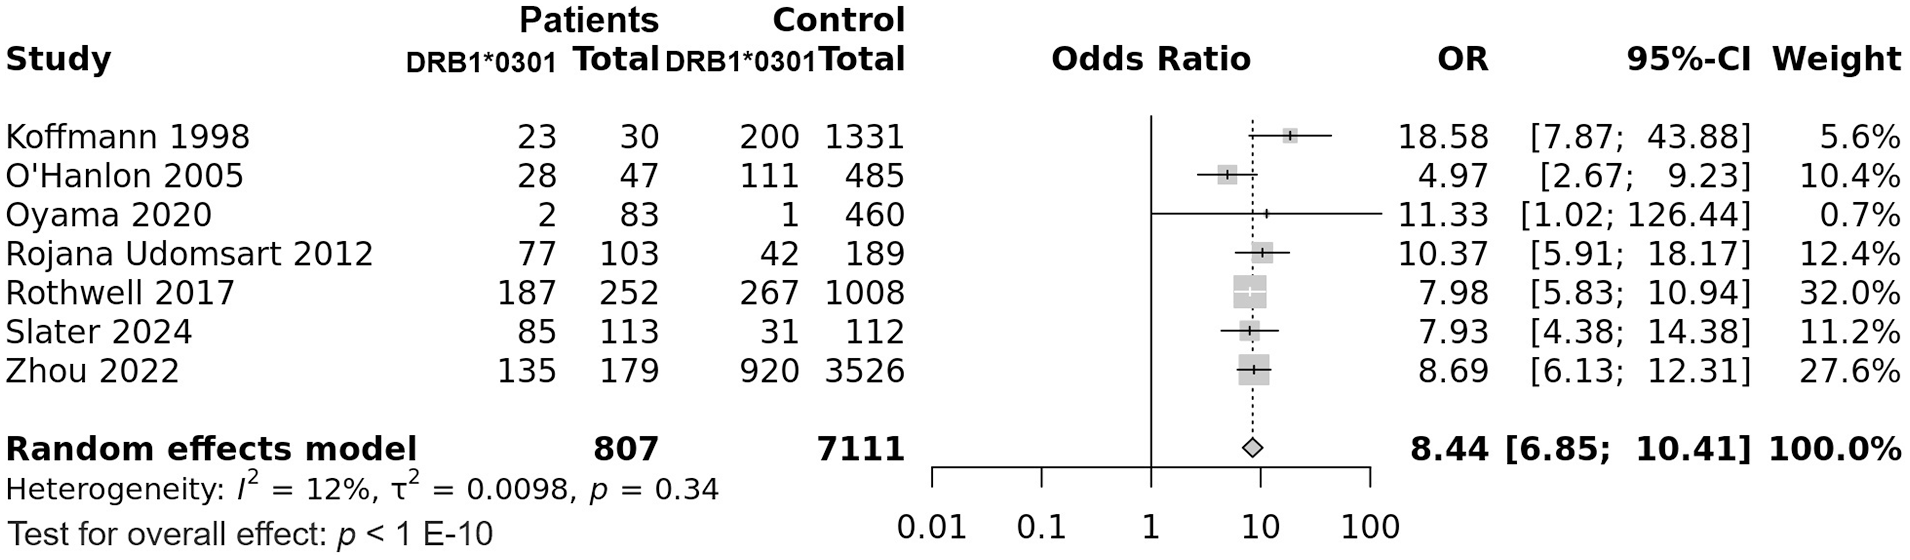
Forest plot for the association between the HLA-DRB1*03:01 allele and IBM risk.

Trial sequential analysis for the DRB1*03:01 allele.
HLA-DRB1*01 allele meta-analysis
The DRB1*01 allele was significantly associated with increased IBM risk, OR (95% CI) = 2.31 (1.82–2.93), p < 1 E-10 (Table 2) (Figure 7). Of note, there was no between-studies heterogeneity, I2 = 0%, Tau2 = 0, 95% PI = (1.82–2.93) and p = 0.704. Subgroup analysis by ethnicity did not show any difference regarding the effect size between East-Asian and Caucasian populations (Tables S12 and S13) (Figure S5). Similarly, meta-regression did not reveal any significant correlation of the effect size with patients age, gender-ratio (M/F) or the DRB1*01 allele frequency in control groups (Table S13) (Figure S6). Trial sequential analysis revealed that the DRB1*01 allele meta-analysis result is stable with no need for further studies in the future (Figure 8).

Forest plot for the association between the HLA-DRB1*01 allele and IBM risk.

Trial sequential analysis for the DRB1*01 allele.
HLA-DRB1*01:01 allele meta-analysis
Combined analysis showed a significant association of the DRB1*0101 allele with susceptibility to IBM, OR (95% CI) = 2.63 (1.95–3.55), p = 2 E-10 (Table 2) (Figure 9). In addition, there was a very low level of between-studies heterogeneity, I2 = 3%, Tau2 = 0.004, 95% PI = (1.56–4.46), p = 0.388. Subgroup analysis by ethnicity revealed that the association remained significant only in Caucasians (OR (95% CI) = 2.28 (1.45–3.58), p = 1.4 E-6), but not in East-Asians (OR (95% CI) = 2.35 (0.89–6.17), p = 0.089)) (Tables S14 and S15) (Figure S7). Equally, meta-regression did not show any significant correlation of the effect size with patients age, gender-ratio (M/F) or the DRB1*01:01 allele frequency in control groups (Table S15) (Figure S8). Subsequent TSA showed that the required sample size for the DRB1*0301 allele meta-analysis is reached (Figure 10).

Forest plot for the association between the HLA-DRB1*01:01 allele and IBM risk.

Trial sequential analysis for the DRB1*0101 allele.
HLA-DRB1*11 allele meta-analysis
The DRB1*11 allele was not associated with susceptibility to IBM, OR (95% CI) = 0.91 (0.54–1.51), p = 0.703 (Table 2) (Figure 11). Besides there was a moderate level of between-studies heterogeneity, I2 = 42%, Tau2 = 0.1933, 95% PI = (0.25–3.38), p = 0.11. Subgroup analysis by ethnicity did not show any significant association (Table S16 and S17) (Figure S9). Subsequent meta-regression revealed a significant negative correlation of the effect size with the DRB1*11 allele frequency in control groups, p = 0.018 (Table S17) (Figure S10). Inversely, the risk of IBM conferred by the DRB1*11 allele was not correlated with age or gender-ratio (M/F) (Table S17) (Figure S10). Trial sequential analysis showed, after adjustment by Tau2, that 914 participants are additionally required in total split over at least 2 studies (Figure 12).

Forest plot for the association between the HLA-DRB1*11 allele and IBM risk.

Trial sequential analysis for the DRB1*11 allele.
HLA-DRB1*15:01 allele meta-analysis
In this meta-analysis only four studies were included for assessing the DRB1*15:01 allele in IBM genetic predisposition. Pooled analysis showed a significant decrease in IBM risk conferred by the DRB1*15:01 allele, OR (95% CI) = 0.48 (0.32–0.72), p = 3.1 E-4 (Table 2) (Figure 13). In addition, there was no between-studies heterogeneity, I2 = 0%, p = 0.774. Subgroup analysis by ethnicity revealed that the decreased IBM risk conferred by the DRB1*15:01 allele was significant only in Caucasians (0.43 (0.26–0.1)), p = 8.4 E-4 (Table S18) (Figure S11). Besides, meta-regression did not show any significant correlation of the effect size with patients age, gender-ratio (M/F) or the DRB1*15:01 allele frequency in control groups (Table S19) (Figure S12). Subsequent TSA showed that the required sample size for the DRB1*1501 allele meta-analysis is reached (Figure 14).

Forest plot for the association between the HLA-DRB1*15:01 allele and IBM risk.

Trial sequential analysis for the DRB1*15:01 allele.
HLA-DRB1*15:02 allele meta-analysis
Only four studies examined the influence of the HLA-DRB1*15:02 allele on susceptibility to IBM. Combined analysis showed a significant association of the DRB1*15:02 allele with increased IBM risk, OR (95% CI) = 3.49 (2.12–5.75), p = 9.4 E-7 (Table 2) (Figure 15). Of note, there was a moderate amount of between-studies heterogeneity, I2 = 32%, Tau2 = 0.0809, 95% PI = (0.68–18.04), p = 0.22. Subgroup analysis by ethnicity revealed that the increased IBM risk conferred by the DRB1*15:02 allele was significant only in East-Asian (3.8 (2.05–7.07)), p = 2.4 E-5 (Table S20) (Figure S13). Besides, meta-regression did not show any significant correlation of the effect size with patients age, gender-ratio (M/F) or the DRB1*15:02 allele frequency in control groups (Table S21) (Figure S14). Trial sequential analysis revealed that the required sample size for the DRB1*1502 allele meta-analysis is reached (Figure 16).

Forest plot for the association between the HLA-DRB1*15:02 allele and IBM risk.

Trial sequential analysis for the DRB1*15:02 allele.
HLA-B*08 allele meta-analysis
All included studies for the influence of the HLA-B*08 allele on IBM risk were performed in Caucasian populations. This allele was significantly associated with increased IBM risk, OR (95% CI) = 4.05 (2.58–6.38), p = 1 E-6 (Table 2) (Figure 17). However, there was a considerable amount of heterogeneity between included studies, I2 = 51%, Tau2 = 0.1297, % PI = (1.04–15.86), p = 0.09. Subsequent meta-regressions revealed significant positive correlations of the effect size with gender-ratio (M/F) and the B*08 allele frequency in control groups, p = 0.021 and p = 0.005, respectively (Table S22) (Figure S15). Subsequent TSA showed that the required sample size for the B*08 allele meta-analysis is reached (Figure 18).

Forest plot for the association between the HLA-B*08 and IBM risk.

Trial sequential analysis for the B*08 allele.
HLA-DQB1*02 allele meta-analysis
All three included studies which assessed the impact of the HLA-DQB1*02 allele on IBM risk were performed in Caucasian populations. This allele was significantly associated with increased IBM risk, OR (95% CI) = 6.62 (4.5–9.74), p < 1 E-10 (Table 2) (Figure 19). Of note, there was no between-studies inconsistency, I2 = 0%, Tau2 = 0, 95% PI = 4.5–9.74, p = 0.92. Besides, meta-regressions did not show any significant correlation of the effect size with the DQB1*02 allele frequency in control groups, p = 0.872. Trial sequential analysis revealed that the required sample size for the DRB1*1502 allele meta-analysis is reached (Figure 20).

Forest plot for the association between the HLA-DQB1*02 and IBM risk.
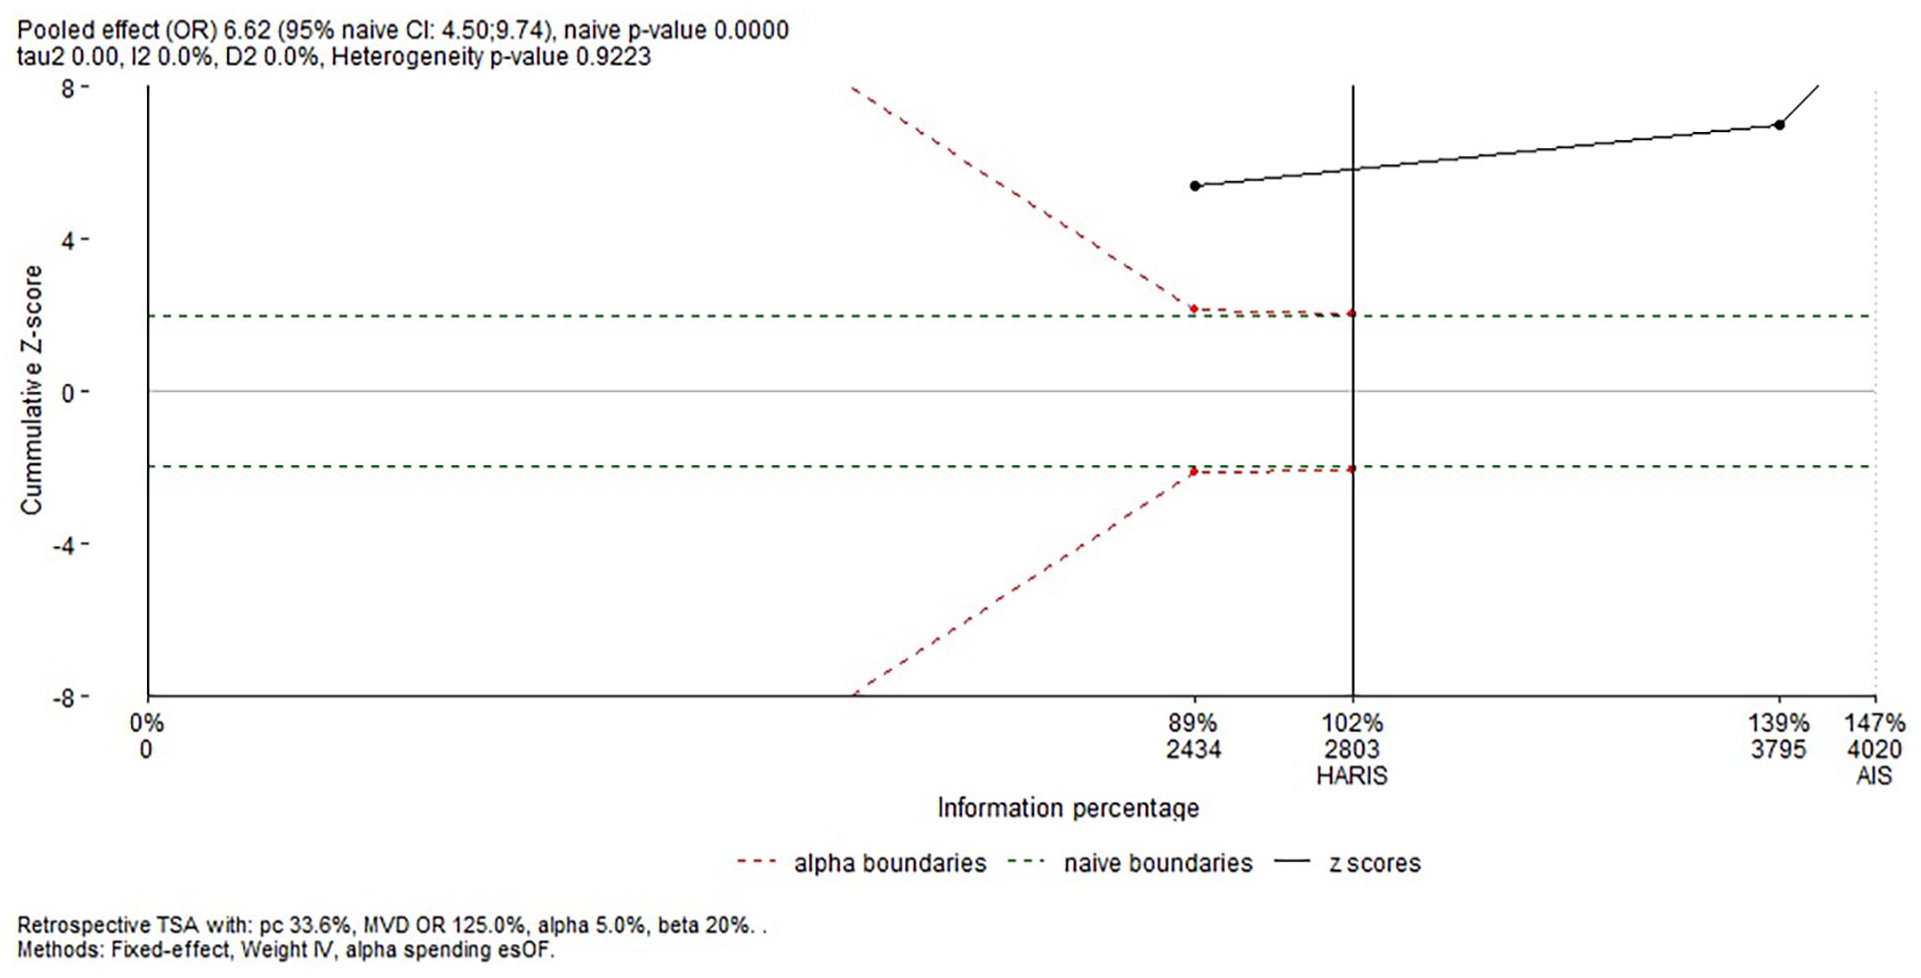
Trial sequential analysis for the DQB1*02 allele.
Sensitivity analysis
The sensitivity analysis revealed that association results were stable for all performed meta-analyses (Figures S16, S17, S18, S19, S20, S21, S22, S23, and S24), suggesting a high level of integrity with reliable results.
Publication bias
Generated funnel plots (Figure 21) were found to be overall roughly symmetrical and Egger’s tests confirmed these findings with non-significant p-values for all investigated HLA class I and class II alleles (0.1803, 0.5726, 0.4962, 0.3195, 0.9841, 0.0915, 0.8377, 0.7146, and 0.2027), which indicated that results were not weakened by publication biases.

Funnel plots assessing publication bias: Symmetrical funnel plots with no evidence of publication biases. (a) HLA-DRB1*03 allele. (b) HLA-DRB1*03:01 allele. (c) HLA-DRB1*01 allele. (d) HLA-DRB1*01:01 allele. (e) HLA-DRB1*11 allele. (f) HLA-DRB1*15:01 allele. (g) HLA-DRB1*15:02 allele. (h) HLA-B*08 allele. (i) HLA-DQB1*02 allele.
Overall, the HLA-DRB1*03, the DRB*03:01, the DRB1*01, the DRB1*01:01, the DRB1*15:02, the B*08 and the DQB1*02 alleles conferred a significant increase in IBM risk. Conversely, the DRB1*15:01 allele had a protective role against IBM predisposition. Besides, the DRB*11 allele did not exhibit any significant role in IBM risk.
Discussion
The simultaneous presence of inflammatory and degenerative features in IBM is still a matter of debate as to which is the cause of the disease.23–29 Indeed, IBM muscle undergoes three major histological changes including degenerative processes, mitochondrial abnormalities and inflammatory features.25–29 However, recent data suggest that autoimmune inflammation drives the IBM disease pathogenesis.23–30 Indeed, it has been proposed that a yet to determine stimuli induce endomysial infiltration of CD8+ T cells, resulting in pro-inflammatory cytokine release. 30 Consequently, pro-inflammatory milieu promotes evolving of autoreactive B cells into plasma cells, which leads to autoantibodies production, mainly anti-cN-1A Ab. 24 The pathogenic role of anti-cN-1A Ab is still unknown. Nevertheless, C57BL6 mice immunization against cN-1A led to weight loss and decreased motor activity associated with pathological features of IBM including surrounding or invading CD8 T cells into myofibers and abnormal protein aggregates. 26 This peculiar finding in mice, which supports the pathogenicity of anti-cN-1A Ab, strengthen the autoimmune hypothesis of IBM pathogenesis.
Like other inflammatory autoimmune diseases, IBM etiology is complex including multigenetic background and environmental factors.1–3,24 Among genetic factors, HLA class I and II genes were the most associated with IBM risk. In fact, over the past three decades several studies focused on HLA-A, HLA-B, HLA-DRB1, HLA-DQB1, and HLA-DQA1 gene polymorphisms, though with inconsistent findings.11–22 To the best of our knowledge, this study was the first to summarize published results on IBM risk conferred by HLA-DRB1, HLA-B, and HLA-DQB1 alleles. Furthermore, we assessed the between-studies heterogeneity by subgroup analyses and building univariate and multivariate models of meta-regression. Moreover, TSA were performed in order to assess the results stability.
The present study revealed that the HLA-DRB1*03 allele was associated with approximately a 9.2-fold increase in IBM risk, though with a moderate level of between-studies heterogeneity. Therefore, the effect size could vary from 4.5- to 18.8-fold increased disease risk in 95% of comparable populations. In order to explore this heterogeneity, subgroup analysis and meta-regressions were carried out. Subgroup analysis by ethnicity did not provide the study with an explanation regarding the between-studies inconsistency. Of note, only one study from an East-Asian population (Japanese) was included in DRB1*03 allele meta-analysis. 17 In this aforementioned study, only 2 out of 83 patients, and 1 out of 460 control subjects carried the DRB1*03 allele. Moreover, in another study carried out in a Japanese population, 20 the DRB1*03 allele was absent in both IBM patients and controls. Hence, the risk of IBM in East-Asians seems to be conferred by other HLA alleles, as will be discussed below. Observed inter-ethnic difference regarding the association strength could be due to different genetic background as well as disparate environmental factors. Besides, the risk of IBM conferred by the DRB1*03 allele was negatively correlated with its frequency in control groups. Thus, the association between the DRB1*01 allele and IBM risk was rather observed when this allele was less frequent in the general population. Conversely, the effect-size was not correlated with either patients age and gender-ratio. Since, the overwhelming majority of patients were elderly, the absence of correlation with the effect-size was expected. However, the non-correlation with the gender-ratio could be due the absence of a gender effect on IBM predisposition. This peculiar finding is not in accordance with the observed female-predominance in the mainstream of autoimmune diseases.
In this meta-analysis, the DRB1*03:01 allele conferred a roughly 8.4-fold increase in IBM risk. Heterogeneity between studies was low and the effect size could fall between 5.8- and 12.3-fold increase in IBM risk in 95% of comparable populations. Again, the DRB1*03:01 allele was extremely rare in East-Asians and seemed to confer an increased disease risk mainly in Caucasians. Interestingly, using a high-resolution HLA genotyping method, Slater et al. 21 refined 8.1 AH association with IBM to the DRB1*03:01:01 subtype. Indeed, taking into account the strong linkage disequilibrium within the HLA region and after conditioning upon the most strongly associated alleles, only the DRB1*03:01:01 retained its significant association with IBM risk. 21 Subsequently, the authors attributed the risk conferred by the DRB1*03:01:01 subtype to arginine at position 74. 21 Nevertheless, the effect of the DRB1*03:01:01 subtype was negated by concomitant carriage of a protective allele such as the DRB4*01:01:01 and the DQA1*01:02:01 alleles. This peculiar finding could explain the relative inconsistency between studies regarding the strength of the association with IBM risk as the frequency of these protective alleles may vary from one population to another. As for the DRB1*03 allele no correlation of the effect-size with age and gender-ratio was noted. Likewise, as IBM occurs mainly in elderly subjects the absence of correlation with age was predictable. The lack of correlation with gender-ratio suggests the absence of influence of hormonal factors.
This study showed that the DRB1*01 and DRB1*01:01 alleles were associated with roughly 2.3–2.6-fold increased IBM risk. Therefore, the association of the DRB1*01 allele with the susceptibility IBM is predominantly carried by the DRB1*01:01 allele. Furthermore, there was little to no between-studies heterogeneity and the predicted risk of IBM might fluctuate between 1.56- and 4.46-fold increase in 95% of comparable populations. Almost all included studies were performed in Caucasians, and only two studies were carried out in Japanese patients. The risk of IBM conferred by the DRB1*0101 allele retained its significance only in Caucasians. Hence, future studies are needed to estimate the effect of this allele on IBM risk in East-Asian populations. As for the DRB1*0301 allele, the association of the DRB1*0101 allele with IBM risk did not seem to be influenced by age or gender-ratio.
Besides, the combined analysis revealed that the DRB1*11 allele was not associated with susceptibility to IBM with though a significant between-studies heterogeneity. Subgroup analysis did not show any inter-ethnic significant difference. The effect size was negatively correlated with the DRB1*11 allele frequency in the general population. Nevertheless, as long as almost all included primary studies did not reveal any significant association, the DRB1*11 appeared to have little to no effect on susceptibility to IBM.
The present meta-analysis showed that while the DRB1*15:01 allele was associated with a halving of the IBM risk, the DRB1*15:02 allele conferred a roughly 3.5-fold increased IBM risk. Remarkably, if the DRB1*15:01 allele was more prevalent in Caucasians than in East-Asians, the DRB1*15:02 allele was more frequent in East-Asians comparatively to Caucasians.17,18,20,21 Hence, as the DRB1*1501 and *1502 alleles had opposite effects on IBM risk, and their respective frequencies considerably varied between Caucasians and East-Asians, it could explain the observed inter-ethnic disparity in the effect conferred by the DRB1*15 allele. At the protein level, DRB1*15:01 and DRB1*15:02 differ in only one amino acid at residue 86 (valine vs glycine) of the HLA-DR β-chain. 31 Hence, the observed opposite effects between DRB1*15:01 and 15:02 indicate that the glycine at position 86 might play an important role in target self-antigen recognition with a higher binding affinity.
This study showed that the HLA-B*08 allele was associated with about a 4-fold increase in IBM risk. As there was a moderate amount of between-studies heterogeneity, the effect size could fall between 1.04 and 15.86 in 95% of comparable populations. All included studies were performed in Caucasians and, consequently, we were unable to apply a subgroup analysis by ethnicity to investigate the sources of the aforementioned inconsistency. However, meta-regression showed a significant positive correlation of the effect size with gender-ratio (M/F). This peculiar finding suggests that the HLA-B*08-associated IBM risk might be greater in men than in women. Besides, the HLA-B*08 allele frequency in control groups was positively correlated with the effect size. Hence, the association was rather noted when the HLA-B*08 allele was larger in the general population.
Only three studies reported the DQB1*02 allele frequency in IBM patients. This allele conferred an approximately 6.6-fold increased IBM risk with no heterogeneity between included studies. As indicated above, the DQB1*02 allele, together with the A*01, B*08 and DRB1*03 alleles, forms the 8.1 ancestral haplotype. It is therefore problematic to assess the impact of each allele separately from the others. In this regard, Slater et al. 21 performed a stepwise conditioning method by adding strongly associated alleles as covariates in an Australian population of European descent. In this study only the DRB1*030101 remained significantly associated with IBM risk. 21 Besides, due to the non-availability of the 8.1 AH frequencies in patients versus controls in most included studies, we could not perform an HLA haplotype meta-analysis. Thus, future studies are needed to estimate the impact of this peculiar haplotype on IBM susceptibility and to assess the between-studies heterogeneity.
In summary, the present meta-analysis revealed that the HLA-DRB1*03, the DRB*03:01, the DRB1*01, the DRB1*01:01, the DRB1*15:02, the B*08 and the DQB1*02 alleles could play a significant role in susceptibility to IBM. Nevertheless, it is important to acknowledge that the association of the B*08 and the DQB1*02 could be accounted for by the strong linkage disequilibrium with the DRB1*0301 allele. Therefore, future functional studies together with stepwise conditioning are needed to further investigate the impact of each allele separately from the others. Besides, the DRB1*15:01 allele seemed to have a protective role against IBM risk. Besides, meta-regressions did not reveal any significant correlations of the effect-size with patients age and gender-ratio. These findings indicate that: (1) as IBM occurs mostly in elderly subjects the patients age did not seem to influence HLA impact on IBM susceptibility, and (2) Unlike other autoimmune diseases, hormonal factors did not seem to modify genetic susceptibility to IBM.
To the best of our knowledge, this study was the first to summarize previous data on HLA association with IBM risk. Moreover, we performed several subgroup analyses and meta-regressions in order to explore the between-studies heterogeneity. Subgroup analyses provided the present study with some interesting findings such as inter-ethnic disparities regarding the conferred risk by some HLA alleles. Furthermore, meta-regressions confirmed subgroup analysis results and revealed some interesting correlations with allele frequencies in the general population. Moreover, trial sequential analyses revealed that the required sample size was reached for almost all studied HLA alleles. However, there are some limitations that need to be acknowledged. Firstly, like other autoimmune disease, IBM risk depends on several factors such as environmental, infectious, psychological and genetic factors, and as the present study analyses derived from pooling HLA class II aggregate findings without any access to raw data, there was a lack of further adjustment for baseline characteristics. Secondly, all included studies were performed in Caucasians and East-Asians. Hence, the present meta-analysis results cannot be generalized to West-Asian, Sub-Saharan-African, North-African and indigenous American populations. Thirdly, the majority of included studies did not report the 8.1 ancestral haplotype frequencies in IBM patients versus controls. This issue prevented us from performing a meta-analytic pooling for this peculiar HLA haplotype, and to assess the between-studies heterogeneity. Fourthly, even though TSA revealed that the required sample size was reached, there were only a few numbers of included studies in the HLA-DRB1*1501, DRB1*1502, and DQB1*02 alleles meta-analyses, and consequently our results require replication in independent large cohorts.
Conclusions
This meta-analysis demonstrated that the following alleles, DRB1*03, DRB1*03:01, DRB1*01, DRB1*01:01, DRB1*15:02, B*08, and DQB1*02 were significantly associated with increased IBM risk. Conversely, the DRB1*15:01 allele seems to be protective against IBM.
Supplemental Material
sj-docx-1-iji-10.1177_03946320251321747 – Supplemental material for Association of HLA-DR, HLA-DQ, and HLA-B alleles with inclusion body myositis risk: A systematic review, a meta-analysis, a meta-regression and a trial sequential analysis
Supplemental material, sj-docx-1-iji-10.1177_03946320251321747 for Association of HLA-DR, HLA-DQ, and HLA-B alleles with inclusion body myositis risk: A systematic review, a meta-analysis, a meta-regression and a trial sequential analysis by Tarak Dhaouadi, Awatef Riahi, Taïeb Ben Abdallah, Yousr Gorgi and Imen Sfar in International Journal of Immunopathology and Pharmacology
Supplemental Material
sj-docx-2-iji-10.1177_03946320251321747 – Supplemental material for Association of HLA-DR, HLA-DQ, and HLA-B alleles with inclusion body myositis risk: A systematic review, a meta-analysis, a meta-regression and a trial sequential analysis
Supplemental material, sj-docx-2-iji-10.1177_03946320251321747 for Association of HLA-DR, HLA-DQ, and HLA-B alleles with inclusion body myositis risk: A systematic review, a meta-analysis, a meta-regression and a trial sequential analysis by Tarak Dhaouadi, Awatef Riahi, Taïeb Ben Abdallah, Yousr Gorgi and Imen Sfar in International Journal of Immunopathology and Pharmacology
Footnotes
Acknowledgements
This study was granted and supported by the Research Laboratory in Immunology of Renal Transplantation and Immunopathology (LR03SP01), Charles Nicolle Hospital, Tunis El Manar University, Tunisia.
Abbreviations
Author contributions
Conceptualization: Tarak Dhaouadi, Aouatef Riahi, Yousr Gorgi, Taieb Ben Abdallah, Imen Sfar
Data curation: Tarak Dhaouadi, Awatef Riahi
Formal analysis: Tarak Dhaouadi, Imen Sfar
Investigation: Tarak Dhaouadi, Awatef Riahi, Imen Sfar
Methodology: Tarak Dhaouadi, Imen Sfar, Taieb Ben Abdallah, Yousr Gorgi
Project administration: Yousr Gorgi, Taieb Ben Abdallah, Imen Sfar
Supervision: Yousr Gorgi, Taieb Ben Abdallah, Imen Sfar
Writing - original draft: Tarak Dhaouadi
Writing - review & editing: Tarak Dhaouadi
Declaration of conflicting interests
The author(s) declared no potential conflicts of interest with respect to the research, authorship, and/or publication of this article.
Funding
The author(s) received no financial support for the research, authorship, and/or publication of this article.
Ethics approval and consent to participate
Not applicable.
Informed consent
Not applicable.
Trial registration
Not applicable.
Availability of data and materials
The authors confirm that the data supporting the findings of this study are available within the article (and/or) its Supplemental Materials.
Supplemental material
Supplemental material for this article is available online.
References
Supplementary Material
Please find the following supplemental material available below.
For Open Access articles published under a Creative Commons License, all supplemental material carries the same license as the article it is associated with.
For non-Open Access articles published, all supplemental material carries a non-exclusive license, and permission requests for re-use of supplemental material or any part of supplemental material shall be sent directly to the copyright owner as specified in the copyright notice associated with the article.