
Abstract
Soluble tumor necrosis factor alpha (TNF-α) receptors contain two receptors: soluble tumor necrosis factor receptor (sTNFR) 1 and 2, and the aim of our study was to discover their concentration and diagnostic value for idiopathic membranous nephropathy (IMN). In total, 58 patients with IMN, 51 patients with chronic kidney disease (CKD), and 30 healthy volunteers were enrolled in this study. Levels of serum sTNFR1 and sTNFR2 were determined by enzyme-linked immunosorbent assay (ELISA). Serum cystatin C (CysC), urea, creatinine (CREA), uric acid (UA), total protein (TP), albumin (ALB), and 24-h urinary protein (proteinuria, PRO) were examined by automatic biochemical analyzer. Levels of sTNFR1 and sTNFR2 were significantly higher in IMN group than CKD and control group (P < 0.05). In IMN group, there were significant correlation between sTNFR1 and sTNFR2 (P < 0.01). Both sTNFR1 and sTNFR2 were positively related to serum urea, CREA, CysC, UA, 24-h PRO (P < 0.05) and negatively related to ALB (P < 0.01). Receiver operating characteristic (ROC) analysis showed that the area under the curve (AUC) of sTNFR1 and sTNFR2 were 0.997 and 0.993, respectively, when control was healthy volunteers. When sTNFR1 cut-off was 959.15 pg/mL, the sensitivity and specificity were 96.6% and 100%, respectively. When sTNFR2 cut-off was 2449.43 pg/mL, the sensitivity and specificity were 93.1% and 100%, respectively. While the control was CKD group, AUC of sTNFR1 and sTNFR2 were 0.647 and 0.626, respectively. When sTNFR1 cut-off was 3356.57 pg/mL, the sensitivity and specificity were 72.4% and 60.8%, respectively. When sTNFR2 cut-off was 6497.34 pg/mL, the sensitivity and specificity were 72.4% and 58.8%, respectively. This is the first study to show that both levels of sTNFR1 and sTNFR2 increased and correlated with serum urea, CREA, CysC, UA, ALB, 24-h PRO and could be usable for IMN diagnosis and differential diagnosis between IMN and CKD.
Introduction
Idiopathic membranous nephropathy (IMN) is a common cause of nephrotic syndrome in adults and has been identified as an autoimmune-mediated disease. The diagnosis of membranous nephropathy mainly depends on kidney biopsy, which is a kind of invasive injury to patients. 1 A number of studies have shown that 52%–82% of IMN sera have auto-antibodies directed toward the M-type phospholipase A2 receptor (PLA2RAb),2,3 a 180-kDa protein that is expressed by alveolar epithelial cells and neutrophils, but is mainly restricted to podocytes within the kidney. The presence of antibodies against the M-type PLA2RAb is considered to be a promising serological diagnostic biomarker of idiopathic membranous nephropathy (IMN). But there are limited data about the sensitivity and specificity of its diagnostic values. 4 Our previous study showed that the diagnosis sensitivity of PLA2RAb for IMN was about 70.0%, 5 which suggests that there are about 30%patients PLA2RAb negative. Thus, some other non-invasive diagnostic markers of IMN are desirable.
Soluble tumor necrosis factor alpha (TNF-α) receptors contain two receptors: soluble tumor necrosis factor receptor (sTNFR) 1 and 2, which have been associated with progression of renal failure, and end-stage renal disease, mostly in the context of diabetic nephropathy.6–12 However, the correlation between sTNFR1 and sTNFR2, and their association with routine biomarkers in IMN were not defined. In this study, we compare serum sTNFR1 and sTNFR2 concentration between IMN patients and healthy control, analyze their correlation each other and their association with biomarkers, such as serum cystatin C (CysC), urea, CREA, uric acid (UA), total protein (TP), albumin (ALB), and 24-h urinary protein (proteinuria, PRO) in IMN patients. Receiver operating characteristic (ROC) curves evaluate the diagnosis value of sTNFR1 and sTNFR2 for IMN in order to find better diagnostic markers.
Methods
Patients and samples
IMN groups: inclusion criteria for participating in this clinical study were histologic diagnosis of idiopathic MN and no immunosuppressive therapy prior to inclusion in the study.
IMN group: 58 IMN patients, the majority of patients in our study cohort has nephrotic range proteinuria and is without immunosuppressive treatment, constituted the IMN study population (mean age of 45 ± 11 years, 25 female and 33 male).
Disease control: 51 chronic kidney disease (mean age of 45 ± 16 years, 23 female and 28 male) and the majority of patients in our study cohort has nephrotic range proteinuria.
Volunteers: 30 cases of age- and sex-matched healthy individuals without any kidney disease were served as controls (mean age of 44 ± 18 years, 14 female and 16 male).
Patient serum samples were collected from the Affiliated Hospital of Jiu Jiang University. Blood was taken to a serum tube from an antecubital vein and was aliquoted within 2 h for sTNFR1, sTNFR2, CysC, urea, and ALB level test, at the same time, 24-h urinary protein was collected for examination. The study was approved by the ethics committee of Jiu Jiang University affiliated hospital. Patients’ informed consent for the usage of sera was obtained prior to sample collection.
Enzyme-linked immunosorbent assay for sTNFR1 and sTNFR2
Enzyme-linked immunosorbent assay (ELISA; CUSABIO, China) for the detection of sTNFR1 and sTNFR2. The assay was performed according to the instruction. All samples and standards would be assayed in duplicate.
Methods for biomarkers determination
The levels of sera CysC, urea, CREA, UA, and 24-h PRO were quantified using automatic biochemical analyzer (AU5800, Beckman).
Statistical analysis
Statistical analysis of the results was carried out using one-way analysis of variance (ANOVA), least significant difference (LSD) test, Pearson correlation, and ROC analysis with SPSS 18.0 software. P values < 0.05 were considered significant.
Result
Standard curve of sTNFR1 and sTNFR2
sTNFR1 optical density(OD) values of S0–S7 were 0.066, 0.104, 0.135, 0.221, 0.415, 0.695, 1.263, and 1.986; sTNFR2 OD values of S0–S7 were 0.088, 0.105, 0.198, 0.281, 0.416, 0.698, 1.165, and 1.942, respectively. The calibration curve was obtained and their standard curve equation was built by Curve Expert 1.3 software (Figure 1). Curve major parameters were as followed: sTNFR1: S = 29.34478214, r = 0.99991809; sTNFR2: S = 12.12273059, r = 0.99991263, which suggested that standard curve of sTNFR1 and sTNFR2 have good linear relationship (r > 0.999). Such indicated that the reaction system was stable and results were reliable.

Standard curves of (a) sTNFR1 and (b) sTNFR2.
Comparison of sTNFR1 and sTNFR2 among three groups
ANOVA test showed that both levels of sTNFR1 and sTNFR2 were higher in IMN and chronic kidney disease (CKD) than in control (F = 39.895, P = 0.000; F = 38.320, P = 0.000). LSD test showed both levels of sTNFR1 and sTNFR2 were higher in IMN than CKD (P = 0.021 < 0.05; P = 0.020 < 0.05) (Table 1).
Comparison of biomarkers among three groups by one-way ANOVA.
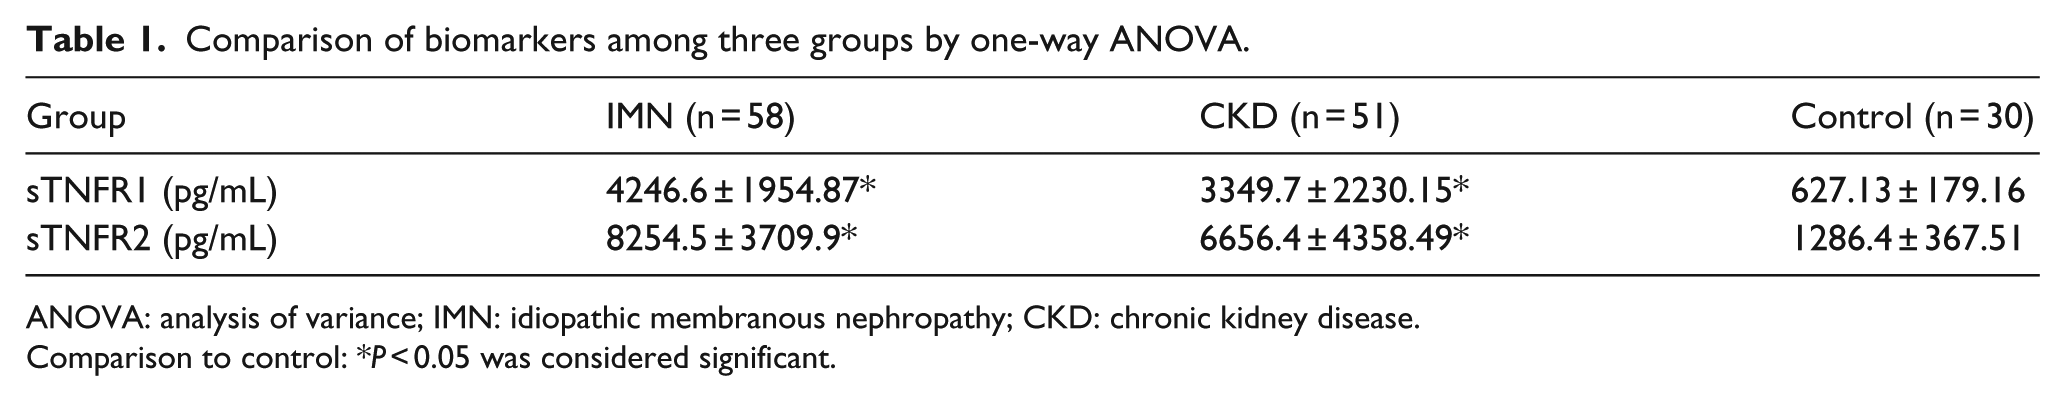
ANOVA: analysis of variance; IMN: idiopathic membranous nephropathy; CKD: chronic kidney disease.
Comparison to control: *P < 0.05 was considered significant.
Correlation analysis
In IMN group, there were significant correlation between sTNFR1 and sTNFR2 (P < 0.01). Both sTNFR1 and sTNFR2 were positively related to serum urea, CREA, CysC, UA, and 24-h PRO (P < 0.05) and negatively related to ALB (P < 0.01) (Table2).
Correlation analysis among sTNFR1, sTNFR2, and other biological markers in IMN group.
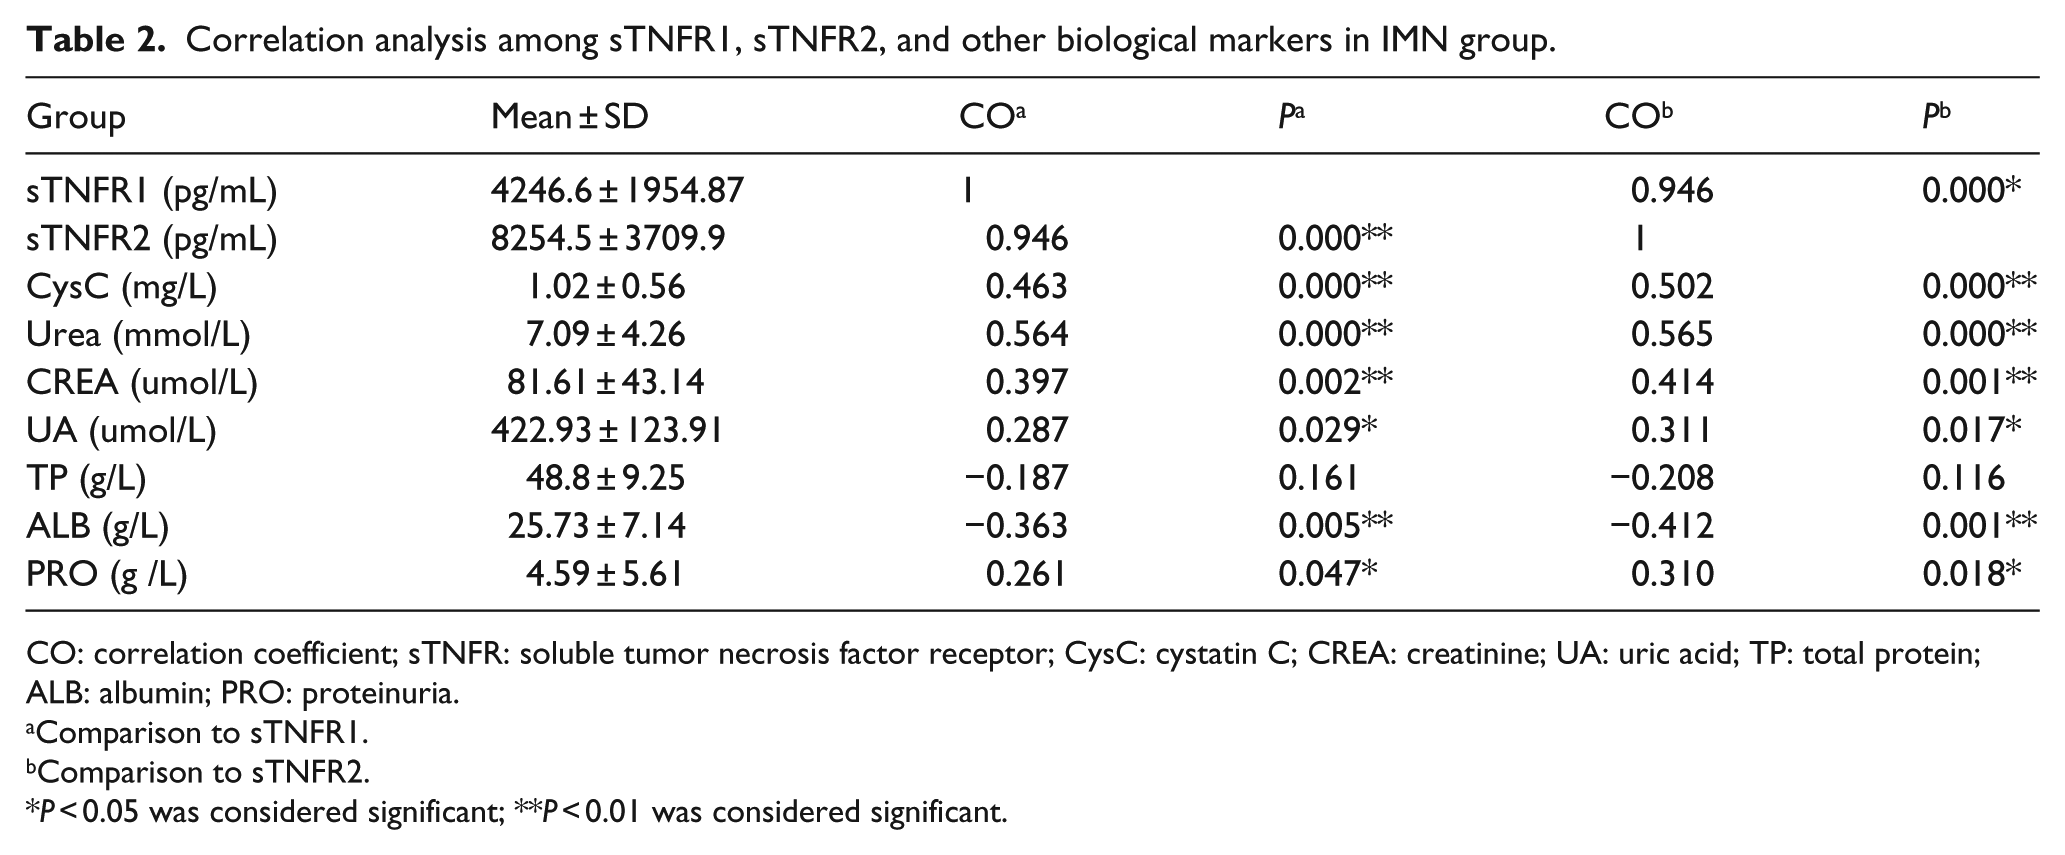
CO: correlation coefficient; sTNFR: soluble tumor necrosis factor receptor; CysC: cystatin C; CREA: creatinine; UA: uric acid; TP: total protein; ALB: albumin; PRO: proteinuria.
Comparison to sTNFR1.
Comparison to sTNFR2.
P < 0.05 was considered significant; **P < 0.01 was considered significant.
ROC curve analysis
As control was healthy volunteers, ROC analysis showed that area under the curve (AUC) of sTNFR1 and sTNFR2 were 0.997 and 0.993, respectively, which were significant difference compared with AUC = 0.5 (P = 0.000 < 0.05) and indicated that the sTNFR1 and sTNFR2 were found useful in diagnosis of IMN (Figure 2(a)). When sTNFR1 cut-off was 959.15 pg/mL, the sensitivity and specificity were 96.6% and 100%, respectively. When sTNFR2 cut-off was 2449.43 pg/mL, the sensitivity and specificity were 93.1% and 100%, respectively.
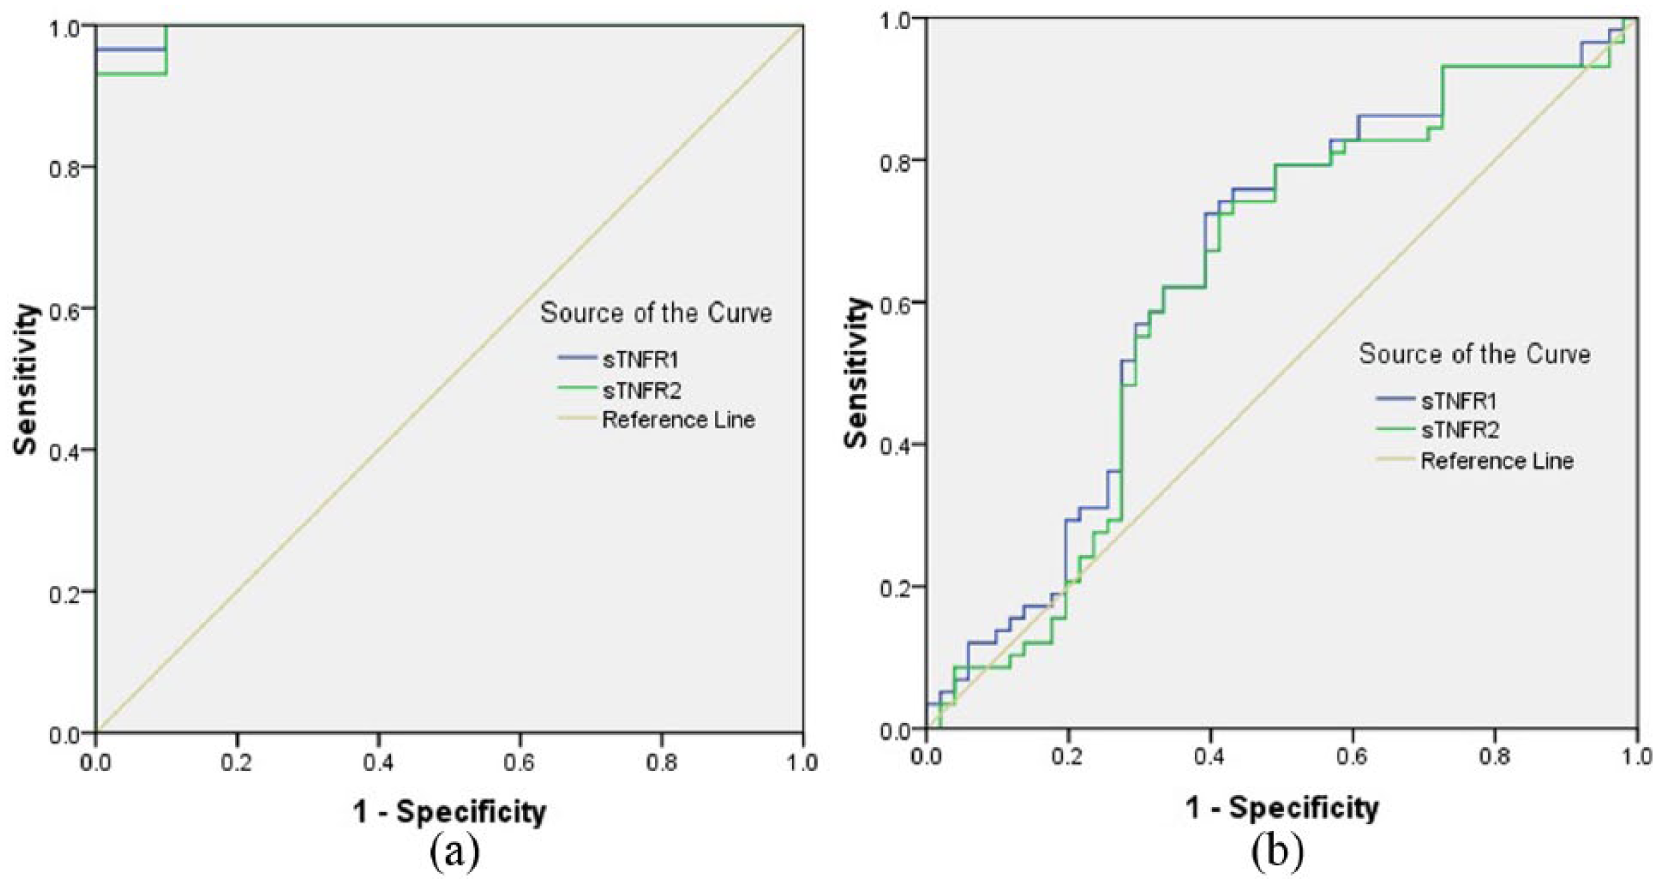
ROC curves (a) healthy volunteers as control and (b) CKD as control.
As control was CKD group, ROC analysis showed that the AUC of sTNFR1 and sTNFR2 were 0.647 and 0.626, respectively, which were significant difference compared with AUC = 0.5 (P = 0.008; P = 0.024 < 0.05) and indicated that the sTNFR1 and sTNFR2 were found useful in differential diagnosis of IMN from CKD (Figure2(b)). When sTNFR1 cut-off was 3356.57 pg/mL, the sensitivity and specificity were 72.4% and 60.8%, respectively. When sTNFR2 cut-off was 6497.34 pg/mL, the sensitivity and specificity were 72.4% and 58.8%, respectively.
Discussion
sTNFR1 and sTNFR2 are soluble TNF-α receptors, and their concentrations are often elevated in some kidney diseases such as lupus nephritis, diabetic retinopathy, and immunoglobulin A (IgA) nephropathy.13–15 sTNFRs are relevant biomarkers for kidney damage and dysfunction in elderly individuals, even in the absence of diabetes. 6 The comparison of sTNFR1 and sTNFR2 levels between CKD and IMN is unknown, and diagnosis for IMN and differential diagnosis between IMN and CKD remain also unclear. In order to verify potential diagnostic value of sTNFR1 and sTNFR2 for IMN, we design CKD as disease control and volunteers as healthy control; compare sTNFR1 and sTNFR2 levels among IMN, CKD, and volunteers; characterize the relationship between the sTNFR1 and sTNFR2, and the association with some routine biomarkers, analyzed ROC curve and the cut off value for IMN, try to find a novel biomarkers panel that might improve early disease diagnosis, thus being further integrated into clinical practice. In this study, first, the calibration curves of sTNFR1 and sTNFR2 are obtained, which ensured the data reliable. Second, we found that both levels of sTNFR1 and sTNFR2 in IMN were highest among three groups. The order of concentration from high to low as followed: IMN > CKD > volunteer. Third, in IMN group, there were significant correlation between sTNFR1 and sTNFR2 levels each other, and both of them positively related to serum urea, CREA, CysC, UA, and 24-h PRO and negatively related to ALB; Finally, when the control was volunteer, sTNFR1 and sTNFR2 cut-offs were 959.15 and 2449.43 pg/mL, respectively. When the control was CKD, sTNFR1 and sTNFR2 cut-off were 3356.57 and 6497.34 pg/mL, respectively, which suggested that sTNFR1 and sTNFR2 could be usable for IMN diagnosis and differential diagnosis between IMN and CKD.
To sum up, we further confirmed that the concentrations of serum sTNFR1 and sTNFR2 were in association with renal routine function biomarkers, combined detection of sTNFR1, sTNFR2 and routine renal function biomarkers such as serum urea, CREA, CysC, ALB and 24-h PRO would improve diagnosis accuracy of IMN. The setting of the cut-off value is Svery important, kidney-related other diseases will be included in the future, and a large number of experiments are still needed to verify this study.
Footnotes
Declaration of conflicting interests
The author(s) declared no potential conflicts of interest with respect to the research, authorship, and/or publication of this article.
Ethical approval
All procedures performed in studies involving human participants were in accordance with the ethical standards of the affiliated hospital of Jiu Jiang University research committee and with the 1964 Helsinki declaration and its later amendments or comparable ethical standards.
Funding
This study was funded by Science and technology support program of Jiujiang Science and Technology Bureau (20160106), the Public Health Bureau of Jiangxi Province (20164040) and Youth Science Fund of Jiangxi Province (20161BAB215191).