
Abstract
Background
The involvement of certain adipokines link to carcinogenesis, development, and prognosis. However, the roles of adipokines in lung cancer and its histological subtypes remains indistinct. Therefore, the aims of this study are to explore the causal relationship between adipokines and lung cancers.
Methods
Summary-level data for exposures (six adipokines) and outcomes (lung cancer and its histological subtypes) were collected from the IEU OpenGWAS, International Lung Cancer Consortium (ILCCO) and lectures. Two-sample mendelian randomization (MR) was conducted to estimate the causality by employing single nucleotide polymorphisms (SNPs) as instrument variables (IVs). Human tissue microarray and immunohistochemistry (IHC) analysis validated the adipokines expression. Functional effects of LEPR in LUSC were assessed in vitro using NCI-H2170 and SK-MES-1 cell lines via siRNA-mediated knockdown, followed by assays for cell proliferation, invasion, and apoptosis.
Results
Leptin receptor (LEPR) was associated with risk of lung squamous cell carcinoma (LUSC, OR: 1.05, 95% CI: 1.01-1.08; P < 0.0125), and no other adipokines associated with lung cancer and its histological subtypes (P > 0.05). Experimental results revealed that high expression of LEPR in LUSC tumor samples compared to adjacent normal samples, and associated with unfavorable survival status. In vitro, LEPR knockdown significantly inhibited proliferation and invasion while promoting apoptosis in LUSC cells.
Conclusion
These findings suggest that LEPR may play a critical role in the development and progression of LUSC, providing a potential target for therapeutic intervention.
1. Introduction
Lung cancer remains the leading cause of cancer death, with an estimated 2.5 million new cases and over 1.8 million deaths globally in 2022. 1 In most countries, the five-year survival rate for lung cancer trends to below 20% 2 and is not be significantly influenced by levels of human development. 3 Tobacco remains the primary risk factor for lung cancer, other risk factors include air pollution.4,5 Small cell lung cancer (SCLC) and non-small cell lung cancer (NSCLC) are the two main types of lung cancer, with over 80% of cases diagnosed as NSCLC. Furthermore, NSCLC can be divided into four histological subtypes: lung adenocarcinoma (LUAD), lung squamous cell carcinoma (LSCC or LUSC), and large-cell carcinoma (LCC). 6 Most lung cancers are diagnosed at an advanced stage when curative treatment is no longer possible. 1 Therefore, identifying more risk factors related to lung cancer progression is crucial for the early detection and treatment of lung cancer.
Adipokines are generated and secreted by adipocytes or tissue-infiltrating immune cells and are involved in a range of biological functions and processes in cancer, including metabolism, inflammatory responses, and carcinogenesis.7,8 Adipocyte-secreted adipokines, such as leptin, adiponectin, Nesfatin-1, resistin, chemerin, and visfatin, have been found to drive lung cancer bone metastasis. 9 These adipokines play a crucial role in determining the effectiveness of anti-cancer immunotherapy in patients with extensive-stage small cell lung cancer (ES-SCLC). 10 Additionally, visceral-secreted omentin serum levels are reduced in smokers with lung cancer and are associated with their prognosis. 11 Leptin serum levels also serve as a prognostic indicator for lung cancer, 12 but another case-control study indicates that serum leptin levels have no prognostic implications in advanced lung cancer patients. 13 The current research results are inconsistent, and the consistency and quality of these studies have not been well evaluated. They are often subject to confounding and reverse causation bias, which limits the objective assessment of the impact of adipokines on lung cancer.
Mendelian randomization (MR) is a powerful statistical technique investigating causal relationships in epidemiological research by using genetic variants as instrumental variables. 14 Since genetic variants are randomly assigned and unaffected by reverse causation, MR effectively avoids the confounding and reverse causation biases that commonly impact traditional observational studies. 15 In this study, we conducted MR analysis to explore the potential relationships between adipokines and lung cancer and its three histological subtypes.
2. Methods
2.1 Study Design
The study design is shown in Figure 1. Two-sample MR analysis was conducted to explore the causal relationship between adipokines and lung cancers by using genetic variables as the instruments. Genetic instrument variables (IVs) were selected by stratifying three assumptions. (a) IVs should have a strong association with the exposure (adipokines). (b) IVs should not be associated with confounding factors. (c) IVs should be linked to the outcome (lung cancers) only through their effect on the exposure.
16
Since the data used in this study were derived from publicly available GWAS summary-level data, no additional ethical approval was required. To avoid errors due to population stratification, all subjects involved in this study were of European ancestry. The STROBE-MR checklist has been checked.
17
The workflow chart of this study
2.2 Data Source of Exposure
The summary GWAS statistics for adipokines, including adiponectin, leptin, resistin, monocyte chemoattractant protein-1 (MCP-1), leptin receptor (LEPR), and plasminogen activator inhibitor (PAI-1), were obtained from the ADIPOGen consortium belongs to IEU OpenGWAS data project and recent research.18-20 As shown in Table S1, these statistics encompass data from 39,883 individuals (ieu-a-1), 21,758 individuals (ebi-a-GCST90012076), 21,758 individuals (prot-c-5400_52_3), 21,758 individuals (ebi-a-GCST90012034), 997 individuals (ebi-a-GCST90012007), 34448 individuals (ebi-a-GCST90014291), respectively.
2.3 Data Source of Outcome
The GWAS summary statistics of lung cancers and three histologic subtypes of lung cancer were obtained from the International Lung Cancer Consortium (ILCCO, https://ilcco.iarc.fr/). The data includes, lung cancer (ieu-a-987): 29,863 cases and 55,586 controls, lung adenocarcinoma (ieu-a-984): 11,245 cases and 54,619 controls, squamous cell carcinoma (ieu-a-989): 7,704 cases and 54,763 controls, and small cell lung cancer (ieu-a-988): 2,791 cases and 20,580 controls). The detail information was shown in Table S1.
2.4 Selection of Instrument Variables (IVs)
SNPs significantly associated with adipokines were identified based on the following criterion, genome-wide significance (P < 5 x 10⁻⁶), clumping R2 < 0.01 and a distance of 5,000 kb to avoid the linkage disequilibrium (LD). An F-statistic > 10 was used to prevent bias from weak IVs. PhenoScanner was utilized to provide phenotype information for the SNPs, ensuring they were not associated with confounding factors (such as smoking, body mass index, and type 2 diabetes) or the outcome (lung cancer). This was done by searching all screened SNPs on PhenoScanner V2 (https://www.phenoscanner.medschl.cam.ac.uk/) 21 with a threshold of P > 1 x 10⁻⁵.
2.5 Mendelian Randomization (MR) and Sensitivity Analyses
The inverse variance weighted (IVW) approach was used as the primary method for performing MR analysis. IVW evaluates overall causal effects through a meta-analysis of the Wald ratios of multiple SNPs. 22 Sensitivity analyses included MR-Egger regression, weighted median estimator (WME), MR robust adjusted profile score (MR-RAPS), and MR pleiotropy residual sum and outlier (MR-PRESSO).
MR-Egger regression is a method that tests causal effects by considering the existence of an intercept term to evaluate pleiotropy. 23 WME robust estimation even if more than half of the SNPs are invalid. 24 MR-RAPS is a statistical inference method for two-sample summary data MR based on robust adjusted profile scores, providing robust estimates even with many weak instrumental variables and increasing statistical power. 25 MR-PRESSO method can outlier SNPs and estimates corrected results excluding horizontal pleiotropy. If no outliers are detected, the results remain consistent with IVW. 26
Statistical power was estimated using an online tool (https://sb452.shinyapps.io/power/), with a power greater than 80% indicating sufficient statistical power for MR. The MR-Egger intercept was used to assess horizontal pleiotropy, with P < 0.05 indicating significant pleiotropy. Cochran’s Q test was performed to test for heterogeneity, with P < 0.05 indicating significant heterogeneity. A leave-one-out analysis was also conducted to assess sensitivity. The Steiger filtering method was used to test the direction of causality.
2.6 Human Tissue Microarray and Immunohistochemistry (IHC) Analysis
A human tissue microarray (HLug-Squ150Sur-02) containing 75 LUSC tumor tissues and adjacent normal tissues were obtained from the Shanghai Outdo Biotech Co., Ltd. This study was approved by ethics committee of Shanghai Outdo Biotech Co., Ltd. (YB M-05-02). The sections were subjected to the retrieval of the antigen, incubated overnight with anti-LEPR (1:100, 20966-1-AP, Proteintech, Wuhan, China) primary antibody at 4 °C, subsequently incubated with anti-HRP secondary antibody for 1 h at room temperature. Finally, 3, 3′-diaminobenzidine (DAB) staining was performed to visualize the targeted antigen, and the sections were mounted for capturing the whole stained area using a slide scanner. Histochemistry score (H-score) was calculated according to the percentage of positive cells and the H-score = (percentage of weak intensity x 1) + (percentage of moderate intensity x 2) + (percentage of strong intensity x 3). 27
2.7 Cell Line, Cell Culture, and Cell Transfection
Human LUSC cell lines NCI-H2170 and SK-MES-1 were purchased from Procell System Co., Ltd. (Wuhan, China) and cultured in RPMI-1640 medium supplemented with 10% fetal bovine serum (FBS; Hyclone, South Logan, UT, USA) and 1% penicillin/streptomycin (Invitrogen, CA, USA) at 37 °C in a humidified incubator containing 5% CO2.
LEPR knockdown was achieved by transfection with three independent siRNAs targeting LEPR (si-LEPR-#1, si-LEPR-#2, and si-LEPR-#3) or a non-targeting negative control siRNA. All siRNAs were designed and synthesized by RiboBio (Guangzhou, China). For transfection, cells were seeded to reach 40–60% confluence and transfected with siRNAs or plasmids using Lipofectamine 2000 (Invitrogen) according to the manufacturer’s instructions.
2.8 RNA Extraction and Quantitative PCR
Total RNA was extracted from cultured cells or tissues using TRIzol reagent (Life Technologies, CA, USA) following the manufacturer’s protocol. cDNA was synthesized from 1 μg of total RNA using the High-Capacity cDNA Reverse Transcription Kit (Thermo Fisher Scientific, MA, USA). Quantitative real-time PCR was performed using TaqMan Universal PCR Master Mix (Thermo Fisher Scientific) on a 7900HT Real-Time PCR System (Thermo Fisher Scientific). GAPDH served as the internal reference gene. Relative mRNA expression levels were calculated using the 2-ΔΔCt method. The primer sequences used in this study were as follows: LEPR, forward 5′-CATCTCTGCCTTCGGTCGAG-3′, reverse 5′-ACTGCCTTTTTGGGGAACCA-3’; GAPDH, forward 5′-GGATTTGGTCGTATTGGGCG-3′, reverse 5′-TCCCGTTCTCAGCCATGTAG-3’.
2.9 Cell Viability Assay
Cell viability was assessed using a Cell Counting Kit-8 (CCK-8; Beyotime, Shanghai, China) according to the manufacturer’s instructions. Briefly, 4 × 10³ cells per well were seeded into 96-well plates and transfected with siRNAs for 48 h. Cells were then treated with cisplatin at the indicated concentrations (0, 0.25, 0.5, 1, or 2 μM) for an additional 48 h. Subsequently, 10 μL of CCK-8 reagent was added to each well and incubated at 37 °C for 2 h. Absorbance at 450 nm was measured using a microplate reader (Invitrogen, Carlsbad, CA, USA).
2.10 Apoptosis Assay
Apoptosis was evaluated using the Annexin V-FITC/PI Apoptosis Detection Kit (Beyotime, Shanghai, China) following the manufacturer’s instructions. Cells were transfected with siRNAs for 24 h, harvested, washed with cold PBS, and resuspended in binding buffer containing Annexin V-FITC and PI. After incubation for 15 min in the dark at room temperature, apoptotic cells were quantified by flow cytometry (BD Biosciences, CA, USA).
2.11 Cell Invasion Assay
Cell invasion assays were performed using Matrigel-coated Transwell chambers (8-μm pore size; Corning, NY, USA). At 24 h post-transfection, cells were serum-starved for another 24 h, detached, and resuspended in serum-free medium. Next, 100 μL of cell suspension was added to the upper chamber, while the lower chamber was filled with medium containing 20% FBS as a chemoattractant. After incubation, non-invading cells on the upper surface of the membrane were removed, whereas invaded cells on the lower surface were fixed and stained with 0.5% crystal violet. Images were captured under a microscope, and the number of invading cells was quantified.
2.12 Statistical Analysis
The IVW, MR-Egger regression, WME, and MR-RAPS methods were employed to evaluate the causal associations between adipokines and lung cancer and its subtypes using the “TwosampleMR” package (version 0.5.7). If there was no heterogeneity, a fixed-effects model IVW was used; if heterogeneity was present, a multiple random-effects model IVW was applied.
MR-PRESSO analysis was conducted using the “MRPRESSO” R package (version 3.3.2) to identify and remove outlier SNPs and to determine whether outliers influenced the MR results. Forest plots of the leave-one-out results were drawn using the “forestplot” R package (version 3.1.3). Due to multiple testing, a Bonferroni correction P value < 0.0125 (0.05/4) was considered significant. In other analyses, a P value < 0.05 is considered statistically significant.
The experimental results were statistical analysis using GraphPad Prism version 9.0.0. Differences between two groups were analyzed using Student’s t-test, and comparisons among multiple groups were analyzed using one-way analysis of variance (ANOVA). P < 0.05 was considered statistical significances.
3. Results
3.1 Selection of IVs
As shown in Table S2 a-b, a total of 34 SNPs for adiponectin, 4 SNPs for Leptin, 44 SNPs for Resistin, 27 SNPs for MCP-1, 5 SNPs for LEPR, and 20 SNPs for PAI-1 were identified as IVs according to the genome-wide significance (P < 5 x 10⁻⁶), clumping R2 < 0.01 and a distance of 5,000 kb, all F-statistic > 10.
3.2 Evaluating the Casual Effects of Six Adipokines on Lung Cancer and Three Histologic Subtypes
No causal association between six adipokines and lung cancer was observed by IVW analysis (Figure 2, P > 0.0125). No horizontal pleiotropy was detected by MR-Egger intercept estimates (Pleiotropy p-value > 0.05), and no heterogeneity was detected by Cochran’s Q test (Q p-value > 0.05). WME, MR-Egger, MR-RAPS, and MR-PRESSO provided consistent results (Figure 2, Table S4). MR-Steiger filtering results indicated no invalid genetic instruments for these MR analyses (Tables S5-S6). MR results of the association of adipokines and lung cancer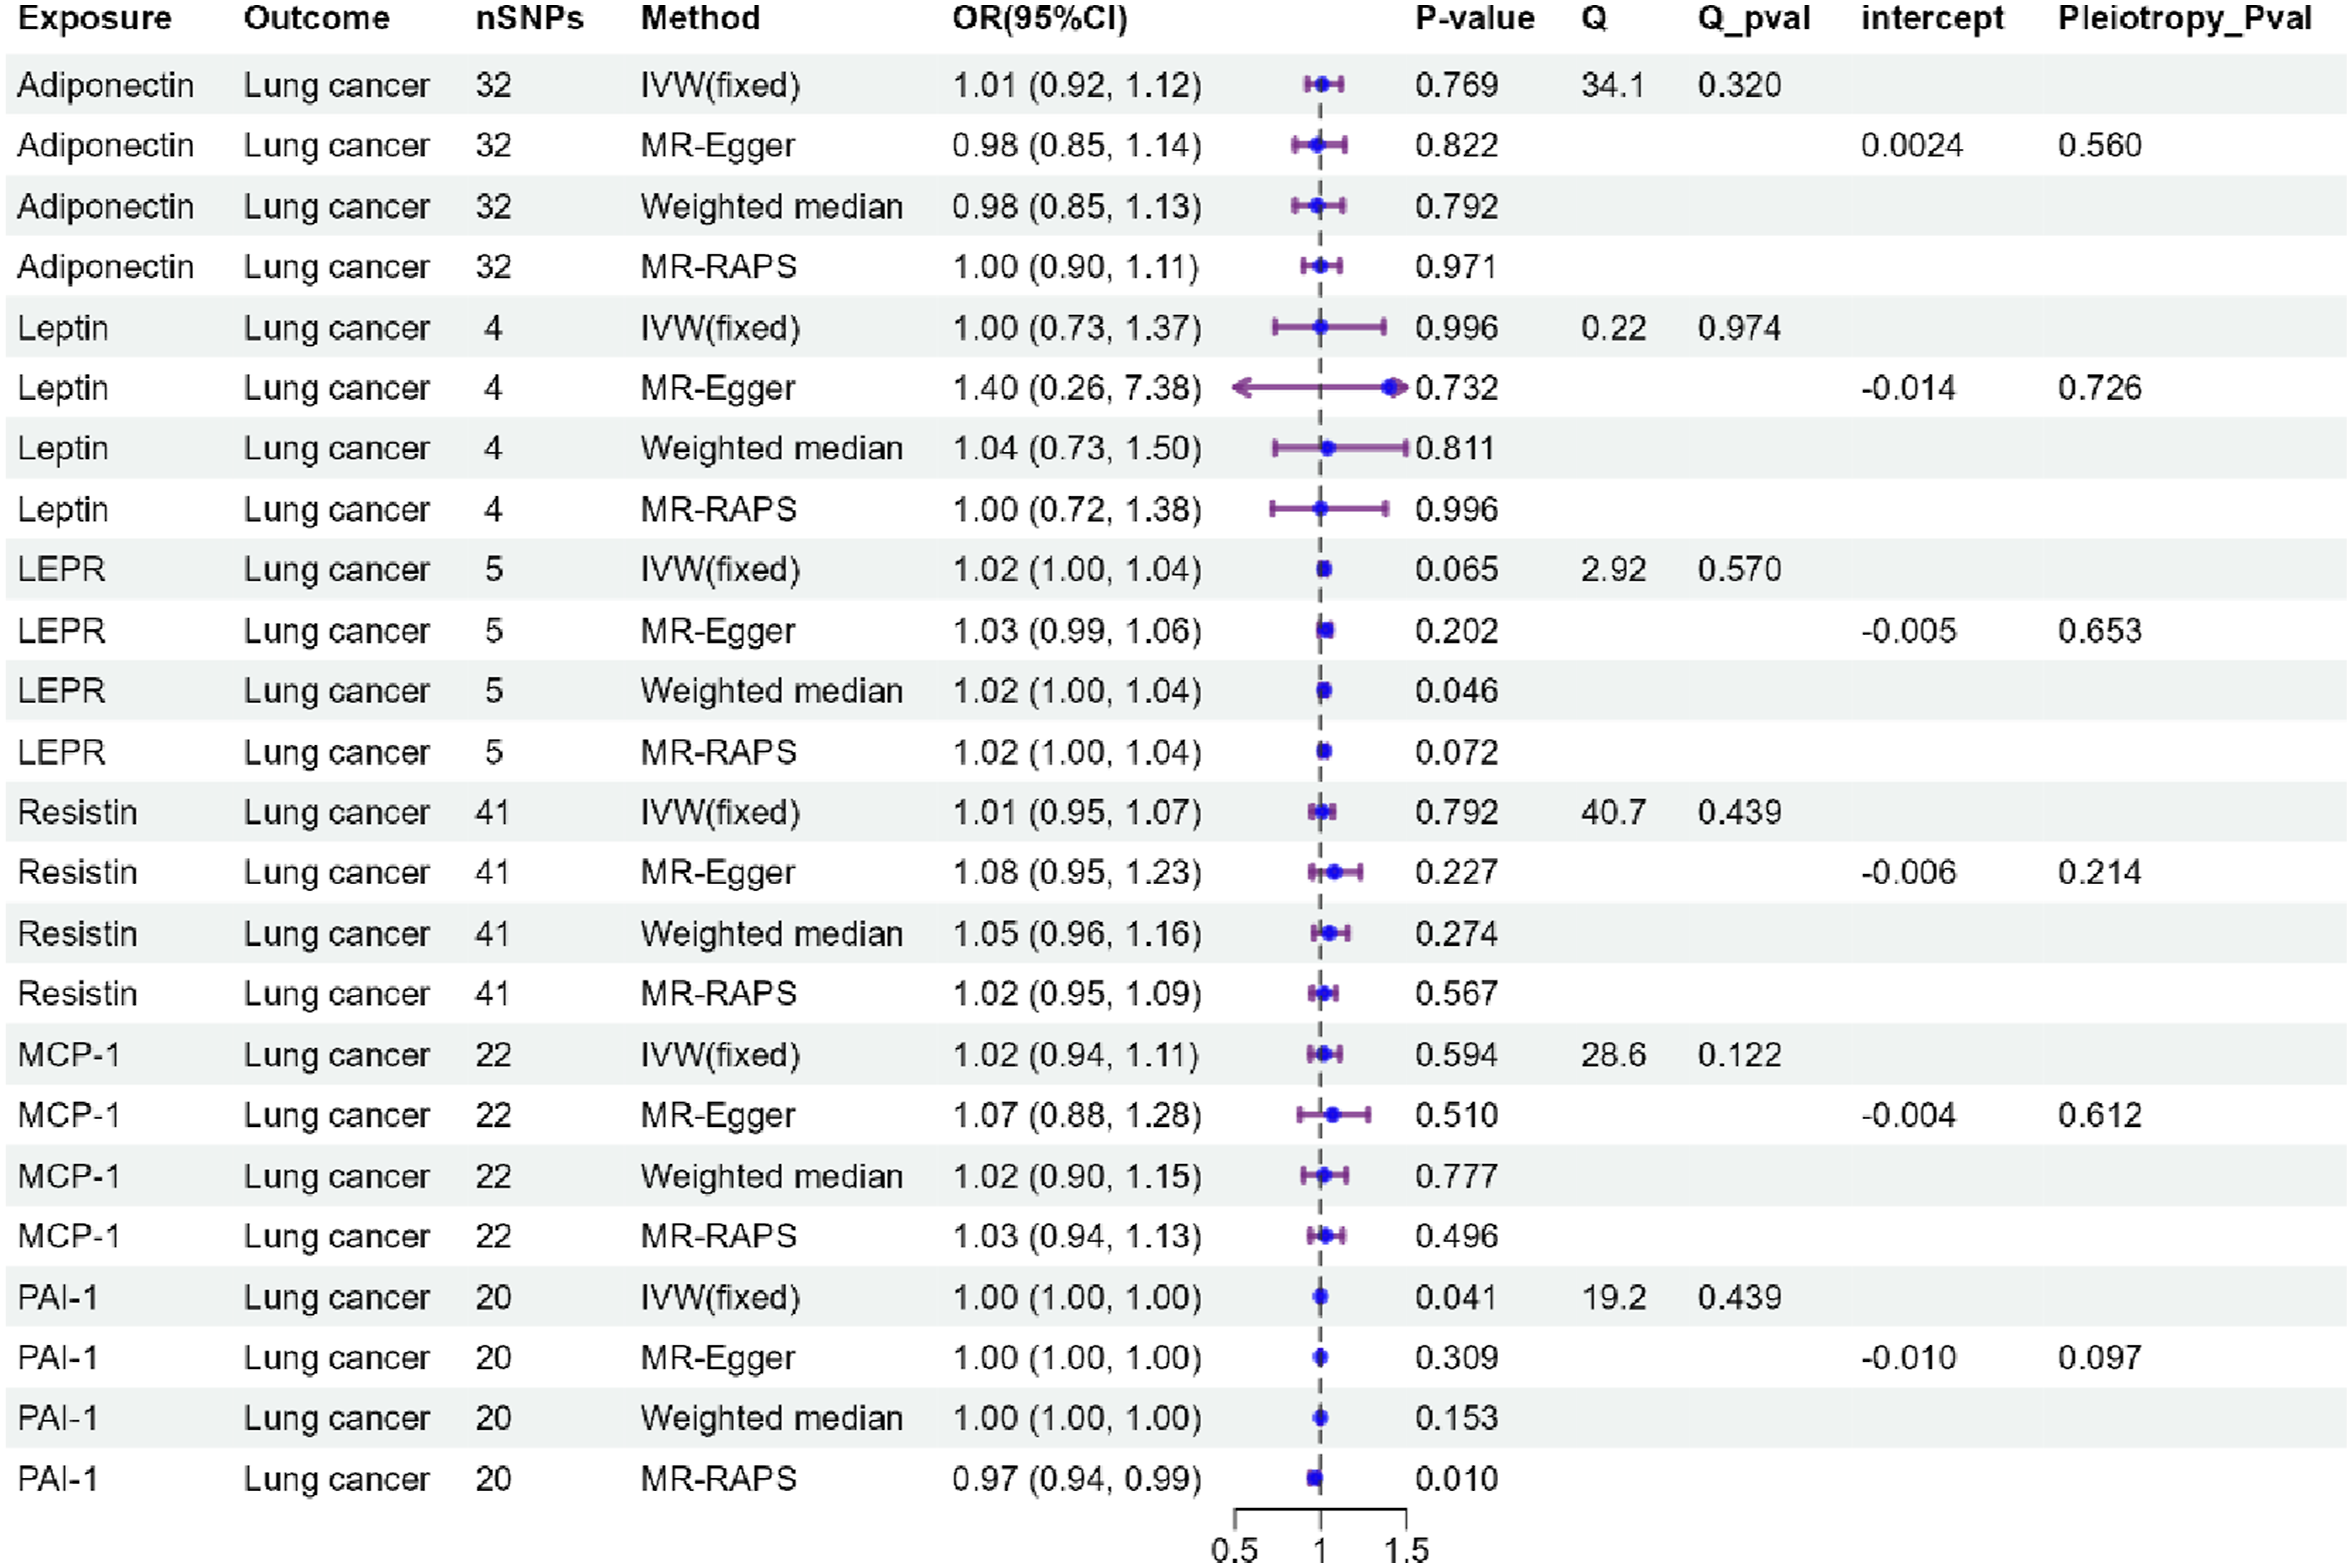
Due to the horizontal pleiotropy observed in the genetic instruments of Monocyte chemoattractant protein-1 (MCP-1) (Figure 3, Q_pval < 0.05), an IVW-random effect model was used to estimate the causal association between MCP-1 and LUAD. No causal effects of the six adipokines on LUAD were found by IVW analysis (Figure 3, P > 0.05). Other analyses yielded results consistent with the IVW findings (Figure 3, P > 0.05). No horizontal pleiotropy was observed according to MR-Egger intercept estimates (Pleiotropy p-value > 0.05). MR-Steiger filtering results indicated no invalid genetic instruments for these MR analyses (Table S5). MR results of the association of adipokines and lung adenocarcinoma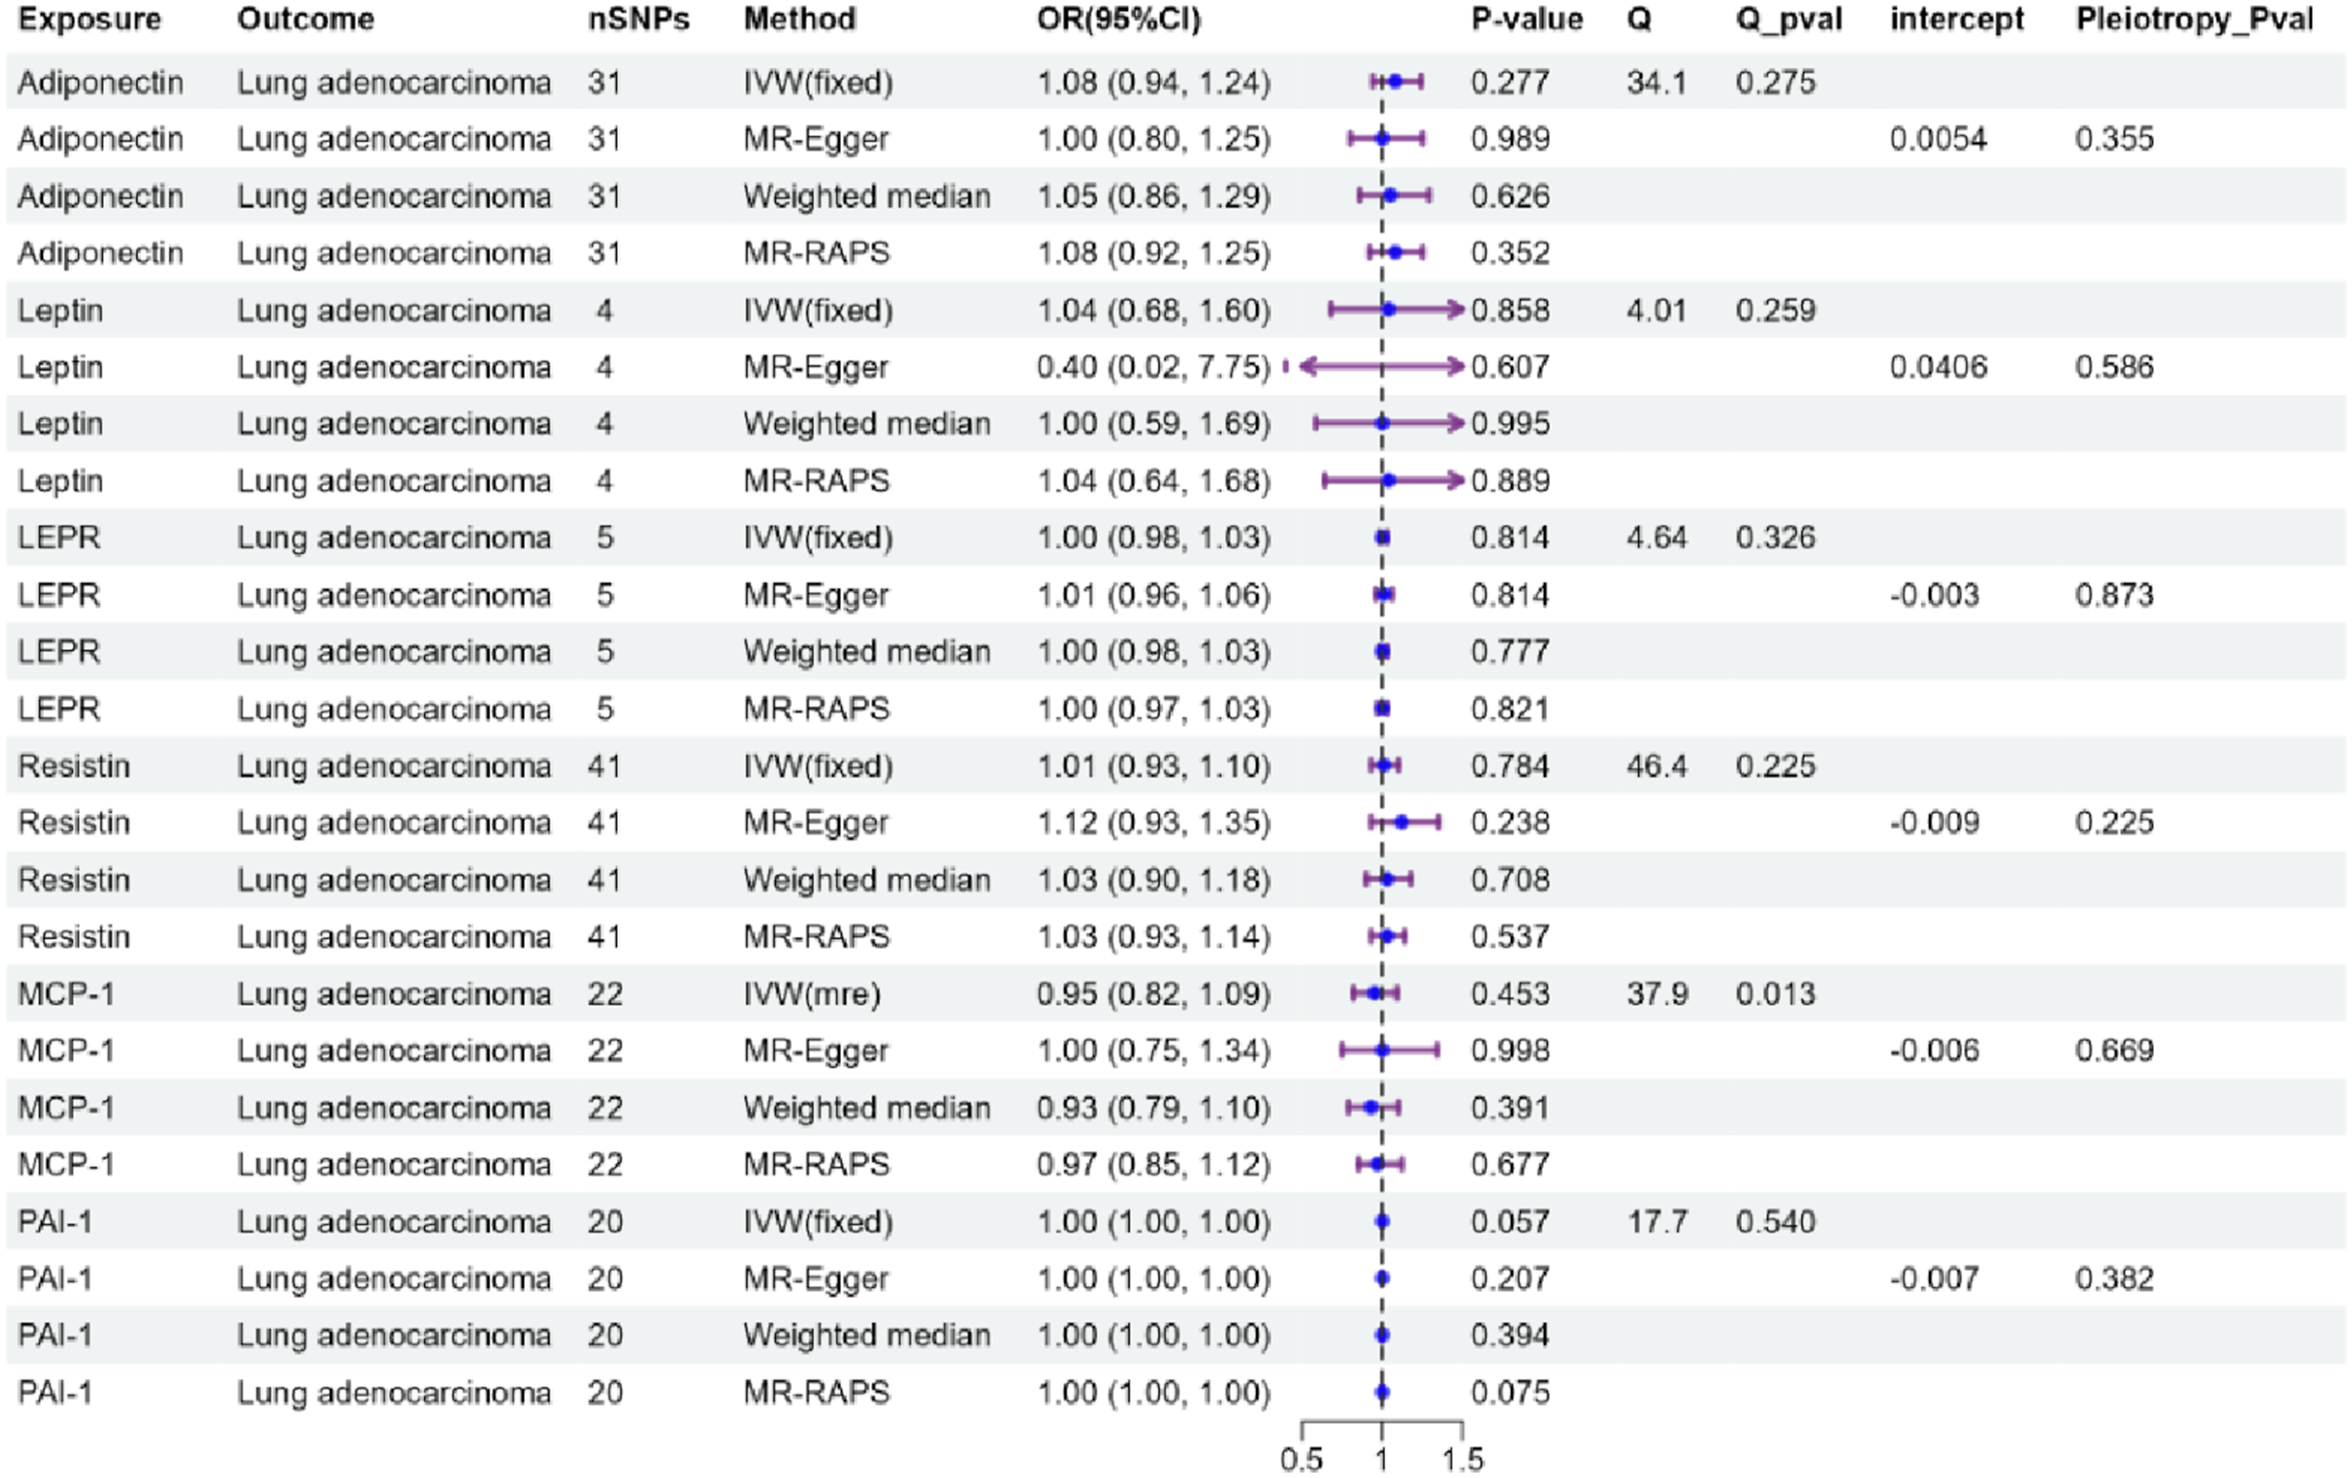
One standard deviation (SD) increased in Leptin receptor (LEPR) was associated with the risk of LUSC by IVW analysis (Figure 4, OR: 1.05, 95% CI: 1.01-1.08; P: 0.05 < 0.0125). The analysis had sufficient statistical power (Table S3, power > 80%). WEM and MR-RAPS results were consistent with IVW findings (Table S4). No causal effects of adiponectin, leptin, resistin, MCP-1, and PAI-1 on LUSC were found (Figure 4, P > 0.05). No horizontal pleiotropy was detected by MR-Egger intercept estimates (Pleiotropy p-value > 0.05), and no heterogeneity was detected by Cochran’s Q test (Q p-value > 0.05). MR-Steiger filtering results indicated no invalid genetic instruments for these MR analyses (Table S5). MR results of the association of adipokines and squamous cell lung cancer
We also found no causal association between the six adipokines and SCLC by IVW analysis (Figure 5, P > 0.05). No horizontal pleiotropy was detected by MR-Egger intercept estimates (Pleiotropy p-value > 0.05), and no heterogeneity was detected by Cochran’s Q test (Q p-value > 0.05). MR-Steiger filtering results indicated no invalid genetic instruments for these MR analyses (Table S5). MR results of the association of adipokines and small cell lung carcinoma
3.3 Sensitivity Analyses
A series of sensitivity analyses were employed to assess potential horizontal pleiotropy. No horizontal pleiotropy was detected by MR-Egger intercept estimates (Pleiotropy p-value > 0.05). Moreover, the association between the six adipokines and lung cancer and its subtypes was not driven by any single SNP (Figures S1-S4).
3.4 High Expression of LEPR Associated With Unfavorable Survival of LUSC Patients
We employed the IHC staining to explore the expression of LEPR in LUSC. As a results, we found the increased expression of LEPR in tumor tissues compared with adjacent normal tissues in LUSC patients (Figure 6A–C). Additionally, LUSC patients were distributed into high expression of LEPR and low-expression of LEPR according to the median value of H-score, then survival analysis indicated the patients with high expression of LEPR exhibited poor survival status compared to who with low expression of LEPR (Figure 6D). These findings suggested that LEPR expression associated with risk of LUSC. High expression of LEPR associated with unfavorable survival of LUSC patients. (A). Representative images of LEPR IHC staining in LUSC tumor tissue microarray are presented. Scale bar = 100 μm or 200 μm. (B). Violin plot of the LEPR H-score between tumor tissues and adjacent normal tissues of LUSC patients. (C). Scatter plot of the LEPR H-score between tumor tissues and adjacent normal tissues of LUSC patients. (D). Survival analysis of the LUSC patients with high and low expression of LEPR. * P < 0.05, ** P < 0.01, and *** P < 0.001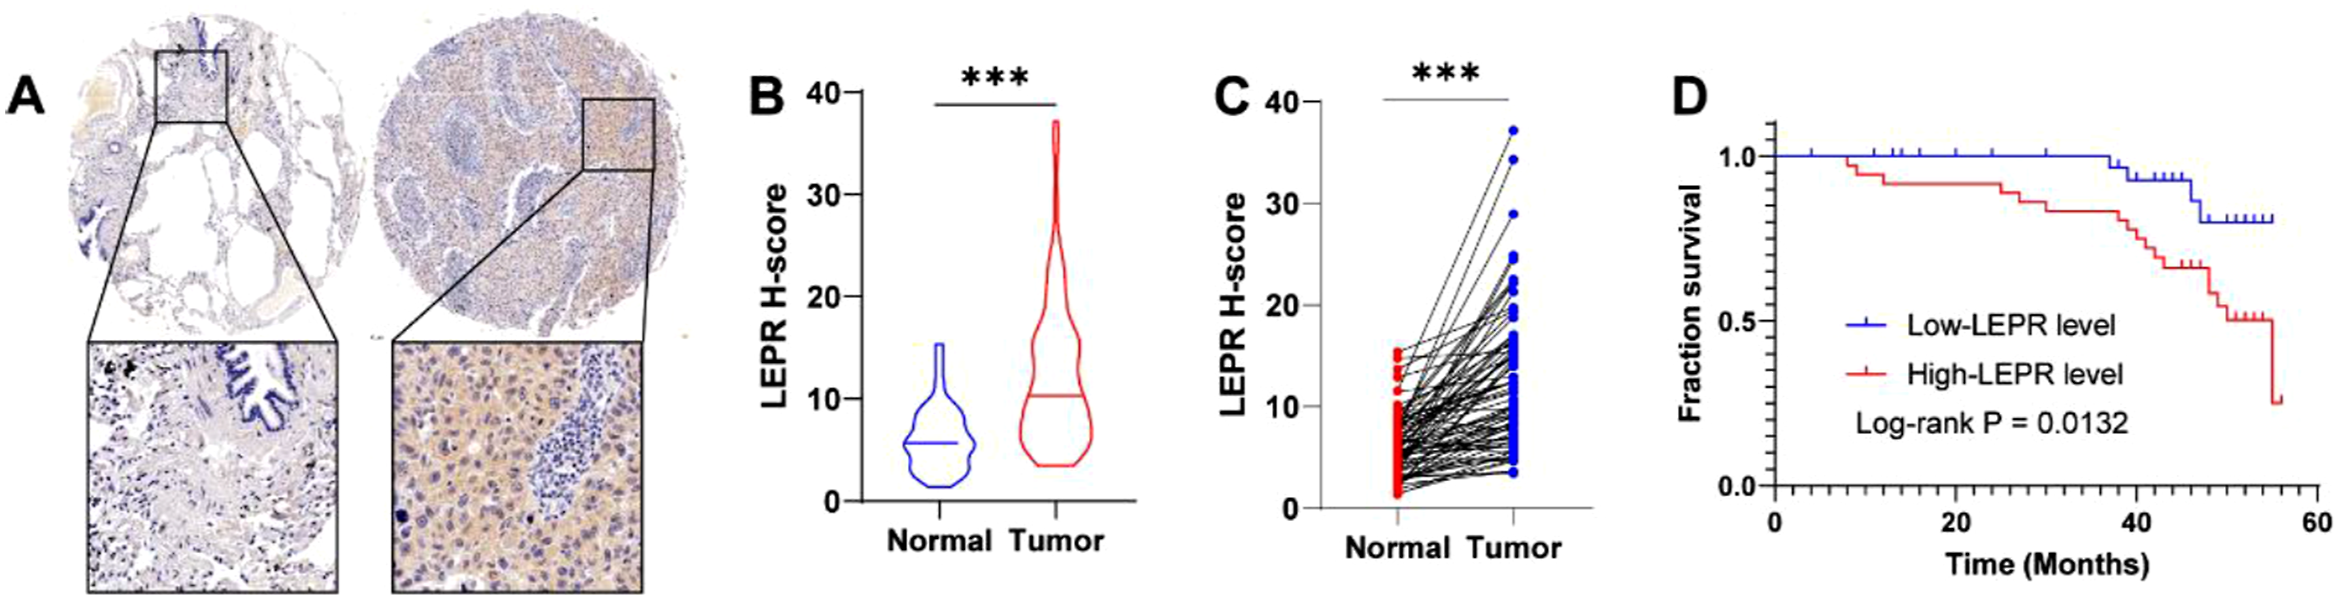
3.5 Knockdown of LEPR Suppresses Cell Proliferation and Invasion While Promoting Apoptosis
To further investigate the functional role of LEPR in LUSC in vitro, NCI-H2170 and SK-MES-1 cells were transfected with three independent siRNAs targeting LEPR (si-LEPR-#1, #2, #3) or a non-targeting negative control (NC-siRNA). Efficient knockdown of LEPR expression was confirmed at the mRNA level by qRT-PCR (Figure 6A). Due to its highest knockdown efficiency, si-LEPR-#3 was selected for subsequent experiments. CCK-8 assays demonstrated that LEPR knockdown significantly reduced cell viability in both H2170 and SK-MES-1 cells compared with control cells (Figure 7B). Consistently, Transwell invasion assays revealed that the number of invading cells was markedly decreased upon LEPR silencing (Figure 7D and F), indicating that LEPR is required for the invasive potential of LUSC cells. Furthermore, apoptosis analysis using Annexin V-FITC/PI staining followed by flow cytometry showed that LEPR knockdown induced a significant increase in apoptotic cell population compared with NC-siRNA-transfected cells (Figure 7C and E). Collectively, these results indicate that LEPR promotes proliferation and invasion while suppressing apoptosis in human LUSC cells. Knockdown of LEPR suppresses cell proliferation and invasion while promoting apoptosis in LUSC cells. (A). qRT-PCR analysis showing LEPR mRNA expression in NCI-H2170 and SK-MES-1 cells after transfection with three independent siRNAs targeting LEPR (si-LEPR-#1, #2, #3) or negative control siRNA (NC). si-LEPR-#3 exhibited the most efficient knockdown and was used for subsequent experiments. (B). Cell proliferation was assessed using the CCK-8 assay at 48 h post-transfection. LEPR knockdown significantly reduced cell viability in both NCI-H2170 and SK-MES-1 cells compared with NC-transfected cells. (C, E). Flow cytometry analysis of apoptosis using Annexin V-FITC/PI staining in NCI-H2170 and SK-MES-1 cells after LEPR knockdown. (D, F). Transwell invasion assays of H2170 and SK-MES-1 cells after LEPR knockdown. Representative images (upper panels) and quantification of invaded cells (lower panels) are shown. All data are presented as mean ± SD from three independent experiments. *P < 0.05, ****P < 0.001 versus NC. Scale bars: 200 μm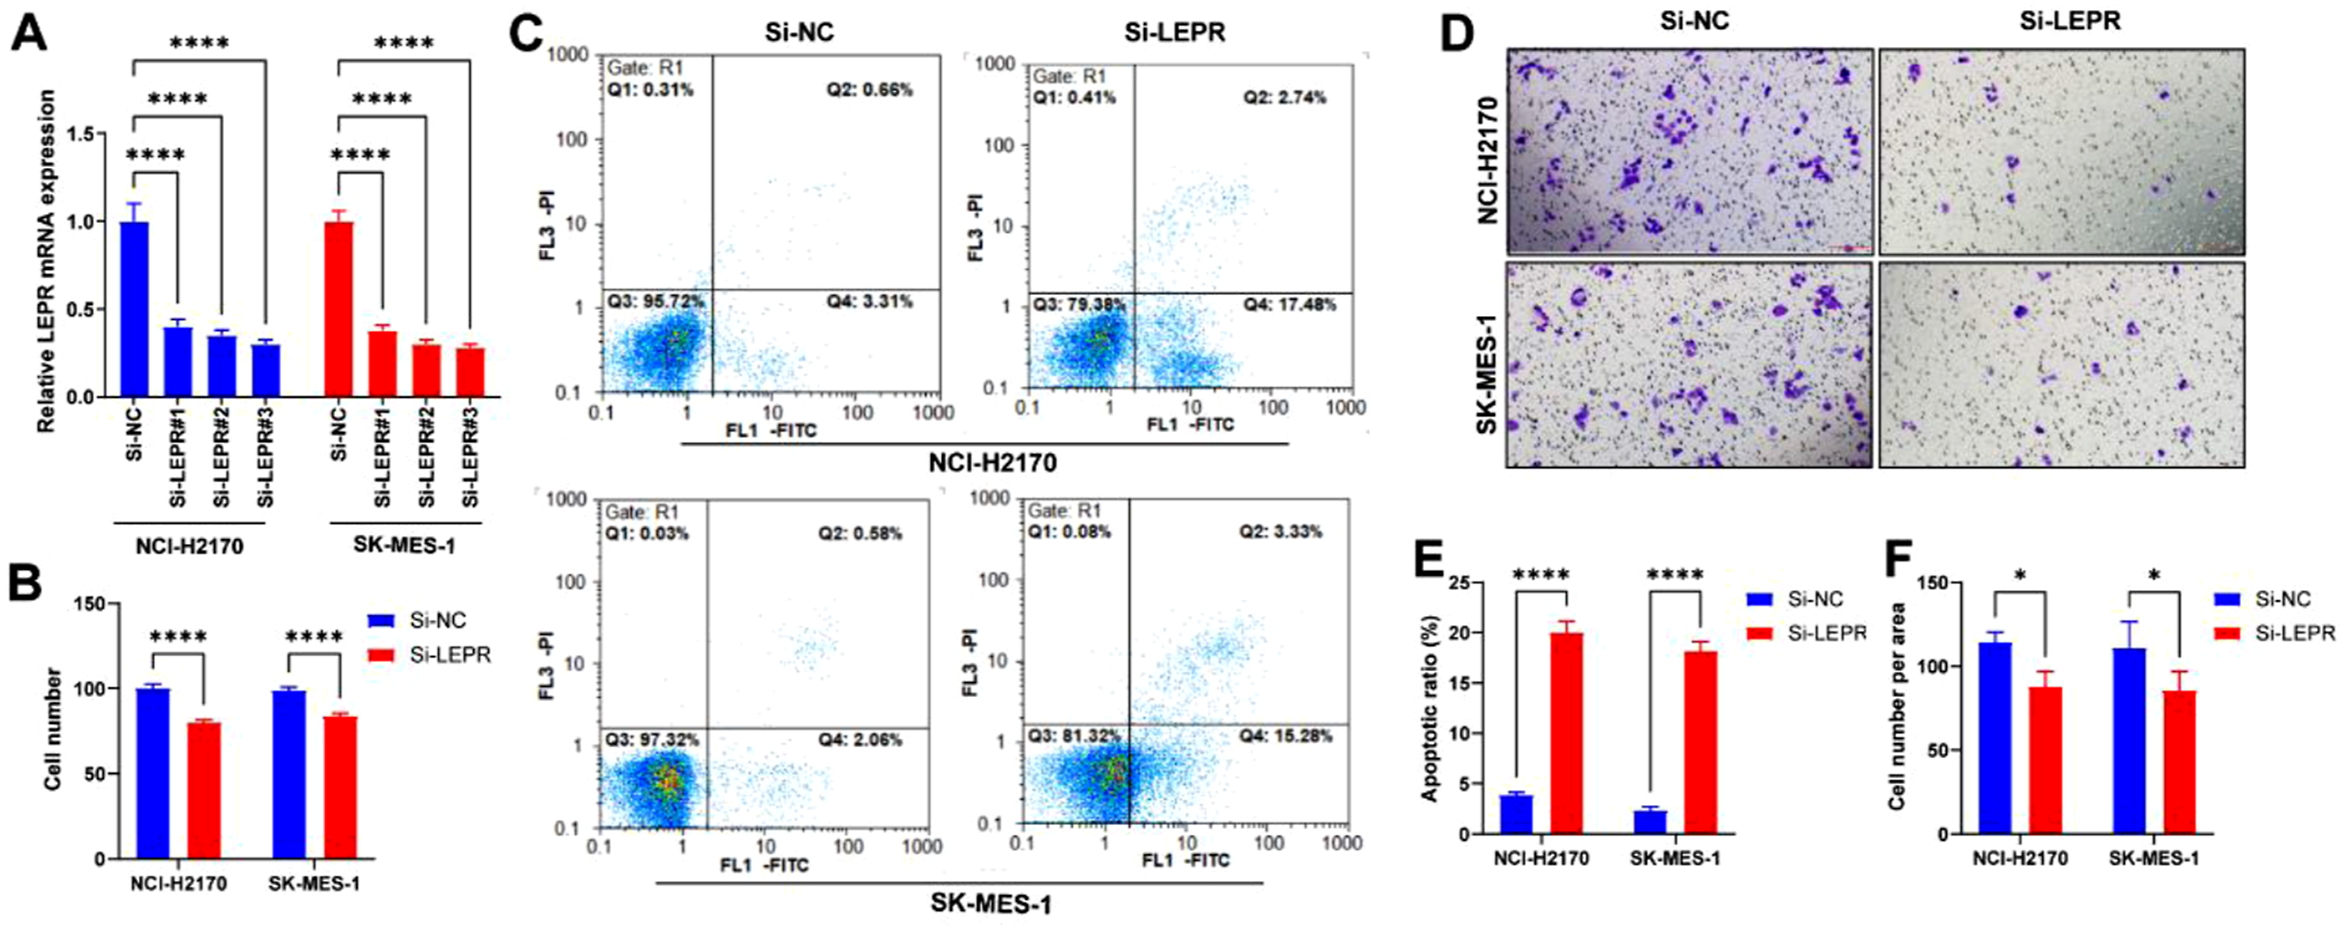
4. Discussion
Increasing evidence have indicated that adipokines are involved in lung cancer development, progression, and prognosis.28,29 In the present study, we discovered that the certain effects of adipokines on lung cancer and histological subtypes of lung cancer. We found that increase of Leptin receptor (LEPR) was associated with risk of LUSC, and no other adipokines associated with lung cancer and histological subtypes of lung cancer. These findings were further supported by tissue-based validation, which demonstrated higher LEPR expression in LUSC tumor samples compared with adjacent normal tissues, and its elevated expression correlated with poorer patient survival.
Importantly, functional experiments in LUSC cell lines (NCI-H2170 and SK-MES-1) provided mechanistic insights into the role of LEPR in tumor progression. siRNA-mediated knockdown of LEPR significantly inhibited cell proliferation and invasion, while promoting apoptosis, indicating that LEPR contributes to the aggressive phenotype of LUSC cells. Taken together, our results suggest that LEPR not only serves as a potential biomarker for LUSC risk but may also play a critical role in tumor growth and invasion, highlighting its potential as a therapeutic target.
Leptin (LEP) is a polypeptide hormone composed of 167 amino acids, known for its role in regulating neural, immune, and endocrine functions.30-32 It binds to the LEPR to activate various intracellular signaling pathways, including TGF-β, 33 JAK/AKT/STAT, 34 PI3K/ATK, 35 HIF,36,37 and MAPK signaling pathways. 35 The roles of LEP and LEPR in carcinogenesis, development, and progression are controversial. In breast cancer, patients with high expression of LEPR have worse recurrence-free survival (RFS) compared to those with low LEPR expression. 38 However, a case-control study suggests that neither LEP nor the LEPR gene has a strong association with premenopausal breast cancer risk, although there is a suggestive association between the LEPR gene and breast cancer grade. 39 Polymorphic variations in the LEP and LEPR genes are associated with disease-free survival (DFS) and colorectal cancer (CRC)-specific survival in the Newfoundland Familial Colorectal Cancer Study. 40 Another clinical study supports that LEP and LEPR are linked to CRC risk. 41 However, no significant differences in serum LEP levels and tissue LEPR expression were observed in CRC patients in Northern Iran. 42 These discrepancies may be due to population stratification caused by factors such as different races, regions, diets, and lifestyles.
LEPR has been recognized as a metabolic checkpoint for pulmonary inflammation, sustaining AMPK signaling in alveolar macrophages (AMs) to suppress necroptosis and subsequently attenuate pulmonary inflammation. 43 LEP and LEPR are highly expressed in NSCLC and accelerate its progression, 44 and they can serve as independent prognostic factors for NSCLC. 45 Polymorphisms in the LEPR gene have been identified as being associated with the occurrence and lymph node metastases in NSCLC patients. 46 Thus, LEPR may play a vital role in the etiology and development of NSCLC. Our findings support that high LEPR expression is linked to an increased risk of LUSC.
There are several advantages to our Mendelian randomization (MR) analysis. Firstly, the GWAS summary statistics used in this study are derived from individuals of European ancestry, which helps to avoid bias caused by population stratification. Secondly, we conducted rigorous checks for multiplicity and heterogeneity of our instrumental variables, and performed sensitivity analyses and Q-tests using multiple methods to ensure the stability of our analytical results. Finally, we validated our findings in external populations.
However, some limitations should also be considered. First, the focus on a single European ancestry limits the generalizability of our findings to other populations. Secondly, relaxing the IV significance threshold to P < 5×10^-6 introduces the possibility of false positives and bias, although the consistent F-statistics >10 suggest that weak instrument bias is less likely. In addition, the number of SNPs (nSNPs) used as instrumental variables for leptin and LEPR was relatively limited, which may reduce statistical power and potentially compromise the reliability of sensitivity analyses, including MR-PRESSO. Consequently, these results should be interpreted with caution. Therefore, further validation in larger and more diverse populations is warranted, and additional bioinformatic and experimental approaches are needed to confirm our findings.
5. Conclusion
Taken together, our MR study highlights the causal effects of LEPR on LUSC. These findings may offer potential diagnostic and treatment targets for LUSC, and support the use of dietary improvements in conjunction with treatment to combat tumors.
Supplemental Material
Supplemental Material - LEPR Contributes to Lung Squamous Cell Carcinoma: Insights From Mendelian Randomization and Experimental Studies
Supplemental Material for LEPR Contributes to Lung Squamous Cell Carcinoma: Insights From Mendelian Randomization and Experimental Studies by Wenhua Hu, Guowei Wu, Yanming Lin, Shiliang Li, Zhibin Lin, Yuting Chen, Zhen Cheng, Junxuan Zeng, Zhixiong Yang, Yongcun Wang in Cancer Informatics
Footnotes
Acknowledgements
The authors acknowledge all individuals involved for their tremendous efforts and dedication, making these valuable resources available for research purposes.
Author Contributions
Writing, review and editing, Conceptualization, Supervision: Yongcun Wang and Zhixiong Yang.
Formal Analysis, Software, Writing original draft: Wenhua Hu and Guowei Wu.
Methodology, Data curation, Investigation: Yanming Lin.
Visualization, Investigation, Project administration: Shiliang Li and Zhibin Lin.
Conceptualization, Formal Analysis, Methodology, Supervision: Yuting Chen, Zhen Cheng, and Junxuan Zeng.
Funding
The authors received no financial support for the research, authorship, and/or publication of this article.
Declaration of Conflicting Interests
The authors declared no potential conflicts of interest with respect to the research, authorship, and/or publication of this article.
Data Availability Statement
All datasets used in this study have been described in Methods section and supplied in the supplementary tables.
Supplemental Material
Supplemental material for this article is available online.
Appendix
References
Supplementary Material
Please find the following supplemental material available below.
For Open Access articles published under a Creative Commons License, all supplemental material carries the same license as the article it is associated with.
For non-Open Access articles published, all supplemental material carries a non-exclusive license, and permission requests for re-use of supplemental material or any part of supplemental material shall be sent directly to the copyright owner as specified in the copyright notice associated with the article.