
Abstract
Background:
Pancreatic ductal adenocarcinoma (PDAC) is a highly lethal malignancy with a dismal 5-year survival rate, largely due to the absence of reliable biomarkers for early detection. The molecular mechanisms underpinning PDAC pathogenesis remain incompletely understood, highlighting the urgent need for novel diagnostic strategies.
Objective:
This study aimed to integrate eQTL-driven Mendelian randomization (MR) with transcriptomic and genome-wide association data to identify causal PDAC-associated genes and construct a diagnostic nomogram based on 5 hub genes (CTSC, SMYD3, MFGE8, IGFBP7, POC1B) for early detection of pancreatic ductal adenocarcinoma (PDAC).
Methods:
Transcriptomic data from GSE62165 and GSE25471 were retrieved from the Gene Expression Omnibus (GEO) and processed for differential expression using LIMMA and GEO2R, followed by batch correction and weighted gene co-expression network analysis (WGCNA). Summary-level eQTL statistics were obtained from OpenGWAS, and GWAS data included over 5000 PDAC cases. MR analysis was performed using inverse variance weighted (IVW) as the primary approach, supplemented with MR-Egger, weighted median, weighted mode, and MR-PRESSO. Instrument strength, pleiotropy, and heterogeneity were assessed via F-statistics, Egger intercept, and Cochran’s Q test. Candidate genes were filtered using a consensus approach combining random forest (RF), support vector machine-recursive feature elimination (SVM-RFE), and Lasso regression. Diagnostic performance was evaluated via ROC curves, C-index, calibration plots, and decision curve analysis. Mechanistic insights were derived from KEGG and GO enrichment analyses, as well as protein-protein interaction (PPI) network analyses.
Results:
Five eQTL-associated hub genes—
Conclusions:
This study presents a multi-omics, MR-informed framework for identifying eQTL-regulated biomarkers of PDAC. The identified hub genes offer promising avenues for early detection, while the mechanistic mapping of the PI3K–Akt pathway provides translational insights. These findings warrant further validation in clinical and experimental settings and hold potential to reshape PDAC diagnostic strategies.
Pancreatic ductal adenocarcinoma (PDAC) remains a formidable clinical challenge due to its aggressive nature and lack of effective early diagnostic biomarkers. To address this, we integrated transcriptomic data, genome-wide association studies (GWAS), and expression quantitative trait loci (eQTL) information using Mendelian randomization (MR) to identify genes causally associated with PDAC risk. Differentially expressed genes were identified across 2 GEO datasets (GSE62165, GSE25471) and prioritized using weighted gene co-expression network analysis (WGCNA). MR analysis employing IVW, MR-Egger, weighted median, and MR-PRESSO identified 5 hub genes—CTSC, SMYD3, MFGE8, IGFBP7, and POC1B—as significant causal drivers of PDAC. These genes were incorporated into a diagnostic model constructed using machine learning approaches (random forest, SVM-RFE, Lasso), which achieved strong classification performance (AUC > 0.85) and excellent calibration (C-index = 0.92). Functional enrichment and protein-protein interaction analyses revealed that CTSC regulates the ECM-integrin–PI3K–Akt signaling pathway, contributing to tumor cell proliferation and survival. The findings establish a multi-omics-based biomarker panel with strong diagnostic utility and mechanistic relevance, suggesting a potential framework for future translational validation in clinical cohorts.
Keywords
Highlights
Integration of GWAS, eQTL, and transcriptomic data for PDAC risk gene discovery.
MR identifies CTSC, SMYD3, MFGE8, IGFBP7, POC1B as causal hub genes.
High-accuracy diagnostic nomogram model developed (C-index = 0.92).
PI3K/AKT signaling implicated in PDAC progression.
Translational potential for early detection and therapeutic targeting of PDAC.
Introduction
To date, GWASs have identified over 30 genomic loci associated with PDAC risk. 9 However, the precise genes or regulatory elements through which these variants exert functional effects remain largely undefined. Expression quantitative trait loci (eQTLs)—genomic regions that modulate gene expression levels—represent a valuable tool to bridge this gap. eQTLs are categorized as cis-eQTLs, located within ± 1 Mb of their target genes, or trans-eQTLs, which influence distal gene expression via long-range regulatory interactions.28,29 By linking non-coding genetic variation to transcriptomic changes, eQTLs provide mechanistic insight into cancer susceptibility and tumor biology.30 -32 Several studies have demonstrated that eQTLs contribute to oncogenesis in various cancers,33 -36 such as NTN4 eQTLs in breast cancer 37 and splicing QTLs (sQTLs) driving transcriptomic dysregulation in non-small cell lung cancer. 38 When integrated with GWAS summary statistics, Mendelian randomization (MR) enables causal inference between gene expression traits and disease outcomes, providing a robust framework for identifying functionally relevant genes. 39
Unlike GWAS, which identifies disease-associated genomic loci, expression quantitative trait loci (eQTLs) map genetic variants that directly regulate gene expression levels. Cis-eQTLs localize near target genes (±1 Mb), while trans-eQTLs exert distal effects.28,29 Integrating eQTLs with GWAS via MR enables causal inference between gene expression and disease.
Beyond risk association, eQTLs influence key oncogenic processes, including tumor progression, treatment response, and outcomes of immunotherapy. As such, they are increasingly recognized as promising biomarkers for both early diagnosis and therapeutic targeting. We hypothesize that specific pancreatic eQTLs mediate PDAC risk by driving transcriptional dysregulation of pathogenic genes. By integrating eQTL and GWAS data using MR, we aim to identify causal PDAC-associated genes and elucidate the regulatory pathways underpinning early tumor development. This approach holds potential to uncover clinically actionable biomarkers that enable timely intervention in high-risk populations.
Despite growing understanding of PDAC pathogenesis, no standardized screening protocols currently exist for asymptomatic individuals. 40 Comprehensive identification of both heritable and non-heritable risk factors is essential for stratifying population-level risk and informing targeted screening strategies. Systematic characterization of regulatory single-nucleotide polymorphisms (SNPs) that influence gene expression will advance mechanistic insight into PDAC and potentially transform diagnostic paradigms.
To our knowledge, this study represents the first integrative investigation linking eQTLs to PDAC pathogenesis through a comprehensive Mendelian randomization framework. Leveraging publicly available GWAS and transcriptomic datasets, we performed 2-sample MR analyses to identify causal eQTL-gene-disease relationships, supported by sensitivity and pleiotropy testing. Weighted gene co-expression network analysis (WGCNA) and pathway enrichment analysis were employed to characterize functional modules relevant to PDAC. To translate these findings into clinical practice, we constructed a diagnostic model using machine learning approaches—random forest (RF), support vector machine-recursive feature elimination (SVM-RFE), and Lasso regression—and evaluated its predictive accuracy using receiver operating characteristic (ROC) curves, calibration plots, and decision curve analysis (DCA). A final nomogram integrating key diagnostic genes was developed for individualized risk assessment.
By integrating genomic, transcriptomic, and causal inference methods, this study advances both mechanistic understanding and diagnostic precision in PDAC. The identification of eQTL-mediated hub genes and their involvement in key oncogenic pathways, particularly the ITGAV/ITGB3–PI3K–Akt signaling axis, provides a foundation for translational biomarker development. Our findings establish a framework for future validation using patient-derived models, ultimately supporting the development of precision diagnostics and targeted therapeutics in pancreatic cancer.
Materials and Methods
Data Sources and Preprocessing
Transcriptomic data for pancreatic ductal adenocarcinoma (PDAC) were obtained from the Gene Expression Omnibus (GEO) under accession numbers GSE62165 and GSE25471. Raw expression profiles were preprocessed using standard R packages, and batch effects were corrected using ComBat in the sva package, with empirical Bayes adjustment for site-specific biases in GSE62165 and GSE25471. Genome-wide association summary statistics for PDAC were derived from a large-scale meta-analysis encompassing 5430 histologically confirmed cases of PDAC. eQTL summary-level data were retrieved from the OpenGWAS Project (https://gwas.mrcieu.ac.uk/; Supplemental Table 1), comprising 19 942 individuals of European ancestry. Only cis-eQTLs—defined as SNPs located within ±2 Mb of a gene’s transcription start site (TSS)—were included for downstream Mendelian randomization (MR) analysis. SNPs reaching genome-wide significance (P < 5 × 10⁻⁸) were retained for further instrument selection.
Instrument Selection and MR Design
Genetic instruments were selected based on genome-wide significance (P < 5 × 10⁻⁸) and independence, as determined by linkage disequilibrium (LD) clumping (r2 < 0.001, clumping window = 10 000 kb). The final instrumental variables (IVs) were restricted to cis-eQTLs to minimize horizontal pleiotropy. Analyses used R v4.4.0 with packages: TwoSampleMR (v0.5.6), MendelianRandomization (v0.9.0), sva (v3.48.0) for batch correction. The inverse variance weighted (IVW) method served as the primary estimator. Supplementary MR estimators included MR-Egger, weighted median, weighted mode, and simple mode approaches to assess the consistency and robustness of causal effects. Instrument strength was evaluated using F-statistics, and weak instruments were excluded (F < 10). Effect alleles for exposure (eQTL) and outcome (PDAC GWAS) were harmonized to ensure consistent directionality. Palindromic SNPs with intermediate allele frequencies were excluded.
Assessment of Heterogeneity and Pleiotropy
To evaluate heterogeneity and horizontal pleiotropy among instruments, we performed Cochran’s Q test and MR-Egger intercept analysis, respectively. The HEIDI-outlier test was conducted to exclude variants with potential single-SNP-driven effects. The sensitivity of causal estimates was assessed through leave-one-out analyses, where each SNP was iteratively excluded. Additionally, MR-PRESSO (Mendelian Randomization Pleiotropy RESidual Sum and Outlier) was used to detect and correct for global horizontal pleiotropy. A false discovery rate (FDR) adjustment was applied using the Benjamini-Hochberg method to control for multiple testing across gene-trait associations.
Weighted Gene Co-expression Network Analysis (WGCNA) and Functional Enrichment
A total of 2090 differentially expressed genes (DEGs) were identified via LIMMA-based analysis of the GEO datasets, followed by batch correction. WGCNA was then applied to construct co-expression modules associated with PDAC status. Hub modules were selected based on module-trait correlation coefficients. Functional annotation of prioritized gene modules was performed using the
Machine Learning-Based Diagnostic Model Development
To optimize diagnostic gene selection, we applied 3 supervised machine learning algorithms: Random Forest (RF), Support Vector Machine Recursive Feature Elimination (SVM-RFE), and Least Absolute Shrinkage and Selection Operator (LASSO) regression. Model residuals were compared via reverse cumulative residual boxplots and distribution plots. Genes identified by all 3 algorithms were retained for model construction. Predictive performance was evaluated using receiver operating characteristic (ROC) curves and area under the curve (AUC) values. Model overfitting was minimized via cross-validation.
Nomogram Construction and Clinical Evaluation
A diagnostic nomogram was developed to visualize individual-level PDAC risk based on the selected feature genes. Gene-specific coefficients were transformed into risk points, and total risk scores were computed to stratify patients. Model calibration was evaluated using calibration plots, while clinical utility was assessed via decision curve analysis (DCA) and clinical impact curves (CICs). External validation was performed using an independent dataset from GEO to assess generalizability.
Mechanistic Exploration and Pathway Mapping
To further investigate underlying mechanisms, hub genes identified via MR and WGCNA were subjected to protein-protein interaction (PPI) network reconstruction using GeneMANIA (https://genemania.org/). Candidate genes, including CTSC and ITGB3, were annotated with GO and KEGG databases via
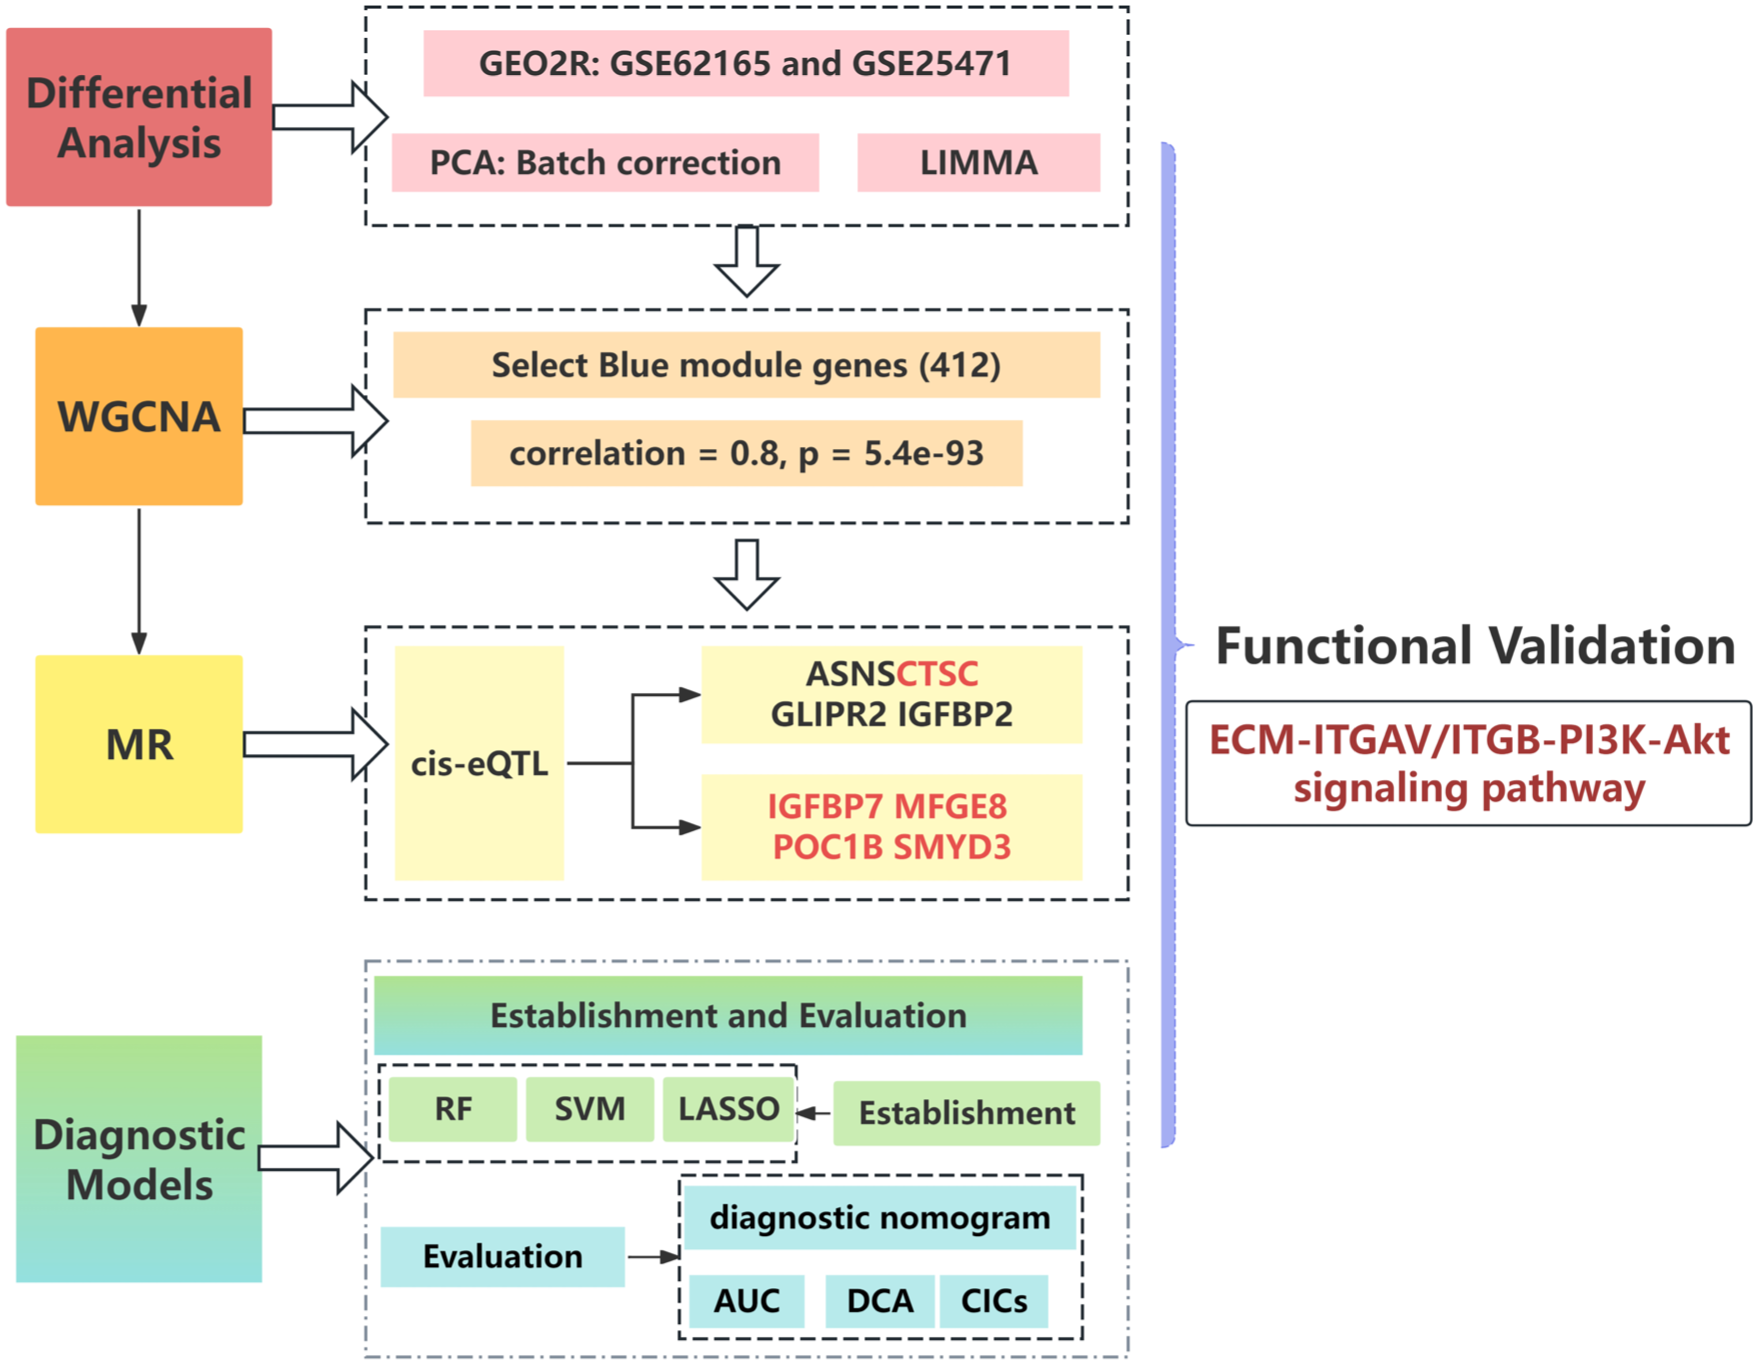
Overall study design. Schematic flowchart illustrating the integrated multi-omics workflow of this study. Transcriptomic data (GEO), eQTL mapping (OpenGWAS), Mendelian Randomization (MR), WGCNA, functional enrichment, and machine learning algorithms were combined to identify diagnostic biomarkers and causal pathways in PDAC.
Results
MR analysis prioritized eight causal genes (ASNS, CTSC, GLIPR2, IGFBP2, IGFBP7, MFGE8, POC1B, SMYD3), of which 5 (CTSC, SMYD3, MFGE8, IGFBP7, POC1B) were consolidated into a diagnostic model (Figure 3).
Transcriptomic Data Processing and Co-expression Network Construction
To characterize PDAC-related transcriptional signatures, 2 GEO datasets (GSE62165 and GSE25471) were analyzed using LIMMA and GEO2R, identifying 1898 overlapping differentially expressed genes (DEGs; Figure 2A-C). After batch effect correction via the
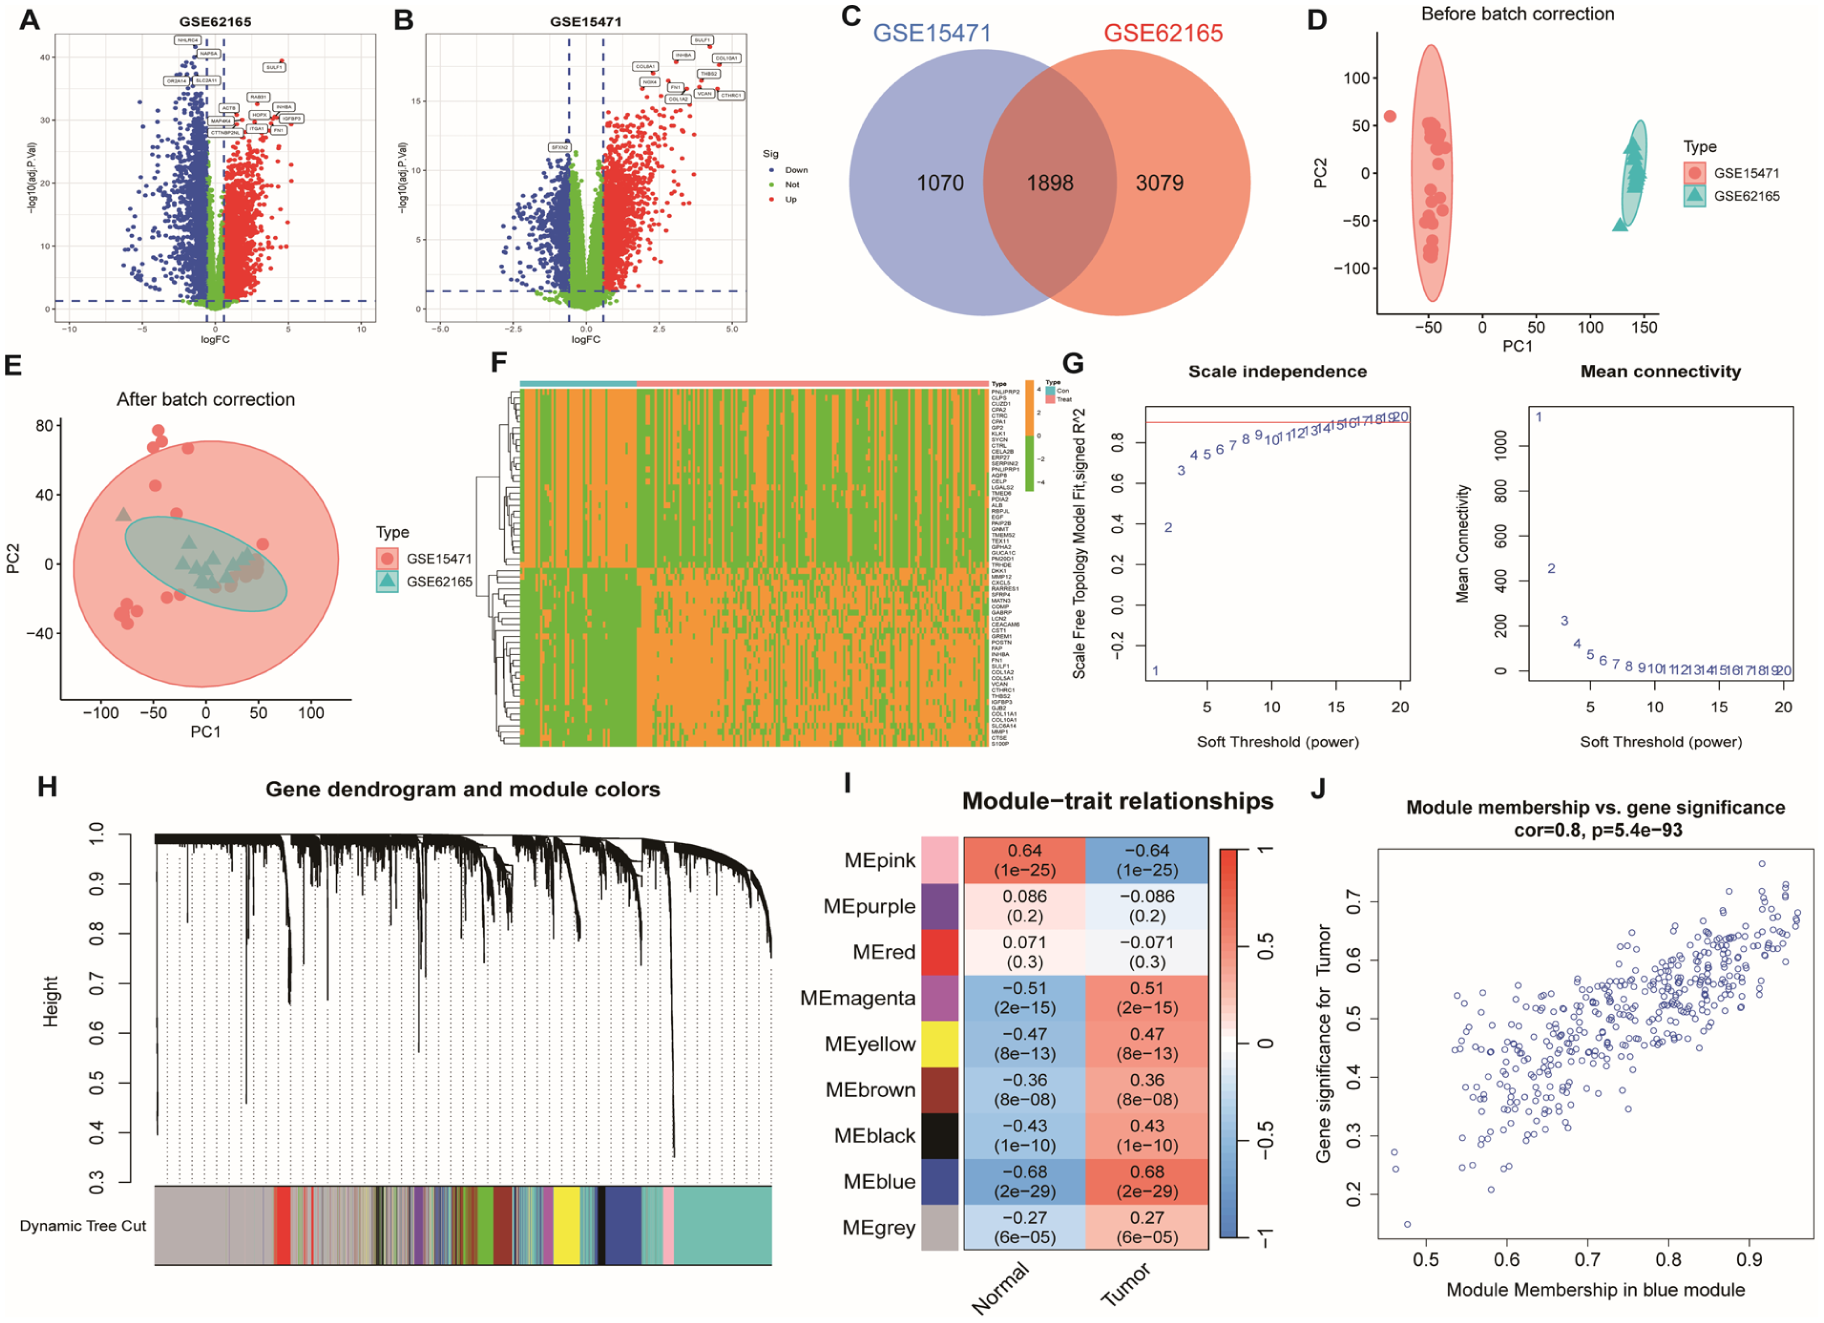
Differential expression and co-expression network analysis. (A–B) Volcano plots depicting differentially expressed genes (DEGs) between PDAC and normal tissues. (C) Venn diagram showing the overlap of key gene sets. (D–E) PCA plots of GSE62165 and GSE25471 datasets before and after batch correction. (F) Heatmap of upregulated and downregulated DEGs. (G) Model fit R² curve. (H) Dendrogram and module color assignment via WGCNA. (I) Heatmap of module–trait correlations. (J) Correlation between module membership (MM) and gene significance (GS) in the blue module (r = 0.8, P = 5.4e−93).
Instrument Selection and Strength Evaluation
Cis-eQTLs reaching genome-wide significance (P < 5 × 10⁻⁸) were selected as candidate instrumental variables (IVs). SNPs in high linkage disequilibrium (r2 > 0.001, window size = 10 000 kb) were excluded via clumping. All retained instruments showed strong strength (F-statistics: 12.5–89.3), surpassing the conventional threshold (F > 10), thus mitigating weak instrument bias. These criteria ensured the validity of assumptions regarding relevance, independence, and exclusion restriction for MR analysis.
Primary Mendelian Randomization Findings
Using a 2-sample Mendelian Randomization (MR) framework with the inverse-variance weighted (IVW) method, we identified 125 gene-trait pairs significantly associated with pancreatic ductal adenocarcinoma (PDAC) (P < .05; Supplemental Table 2). To prioritize biologically relevant candidates, we performed integrative filtering across 3 data layers: 1898 differentially expressed genes (DEGs) from cross-dataset analysis, 2090 DEGs identified via LIMMA, and 412 WGCNA-derived blue module genes. This yielded a refined set of 1721 PDAC-associated candidate genes (Figure 3A). Among these, 8 genes demonstrated statistically significant causal associations with PDAC based on MR analysis, including ASNS (odds ratio [OR] = 0.708, P = .011), CTSC (OR = 1.273, P = .041), GLIPR2 (OR = 1.850, P = .049), IGFBP2 (OR = 0.704, P = .038), IGFBP7 (OR = 1.378, P = .034), MFGE8 (OR = 1.387, P = .011), POC1B (OR = 1.824, P = .014), and SMYD3 (OR = 1.399, P = .041; Figure 4A and B). These findings highlight both risk-promoting and protective gene candidates, supporting their potential roles as eQTL-associated modulators of PDAC susceptibility.

Integration of DEGs and MR results to identify signature genes. (A) Venn diagram showing the intersection of 1898 DEGs, 2090 limma-derived DEGs, and 412 WGCNA blue module genes, identifying 1721 PDAC-associated candidates. (B) The overlap of upregulated DEGs and MR-derived risk loci (OR > 1) identified 6 disease-associated genes. (C) Overlap of downregulated DEGs and MR-derived protective loci (OR < 1) yielded 2 protective genes.

Mendelian randomization identifies causal genes for PDAC. (A) Forest plot showing causal effects (odds ratios with 95% CI) of 8 eQTL-associated genes on PDAC risk. (B) Scatter plot visualizing SNP-level effects used in MR analysis.
Sensitivity Analyses and Pleiotropy Assessment
Sensitivity analyses confirmed the robustness of the causal estimates. Leave-one-out analysis showed that no single SNP drove the association signal (Figure 5B). MR-Egger regression yielded intercepts not significantly different from zero (P > .05 for all genes), indicating no evidence of directional pleiotropy. The weighted median estimator confirmed significant associations for all 8 genes (P < .05), supporting consistent effect directions across analytical methods (Figure 6). MR-PRESSO detected no outlier SNPs that influenced causal inference, further affirming the validity. Cochran’s Q test revealed no significant heterogeneity among instruments (IVW Q P = .15; MR-Egger Q P = .22), indicating homogeneity in variant-level effects.

Sensitivity analysis of MR results. (A) Funnel plot evaluating heterogeneity among SNP instruments. (B) Leave-one-out analysis assessing the influence of individual SNPs on MR estimates.

Summary of Mendelian randomization findings. Forest plot displaying causal associations of candidate genes with PDAC from MR analysis, highlighting effect size and confidence intervals.
Functional Annotation of Causal Genes
Gene Ontology (GO) and KEGG pathway enrichment analyses revealed that the 8 MR-identified genes were significantly enriched in glucocorticoid signaling, growth factor binding, extracellular matrix organization, and insulin-like growth factor activity (Figure 7A). Cellular localization analysis highlighted enrichment in the endoplasmic reticulum lumen and extracellular matrix. KEGG analysis indicated involvement in amino acid biosynthesis, lysine degradation, and carbon metabolism pathways, suggesting functional convergence on metabolic reprograming and immune modulation during PDAC progression.
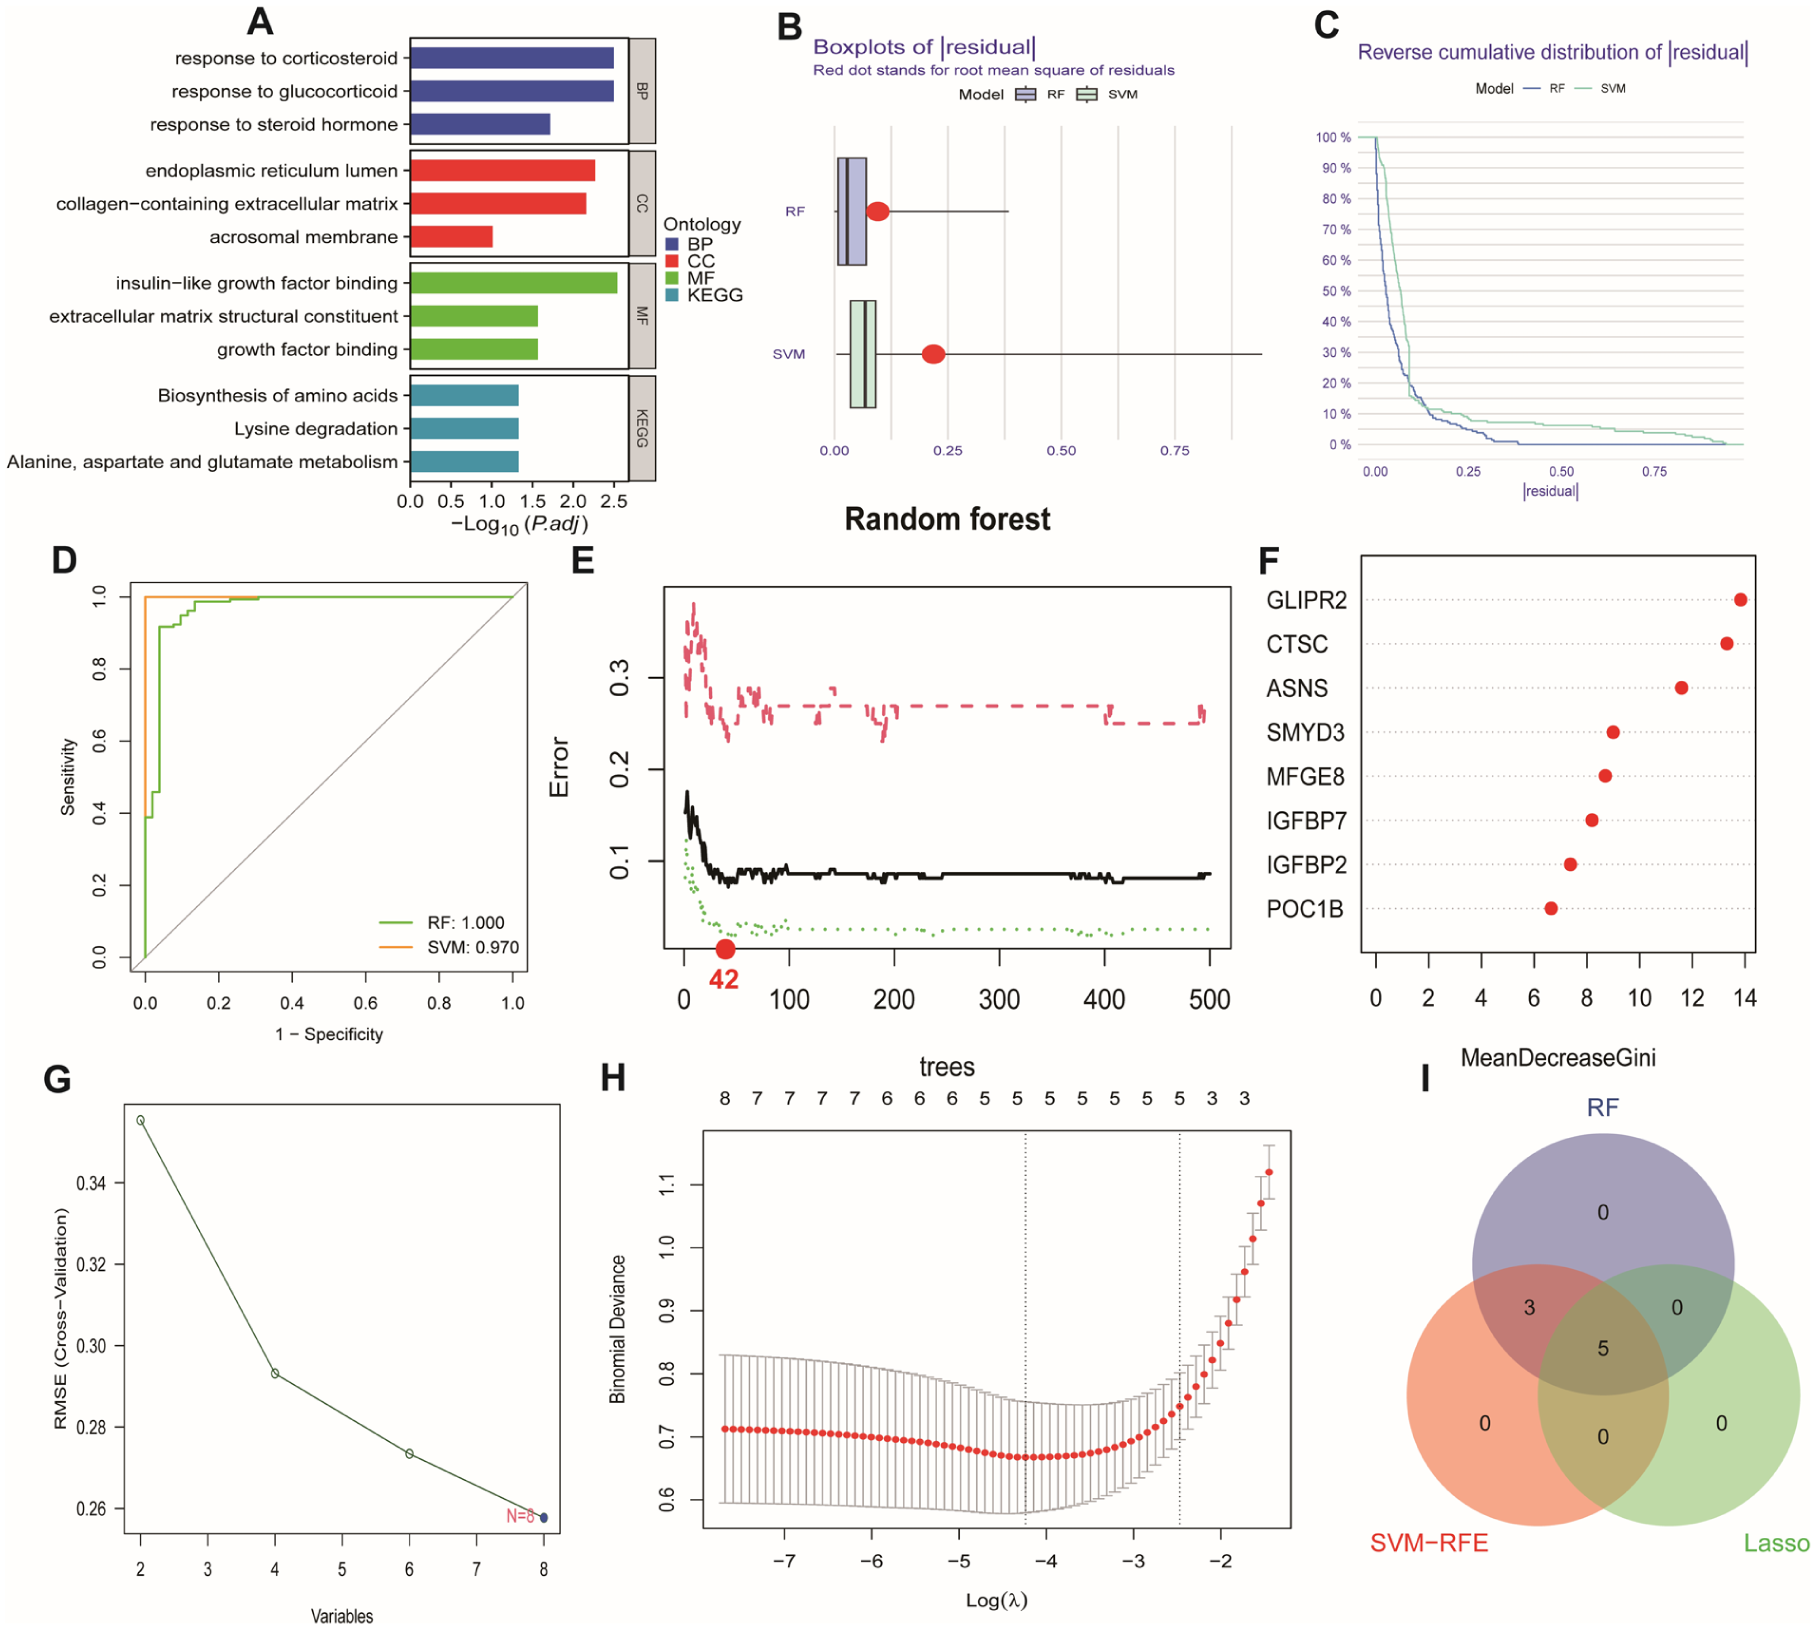
GO/KEGG enrichment score and establishment and of diagnostic model through machine learning. (A) GO/KEGG-enriched bar plot showing the top 3 pathways with the highest significance for Biological process (BP), Cellular component (CC), and Molecular function (MF). (B) Residual boxplots of Random Forest (RF) and Support Vector Machine (SVM). (C) Reverse cumulative residual distribution plots of Random Forest (RF) and Support Vector Machine (SVM). (D) ROC curves of Random Forest (RF) and Support Vector Machine (SVM) models. (E and F) Random Forest Plot and Importance Ranking Plot. Importance ranking of gene features in the random forest model based on the “Mean Decreased Gini” index. Gene importance ranking, with the x-axis showing gene names and the y-axis indicating importance scores, reflecting the discriminative power of genes in the model. (G) SVM Gene Selection Line Chart. Gene selection results using Support Vector Machine Recursive Feature Elimination (SVM-RFE). The x-axis represents the number or rank of features, and the y-axis shows classification performance metrics (eg, accuracy or error), optimizing the selection of critical gene subsets. (H) Confirmation intervals under each lambda in the LASSO regression. (I) Venn diagram identifying five5 consensus signature genes through intersection analysis.
Diagnostic Model Construction and Validation
The dataset (n = 320 samples) was split into 70% training (n = 224) and 30% validation (n = 96) sets for all machine learning algorithms. Random Forest (RF) and Support Vector Machine (SVM) algorithms were compared via residual analysis (Figure 7B and C), with both showing comparable diagnostic performance (AUC difference < 0.02; Figure 7D). Feature selection using RF, SVM-RFE, and LASSO identified 5 consensus diagnostic genes (Figure 7E-I). A nomogram based on these genes achieved excellent calibration and high diagnostic accuracy (C-index = 0.91; Figure 8A and B). Decision curve analysis (DCA) and clinical impact curves (CICs) confirmed the model’s clinical benefit, particularly at risk thresholds of 20% to 60% (Figure 8C and D), supporting its feasibility for population-based screening in high-risk cohorts.
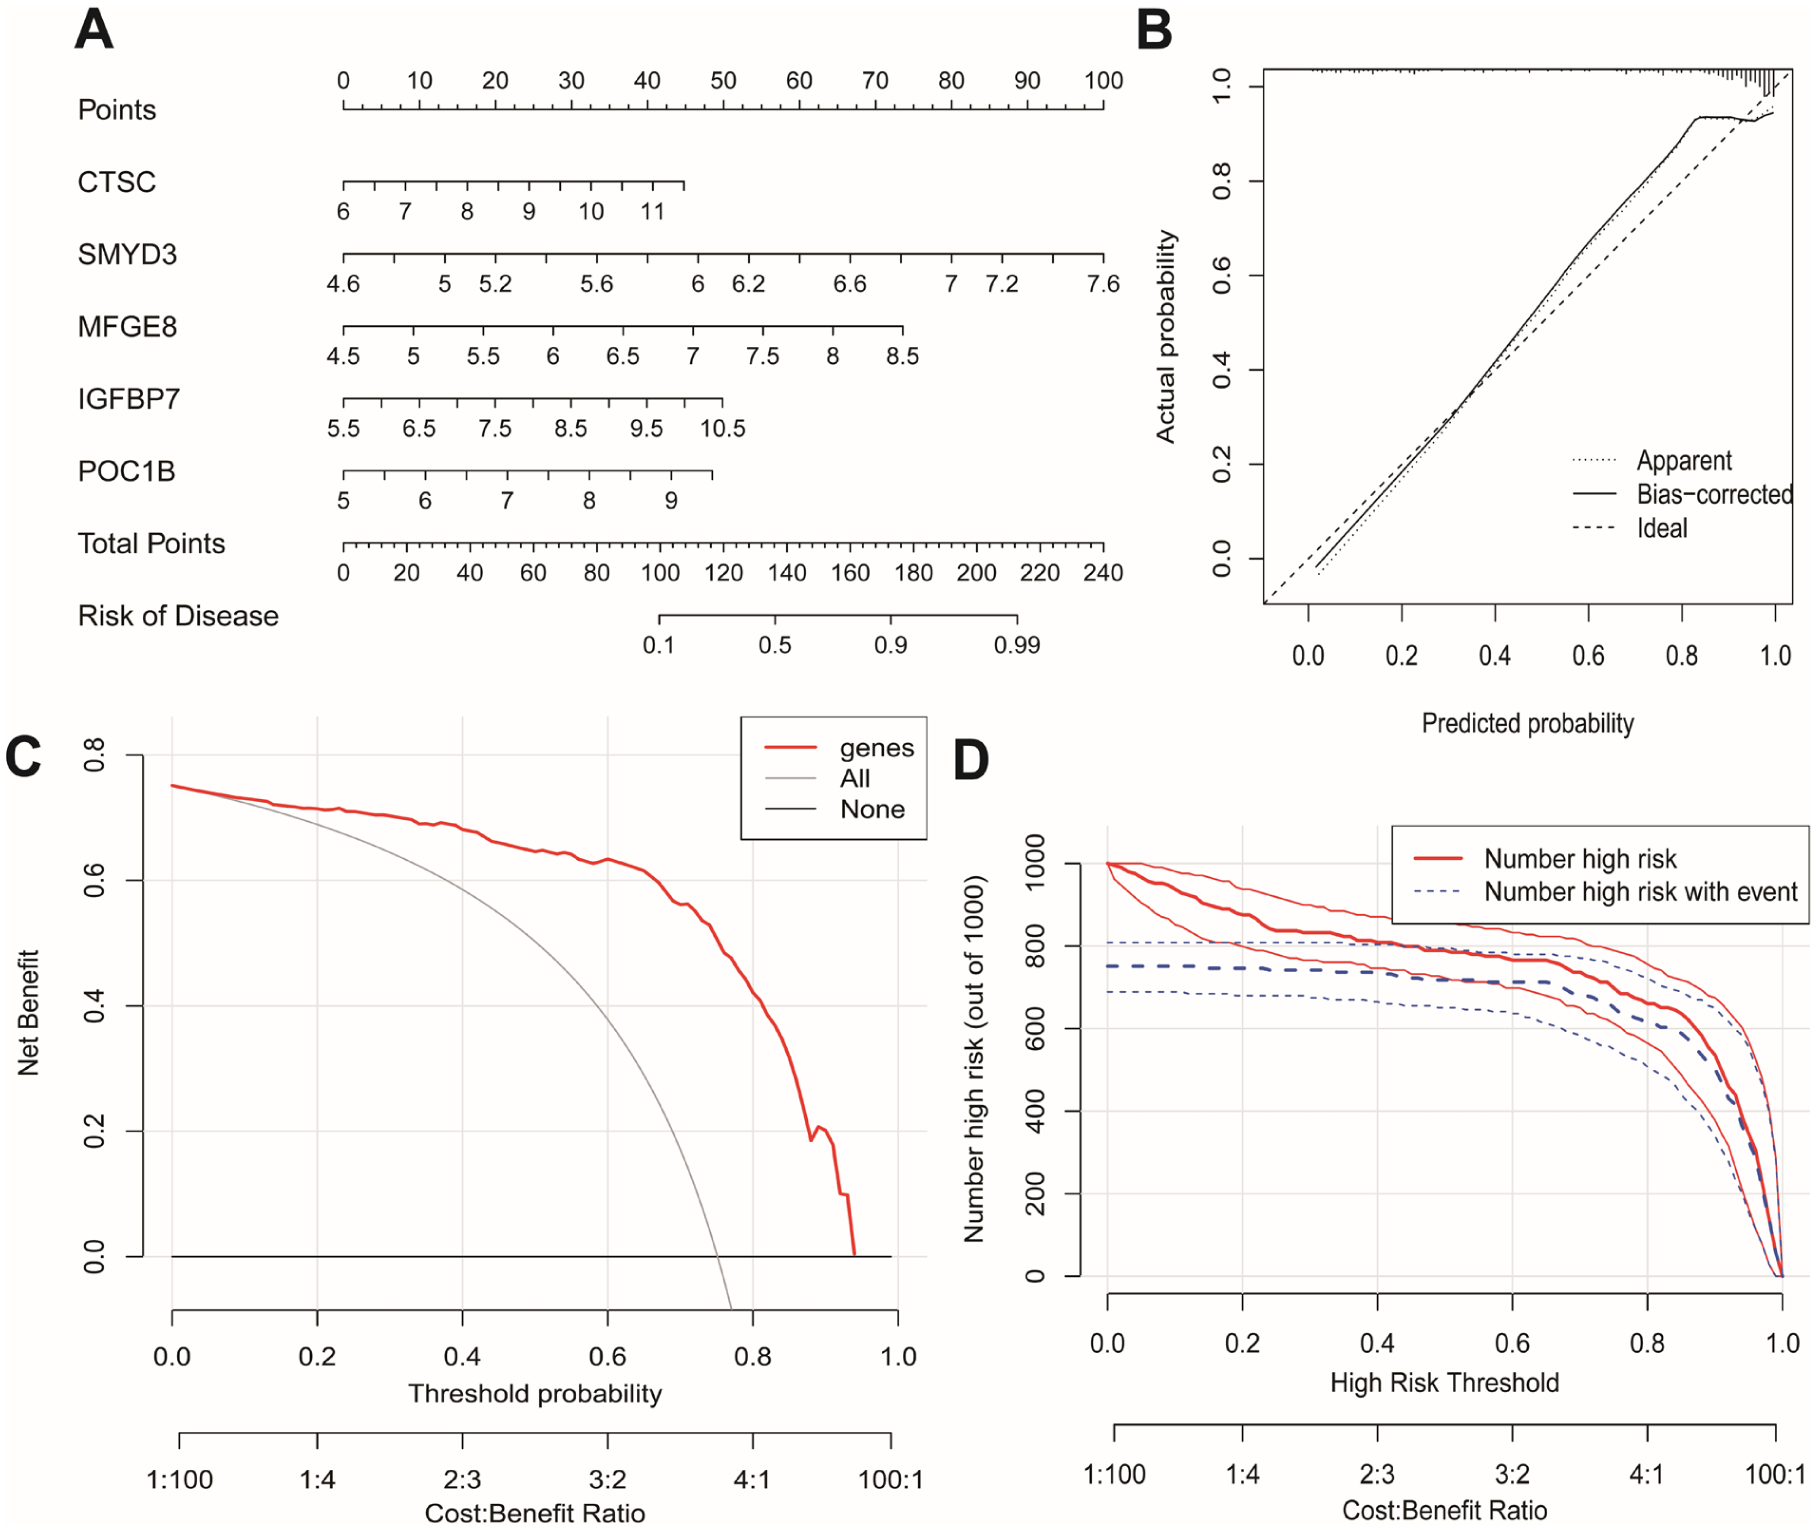
Validation of the diagnostic model. (A) Nomogram illustrating the predicted probability of PDAC based on selected gene expression levels. (B) Calibration plot comparing predicted versus observed probabilities. (C) Decision curve analysis (DCA) assessing clinical net benefit. (D) Clinical impact curves (CICs) evaluating population-level diagnostic performance.
Mechanistic Exploration via Network and Pathway Analysis
Protein–protein interaction (PPI) network analysis identified 25 highly interconnected PDAC hub genes, including CTSC, ITGAV, and ITGB3 (Figure 9A). Functional annotation revealed that these genes are involved in insulin-like growth factor binding and lipid metabolic regulation. Pearson correlation analysis demonstrated significant co-expression of CTSC with ITGB3 (r = .477, P < .05) and ITGAV (r = .568, P < .05; Figure 9B). KEGG pathway mapping showed convergence on the ECM–integrin–PI3K–Akt signaling axis (Figure 9C), suggesting CTSC as a central modulator of apoptosis resistance, ECM remodeling, and PDAC progression.

Protein–protein interaction (PPI) network and mechanistic validation. (A) PPI network of top 25 hub genes based on interaction degree. (B) Correlation plots showing associations between CTSC expression and integrins ITGB3 and ITGAV (P < .05). Pearson coefficients and linear regression lines are shown. (C) Schematic of ECM–integrin–PI3K–AKT pathway inferred from eQTL–gene interactions.
Discussion
Pancreatic ductal adenocarcinoma (PDAC) is a polygenic and multifactorial malignancy with complex and incompletely understood genetic architecture. Unlike other common cancers, the genetic susceptibility of PDAC remains underexplored, particularly regarding regulatory variants. While genome-wide association studies (GWAS) have identified risk loci, many of these lie in non-coding regions, suggesting that transcriptional regulation rather than protein-coding alterations may be involved. Expression quantitative trait loci (eQTLs), which modulate gene expression, serve as functional links between non-coding variants and disease-relevant transcriptional activity. In this study, we integrated transcriptomic data from GEO with GWAS-derived eQTL information using Mendelian randomization (MR) and weighted gene co-expression network analysis (WGCNA) to identify eQTL-driven genes and signaling pathways potentially causal in PDAC pathogenesis.
Our findings nominate CTSC, SMYD3, and MFGE8 as causal mediators of PDAC pathogenesis through distinct oncogenic mechanisms. Whereas ABO and NR5A2 are established PDAC risk genes, 48 our study implicates novel candidates: POC1B (centrosome integrity 49 ) and ASNS (asparagine synthetase). Unlike IGFBP7 (a known tumor suppressor 50 ), POC1B has not been previously linked to PDAC, suggesting its potential as a unique early biomarker. CTSC, a lysosomal protease, has previously been implicated in metastasis through the formation of neutrophil extracellular traps (NETs). 41 Its potential role in PDAC may involve the recruitment of immune cells and the promotion of tumor-promoting inflammation. SMYD3, an epigenetic regulator, has been shown to activate Ras/ERK signaling and drive transcriptional amplification in multiple cancers, including PDAC. 42 MFGE8, known for its immune-modulatory properties, may promote an immunosuppressive microenvironment by facilitating PD-L1 trafficking on extracellular vesicles, thereby contributing to immune escape and resistance to anti-PD-1 therapy. 43 Collectively, these genes highlight the interplay between immune modulation, epigenetic regulation, and tumor progression in PDAC.
Mechanistically, CTSC activates the ECM-integrin-PI3K/AKT axis (Figure 9C). This pathway drives PDAC progression by: (i) Enhancing cell survival via apoptosis resistance,44,45 (ii) Facilitating ECM remodeling to promote metastasis.60,61 Notably, CTSC was strongly associated with integrin family members ITGAV and ITGB3, and pathway enrichment confirmed convergence on the PI3K/AKT cascade.44,45 This axis is known to drive resistance to apoptosis and enhance oncogenic signaling in aggressive PDAC subtypes. Inhibitors of PI3K have shown efficacy in preclinical PDAC models, supporting the translational potential of targeting this network.46,47
In addition to well-established PDAC risk genes (eg, ABO, NR5A2), 48 our study identifies novel candidates, including POC1B and IGFBP7. POC1B is crucial for centrosome integrity and mitotic stability, 49 while IGFBP7, a well-established tumor suppressor, regulates TGF-β signaling and cell proliferation. 50 Their inclusion in our diagnostic model suggests potential utility as early biomarkers or therapeutic targets. The additive influence of these genes reflects the polygenic nature of PDAC and underscores the importance of integrating eQTL-based functional annotation into biomarker discovery frameworks.
Our machine learning-derived diagnostic model, integrating RF, SVM-RFE, and LASSO feature selection, outperformed conventional CA19-9 assays (AUC = 0.92). 51 Compared with multi-omics diagnostic tools in colorectal cancer, 52 our approach uniquely leverages eQTL-informed genetic drivers of PDAC, enhancing diagnostic sensitivity for early-stage disease. Future studies will extend validation to ctDNA-based platforms and integrate single-cell RNA sequencing (scRNA-seq) to account for tumor microenvironment heterogeneity.53,54
To our knowledge, 55 this is the first study to integrate GEO transcriptomic data, GWAS summary statistics, and eQTL information via MR to identify causally relevant genes in PDAC. Using TwoSampleMR, we established robust associations between eQTL-regulated genes (eg, CTSC, SMYD3, MFGE8) and susceptibility to PDAC. These findings provide a foundation for functional investigation of candidate genes such as CTSC, potentially linking neutrophil activation and NETosis to metastatic progression. 56 Similarly, SMYD3′s epigenetic function may intersect with FAK pathway activity, 57 and MFGE8 may contribute to immune evasion by reshaping extracellular vesicle signaling.58,59
Our results also support the ECM-integrin-PI3K/AKT axis as a core signaling pathway in PDAC susceptibility. Prior studies demonstrate that ECM remodeling drives PDAC aggressiveness through mechanotransduction and resistance to therapy.60,61 Integrins ITGAV and ITGB3, enriched in basal-like PDAC subtypes, interact with focal adhesion kinase (FAK) to promote chemoresistance.62,63 CTSC may modulate this axis through regulation of integrin expression or activity, contributing to cell adhesion and invasion. These findings warrant in vitro and in vivo validation to confirm the mechanistic link between eQTL-mediated gene regulation and kinase pathway activation.64 -66
The nomogram developed here achieved diagnostic accuracy comparable to cfDNA-based methylation panels (eg, EpiPanGI Dx, AUC = 0.88), 67 offering a potentially cost-effective screening alternative. Nevertheless, validation in neoadjuvant-treated cohorts is essential, as emerging evidence suggests that therapy-induced transcriptional plasticity—such as the reprograming of neuroendocrine progenitor-like cells—can confound diagnostic models. Future model iterations will incorporate spatial transcriptomics and proteomics to dissect intratumoral heterogeneity and improve robustness across clinical contexts. 68
This study has limitations. First, blood-derived eQTLs may not fully represent pancreas-specific expression, particularly within the diverse tumor microenvironment.69,70 Second, regulatory mechanisms such as histone modification or RNA methylation were not integrated, possibly missing key post-transcriptional effects. 71 Third, the European ancestry of the reference population may limit the generalizability of the results. Future studies should prioritize eQTL datasets from diverse populations and explore multi-omic QTLs—including mQTLs, sQTLs, and pQTLs—to comprehensively characterize genetic regulation in PDAC. 72
Conclusion
In summary, we identified 5 eQTL-associated hub genes—CTSC, SMYD3, MFGE8, IGFBP7, and POC1B—as putative causal mediators of PDAC development. Mechanistic analyses support a model in which CTSC promotes apoptotic resistance and cell cycle deregulation via the integrin-PI3K/AKT axis. These findings provide a foundation for biomarker development and therapeutic targeting, with future validation in organoid and animal models expected to bridge the gap between genetic epidemiology and translational oncology. 73
Supplemental Material
sj-docx-5-cix-10.1177_11769351251400465 – Supplemental material for Integrative Analysis of eQTL Genes Reveals Key Biomarkers and Mechanisms for Early Diagnosis of Pancreatic Ductal Adenocarcinoma
Supplemental material, sj-docx-5-cix-10.1177_11769351251400465 for Integrative Analysis of eQTL Genes Reveals Key Biomarkers and Mechanisms for Early Diagnosis of Pancreatic Ductal Adenocarcinoma by Xuebo Wang, Xusheng Zhang, Shicai Liang, Jialong Wang, Yannan Xie, Jiawei Wang and Bendong Chen in Cancer Informatics
Supplemental Material
sj-xlsx-1-cix-10.1177_11769351251400465 – Supplemental material for Integrative Analysis of eQTL Genes Reveals Key Biomarkers and Mechanisms for Early Diagnosis of Pancreatic Ductal Adenocarcinoma
Supplemental material, sj-xlsx-1-cix-10.1177_11769351251400465 for Integrative Analysis of eQTL Genes Reveals Key Biomarkers and Mechanisms for Early Diagnosis of Pancreatic Ductal Adenocarcinoma by Xuebo Wang, Xusheng Zhang, Shicai Liang, Jialong Wang, Yannan Xie, Jiawei Wang and Bendong Chen in Cancer Informatics
Supplemental Material
sj-xlsx-2-cix-10.1177_11769351251400465 – Supplemental material for Integrative Analysis of eQTL Genes Reveals Key Biomarkers and Mechanisms for Early Diagnosis of Pancreatic Ductal Adenocarcinoma
Supplemental material, sj-xlsx-2-cix-10.1177_11769351251400465 for Integrative Analysis of eQTL Genes Reveals Key Biomarkers and Mechanisms for Early Diagnosis of Pancreatic Ductal Adenocarcinoma by Xuebo Wang, Xusheng Zhang, Shicai Liang, Jialong Wang, Yannan Xie, Jiawei Wang and Bendong Chen in Cancer Informatics
Supplemental Material
sj-xlsx-3-cix-10.1177_11769351251400465 – Supplemental material for Integrative Analysis of eQTL Genes Reveals Key Biomarkers and Mechanisms for Early Diagnosis of Pancreatic Ductal Adenocarcinoma
Supplemental material, sj-xlsx-3-cix-10.1177_11769351251400465 for Integrative Analysis of eQTL Genes Reveals Key Biomarkers and Mechanisms for Early Diagnosis of Pancreatic Ductal Adenocarcinoma by Xuebo Wang, Xusheng Zhang, Shicai Liang, Jialong Wang, Yannan Xie, Jiawei Wang and Bendong Chen in Cancer Informatics
Supplemental Material
sj-xlsx-4-cix-10.1177_11769351251400465 – Supplemental material for Integrative Analysis of eQTL Genes Reveals Key Biomarkers and Mechanisms for Early Diagnosis of Pancreatic Ductal Adenocarcinoma
Supplemental material, sj-xlsx-4-cix-10.1177_11769351251400465 for Integrative Analysis of eQTL Genes Reveals Key Biomarkers and Mechanisms for Early Diagnosis of Pancreatic Ductal Adenocarcinoma by Xuebo Wang, Xusheng Zhang, Shicai Liang, Jialong Wang, Yannan Xie, Jiawei Wang and Bendong Chen in Cancer Informatics
Footnotes
Author Contributions
All authors have read and approved the final manuscript. The specific contributions of each author are as follows:
Xuebo Wang※: Conceptualization, Formal analysis, Investigation, Writing – original draft.
Ningxia Medical University, Yinchuan 750004, China, Email:
Xusheng Zhang※: Data curation, Software, Validation, Visualization, Writing – original draft.
Ningxia Medical University, Yinchuan 750004, China, Email:
Shicai Liang: Methodology, Resources, Data curation.
Ningxia Medical University, Yinchuan 750004, China, Email:
Jialong Wang: Investigation, Validation.
Ningxia Medical University, Yinchuan 750004, China, Email:
Yannan Xie: Investigation, Validation.
Ningxia Medical University, Yinchuan 750004, China, Email:
Jiawei Wang: Investigation, Validation.
Ningxia Medical University, Yinchuan 750004, China, Email:
Bendong Chen*: Supervision, Project administration, Funding acquisition, Writing – review & editing.
Department of Hepatobiliary Suegery, General Hospital of Ningxia Medical University, Yinchuan 750004, China, Email:
Funding
The authors received no financial support for the research, authorship, and/or publication of this article.
Declaration of Conflicting Interests
The authors declared no potential conflicts of interest with respect to the research, authorship, and/or publication of this article.
Data Availability Statement
Clinical Trial Number
Not applicable.
Supplemental Material
Supplemental material for this article is available online.
References
Supplementary Material
Please find the following supplemental material available below.
For Open Access articles published under a Creative Commons License, all supplemental material carries the same license as the article it is associated with.
For non-Open Access articles published, all supplemental material carries a non-exclusive license, and permission requests for re-use of supplemental material or any part of supplemental material shall be sent directly to the copyright owner as specified in the copyright notice associated with the article.