
Abstract
The relevance of nongenetic factors to prostate cancer (PCa) has been elusive. We aimed to quantify the contributions of environmental factors to PCa and identify risk-related diet metrics and relevant racial disparities. We performed a unique analysis of the Diet History Questionnaire data of 41 830 European Americans (EAs) and 1282 African Americans (AAs) in the PLCO project. The independent variables in the regression models consisted of age at trial entry, race, family history of prostate cancer (PCa-fh), diabetes history, body mass index (BMI), lifestyle (smoking and coffee consumption), marital status, and a specific nutrient/food factor (X). P < .05 and a 95% confidence interval excluding zero were adopted as the criteria for determining a significant difference (effect). We established a priority ranking among PCa risk-related genetic and environmental factors according to the deviances explained by them in the multivariate Cox-PH regression analysis: age > PCa-fh > diabetes ⩾ race > lifestyle ⩾marital-status ⩾BMI > X. We confirmed previous studies showing that (1) high protein and saturated fat levels in diet were related to increased PCa risk, (2) high-level supplementary selenium intake was harmful rather than beneficial for preventing PCa, and (3) supplementary vitamin B6 was beneficial for preventing benign PCa. We obtained the following novel findings: high-level organ meat intake was an independent predictor for increased aggressive PCa risk; supplementary iron, copper and magnesium increased benign PCa risk; and the AA diet was “healthy” in terms of the relatively lower protein and fat levels and was “unhealthy” in that it more commonly contained organ meat. In conclusion, we established a priority ranking among the contributing factors for PCa and identified several risk-related diet metrics and the racial disparities. Our findings suggested some new approaches to prevent PCa such as restriction of organ meat intake and supplementary microminerals.
Introduction
Aside from non-melanoma skin cancer, prostate cancer (PCa) is the most frequently occurring cancer in American males, but its prevalence in Asian countries is very low. Recent genetic studies demonstrated that PCa susceptibility is a polygenic trait with the genomic heritability ranging from 0.25 to 0.78,1,2 while pathogenic germline variants in some cancer genes such as BRCA1, BRCA2, and HOXB13 can be detected in a small fraction of men with a personal history of the disease. 3 The contribution of nongenetic, that is, environmental, factors to this trait is strongly suggested by the fact that The Asian immigrants in Western countries have higher incidence of prostate cancer compared to those in their countries of birth. 4 Potential environmental risk factors for PCa include diet metrics such as nutrient intake levels, lifestyle patterns such as those characterized by smoking and coffee consumption, health status related to other diseases, and actual marital status.5,6
The implications of diet and lifestyle characteristics for PCa epidemiology and prevention have not been fully determined. In particular, previous studies yielded inconsistent results on the effects of high- or low-level intake of macronutrients, including carbohydrates, protein, fat, calcium and phosphorous, on the PCa risk. For example, a study of 142 251 men in the European Prospective Investigation into Cancer and Nutrition supported the hypothesis that high-level intake of protein or calcium from dairy products may increase the risk for prostate cancer. 7 However, such associations were not presented in another study on an American cohort, which included 11 014 participants. 8 Meat is another main dietary protein source, especially in Western society. A positive association between red meat (pork, beef, and lamb) intake and the prostate cancer risk was suggested by several studies but was not confirmed by others.9-12 Similarly, uncertainty widely exists in the observed relationships between the PCa risk and the intake of other macronutrients and major food ingredients. 6
The liability of dietary and lifestyle data, which are usually derived from questionnaires, is subject to many uncertain factors. In particular, a dietary record collected close to the time of cancer diagnosis or at the end of the follow-up period for a “control” may lack relevance to the actual environment for cancer initiation and progression because there is a period of ~10 years between the genesis of initial tumorous cells and the final formation of a tumor that can be detected by conventional methods. 13 This may be a major reason for the inconsistency among the reported relationships between cancer susceptibility and diet/lifestyle factors across studies. The situation is further complicated by the interweaving of genetic factors and environmental factors and the interactions between environmental factors themselves. For example, diabetes and obesity may be considered environmental factors for prostate cancer. Meanwhile, they may share some common genetic risk factors with cancer.14,15 More importantly, diabetes and obesity statuses also influence a subject’s food and lifestyle choices. In such a context, carefully selected data preprocessing procedures and statistical models are crucial for uncovering relationships hidden within “noisy” data.
In this study, we aimed to quantify the contributions of nongenetic risk factors to prostate cancer, identify risk-associated dietary variables, and assess correlations between dietary variables and blood prostate-specific antigen (PSA) level, which is a commonly used biomarker for detecting PCa. We also investigated racial disparities in those dietary risk metrics, which are important for understanding and alleviating the substantial inequality in PCa prevalence across races. 16 We pursued these goals by analyzing the data collected by the Prostate, Lung, Colorectal, and Ovarian Cancer Screening Trial (PLCO) project. 17 This data has been used in many studies, such as Cross et al., 12 , Shikany et al., 18 Richman et al. 19 but are worthy of further analysis. Our study differs from others in the data refining/preprocessing procedure and statistical models used (see the Methods and Discussion sections). For the associations between diet metrics and PCa risk, our general hypothesis was that both confirmative results, such as the increase of PCa risk due to high-level saturated fat and red meat intake, and novel findings may be achieved via the performed analyses.
Material and Methods
Datasets
The Prostate Person dataset in the file “pros_data_nov18_d070819.csv” and Diet History Questionnaire (DHQ) dataset in the file “dhq_data_nov18_d070819.csv” were downloaded from the PLCO database upon approval from the National Institutes of Health (NIH). The DHQ data was collected by the researchers blinded to the clinical outcomes of the PLCO’s participants. In this study, the 2 datasets were first merged on subjects’ trial IDs. Then, records without complete information for the variables considered in this study were filtered out. The subjects for whom the time from the date of trial entry, i.e., the date when a participant was randomized into the screening or control arm, to the DHQ entry date was longer than 6 years and those with a personal PCa history preceding the date of trial entry were also excluded. After this refinement, the working dataset (WD) included the information of 41 830 Non-Hispanic European American (EA) males and 1282 Non-Hispanic African Americans (AA) males. In Table 1, we summarize the distributions of subjects in the WD regarding the factors studied in our basic statistical model (see the following Statistical methods section).
Summary of samples used in the analysis of the risk for aggressive and benign cancer.

The percentages of aggressive EA or AA PCa cases among all EA or AA samples. c,dThe percentages of benign EA or AA PCa cases among all EA or AA samples.
Diet metrics
Two sets of diet metrics (variables) were tested in the statistical analysis. The first set included 29 metrics for dietary nutrients (dt_x, x is protein or others), 21 supplementary nutrients (sup_y_dhq, y is selenium or others) and the ratio of dt_calcium and dt_phosphorus. The dt_x and sup_y metrics were calculated from the questionnaire responses by DietCalc software, which considered food frequency, serving size, and other responses. The second set included 30 metrics for food ingredients (p_z, z is milk or others). The p_z metrics were calculated in the same manner as the nutrient variables using amounts based on the US Department of Agriculture’s pyramid servings, which are stored in the same gender- and serving size-specific database as the nutrients.
Data preprocessing
We modified diet metrics using a 2-step procedure. First, the metrics were adjusted for age using a simple linear model. Second, the adjusted metrics were normalized with total calorie intake as the scale factor. As such, the normalized dt_x (or supp_y, or p_z) was the intake of x dietary nutrient (or y supplementary nutrient, or z dietary food ingredient) per Kcal total energy. Each subject’s PSA was measured in multiple screenings. For a noncancer subject, we took the average of the PSA levels over the screenings as the representative value (RV). For a case subject, we took the pre-diagnosis PSA level, that is, the measure obtained at the screening immediately preceding the PCa diagnosis, as the RV.
Statistical methods
A series of Cox proportional hazards regression analyses, where the PCa indicator (1 or 0) and disease-free survival time from the date of trial entry to the end of the follow-up were dependent variables, were conducted to assess the associations between explanatory variables, such as dietary (dt_) protein, and the disease, that is, prostate cancer. The analysis procedure proceeded as follows. First, a univariate model was used to scan the Basic Questionnaire (BQ) variables (except for caffeine consumption), which were contained in the “Prostate person” dataset, to detect factors associated with PCa. Second, the effects of the significant BQ factors determined in the last step were reassessed using a multivariate model, which is called the basic model (M1) hereafter. Finally, the association between a diet metric and PCa was tested using another multivariate model (M2) in which all the items in M1, alongside the diet metric itself, were included as covariates. In the M2 analysis, the age-adjusted and normalized diet metrics were discretized into 4 levels for dietary nutrients and common food ingredients or 2 levels for supplementary nutrients and uncommon food ingredients such as organ meat. Four-level discretization was established using the 25%, 50%, and 75% quantiles of the original measures as the cutoffs. Two-level discretization was established using the mean as the cutoff.
The correlations between PSA and diet metrics were calculated using Pearson’s method and were tested using a t test. Preceding this step, individuals’ PSA values were adjusted for the trial entry ages. Two methods were used to compare AAs and EAs in the intake of nutrients and foods. For the metrics of dietary nutrients and common foods, a t test was employed. For a supplementary nutrient or uncommon food ingredient, persons were partitioned into a high-intake group and a low-intake group with the mean intake as the cutoff, and then a chi-square test was performed.
With regard to the multiple testing for the associations between the focused diet metrics and PCa risk, the correlations between diet metrics and PSA levels and the differences of diet metrics between EA males and AA males, the false discover rate (FDR) corresponding to an ordinary p-value was estimated by the Benjamini–Hochberg procedure.
Software application
All analyses and graphics were completed by using the relevant functions in the R packages, including “stats,” “survival” and “ltm,” as well as our lab-owned R codes.
Data availability
The datasets used are deposited in the PLCO database (https://prevention.cancer.gov/major-programs/prostate-lung-colorectal-and-ovarian-cancer-screening-trial). Access to the DHQ dataset is controlled by the NIH data access committee.
Results
Basic model analysis for the PCa risk
The basic model M1 (see the Statistical methods section) included 7 categorical explanatory variables: age level, PCa-fh, race, diabetes history, body mass index (BMI, a measure of body fat based on height and weight) class, lifestyle (smoking and coffee consumption) and marital status. Except for coffee consumption, which was coded on the DHQ entry, the other variables were coded on the information collected at the dates of trial entry. Age level was coded with “1”,”2”, “3”, or “4” if a subject’s age fell within the interval 45 to 59, 60 to 64, 65 to 69 or over 70, respectively. PCa-fh was coded with “+” or “-”, depending on the existence of PCa family history in first-degree relatives. Diabetes history was coded with “+” if a subject had diabetes and otherwise was coded with “-.” BMI class was coded “1”, “2” or “3” if the quantity fell within the interval 0 to 25, 25 to 30 or 30+, respectively. Smoking was coded with “+” if the subject’s cigarette smoking status was “current cigarette smoker” or he had a smoking history over 5 years and the time from the date when he stopped smoking to the date of trial entry was less than 5 years and otherwise coded with “-”. Coffee consumption was coded with “+” if a subject’s consumption of caffeine was ⩾0.1 mg/day and otherwise was coded with “-”. Lifestyle was defined as the combination of smoking and coffee consumption. Marital status was coded with “+” if a subject was married or living as married and otherwise was coded with “-”.
The analysis results of the M1 model are presented in Table 2, which was partitioned into modules
Results from the basic model (M1) analysis for the associations between PCa occurrence and risk factors. a

Age level 1, pros_fh-, race EA, smoke-&coffee-, diabetes‒, BMI 1 and marital status- were considered as the baselines for the seven categorical risk factors. bThe deviance explained by the corresponding factor.
PCa risk-related diet metrics
The associations between the PCa risk and diet metrics were assessed by the model M2 as described in the Materials and Methods section. The analysis was first performed in the context that the discretized intake levels of a nutrient or food ingredient were considered quantitative amounts (Figure 1, Table 3). Nine, six, and five diet metrics were determined to be significantly associated with the PCa risk when the information of all cancer cases, aggressive cancer cases or benign cancer cases was used, respectively. The results confirmed the previously reported positive associations between the PCa risk and the intake levels of saturated fat,20,21 red meat, 9 alcohol,22,23 and supplementary selenium, 24 and the negative association between benign cancer and vitamin B6. 25 The novel findings included the positive association between benign cancer and supplementary iron/magnesium/copper, and the positive association between aggressive cancer and organ meat. In terms of the explained deviances, the priority of any diet metric for PCa risk was behind all other exploratory variables in the analysis model (see Table 2, Figure 1, and Supplemental Figures S1 and S2).

Contributions of diet metrics to prostate cancer risk, estimated using the information of all cancer and noncancer samples. The bar color, that is, gray or pink, indicates the negative or positive association between the corresponding diet metric and cancer risk. *, **, and *** denote significance levels with P-value less than .1, .05, and .01.
Association between the PCa risk and diet metrics. a
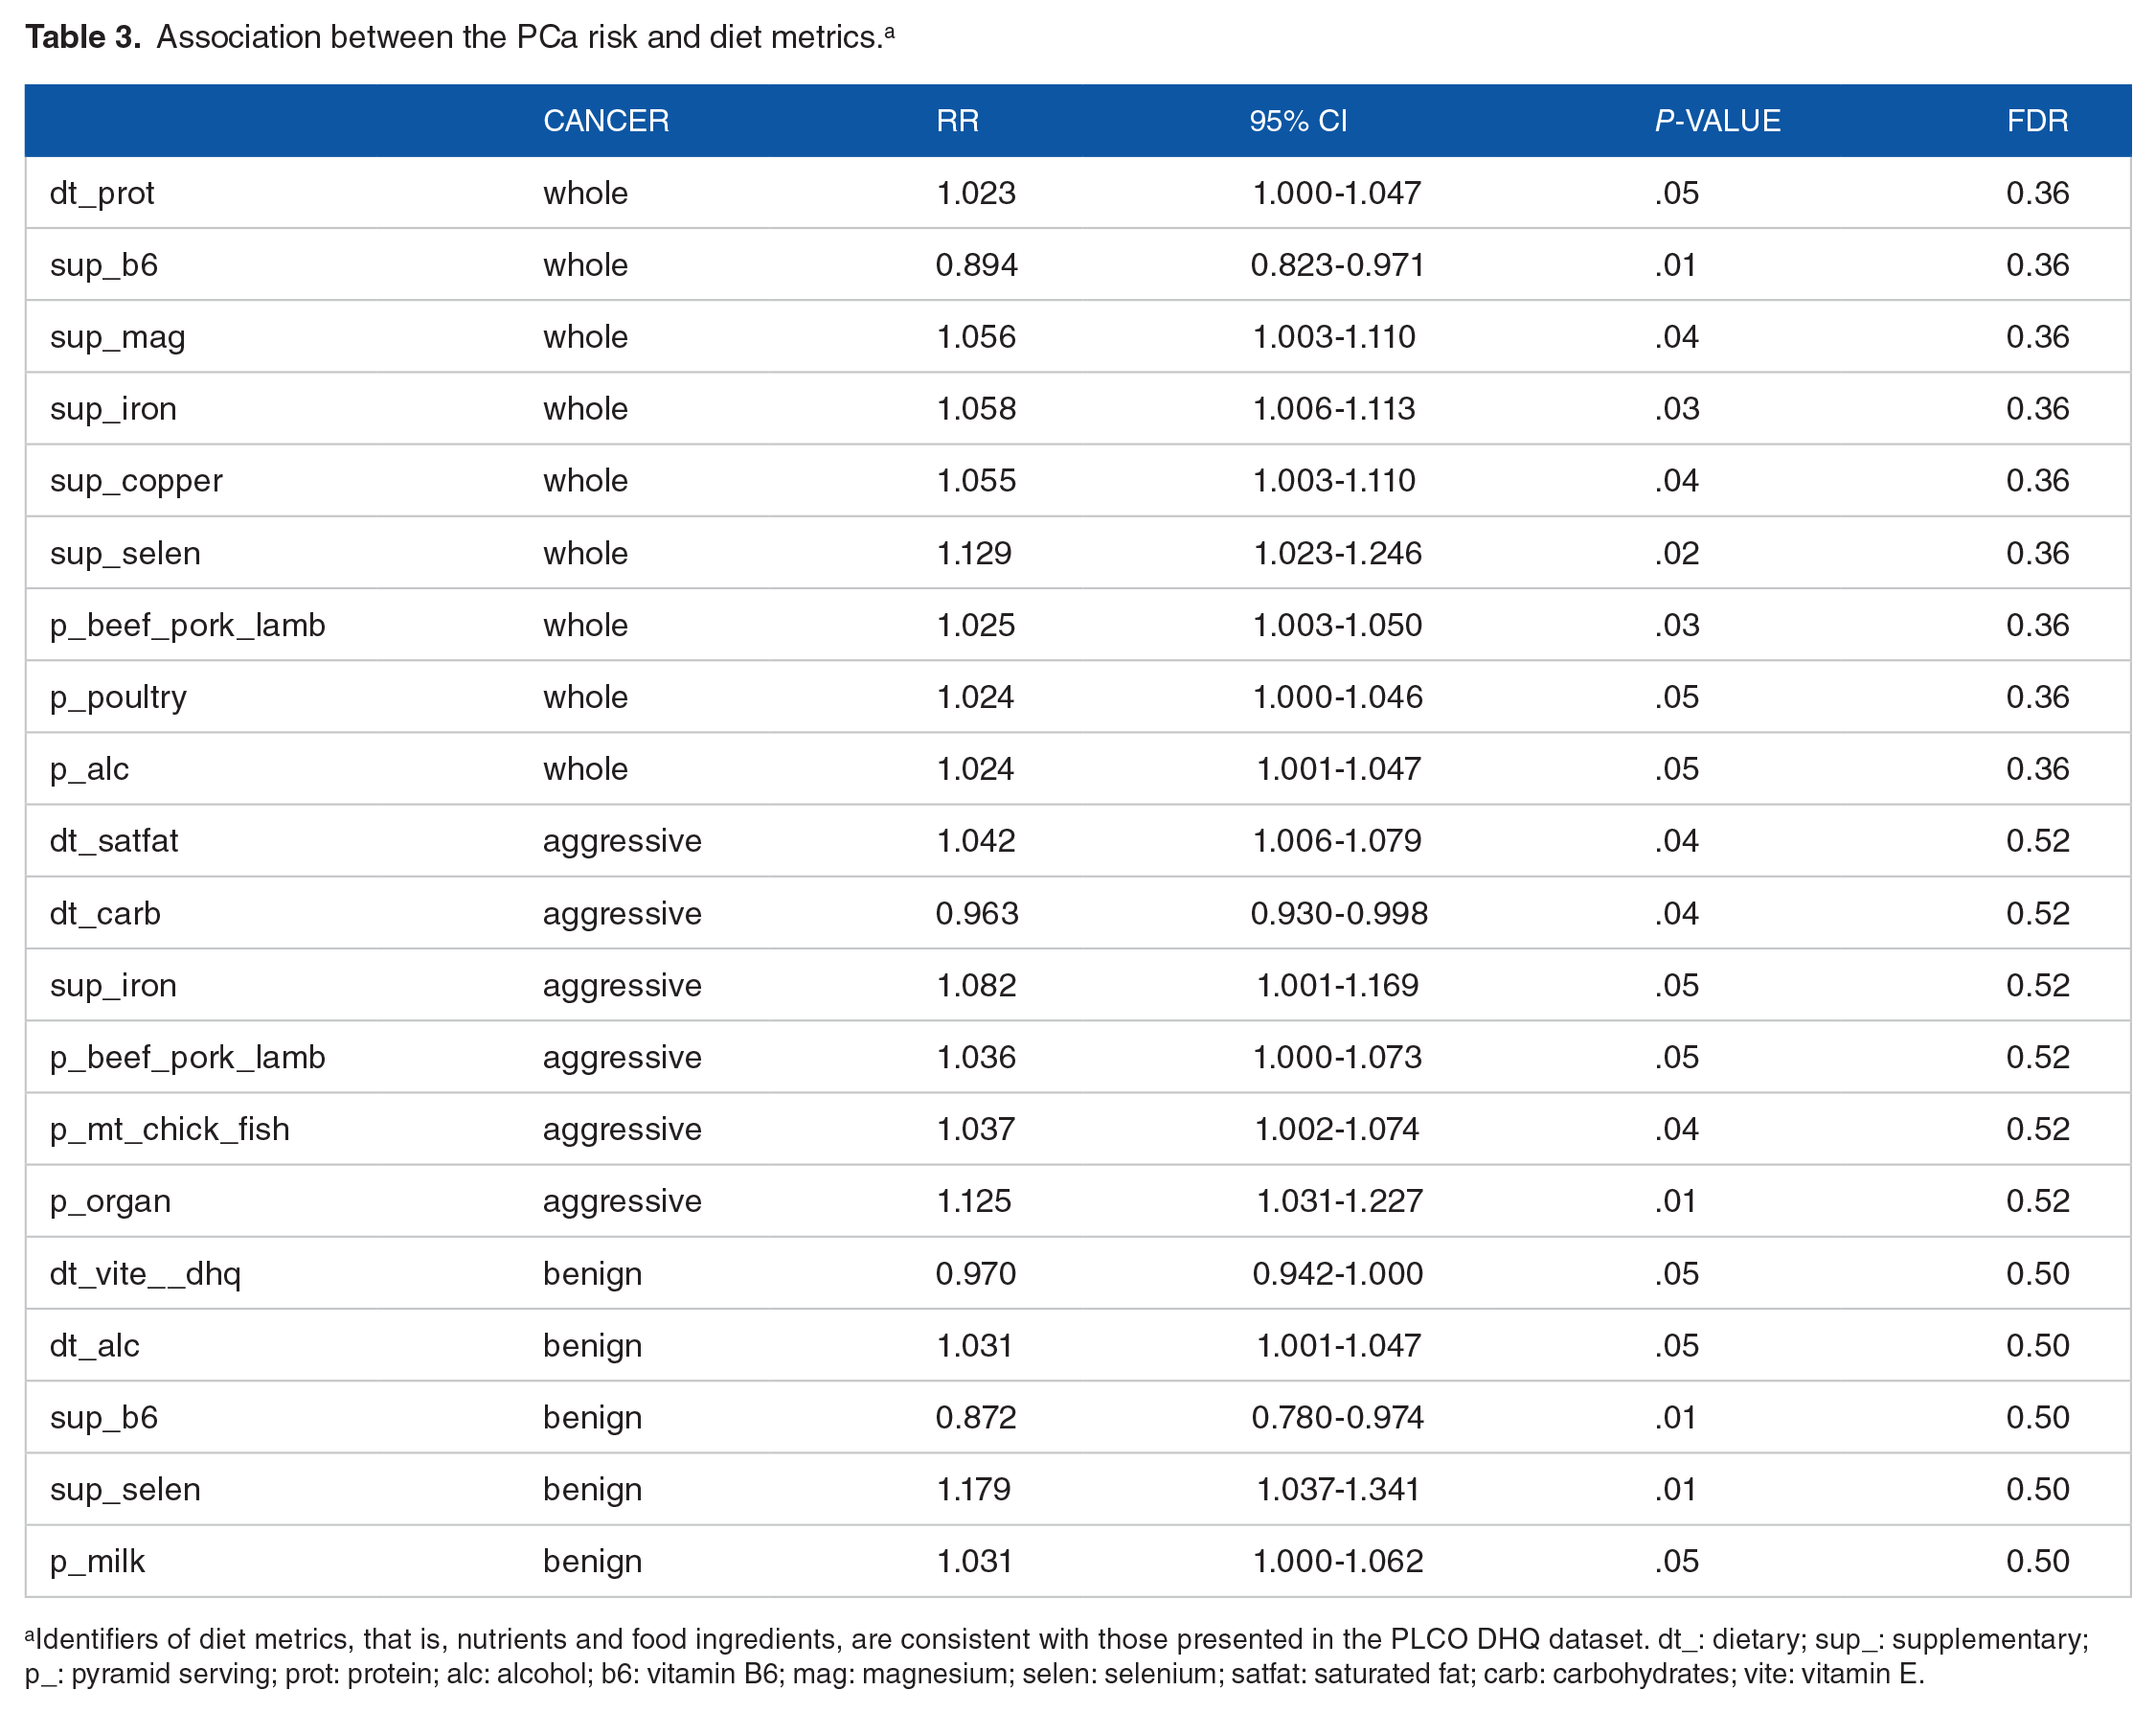
Identifiers of diet metrics, that is, nutrients and food ingredients, are consistent with those presented in the PLCO DHQ dataset. dt_: dietary; sup_: supplementary; p_: pyramid serving; prot: protein; alc: alcohol; b6: vitamin B6; mag: magnesium; selen: selenium; satfat: saturated fat; carb: carbohydrates; vite: vitamin E.
Then, the analysis was repeated for the aforementioned PCa-related dietary nutrients and common food ingredients in the alternative context that the discretized intake levels were considered categorical metrics. The sequentially increased intake levels 1, 2, 3, and 4 were replaced with category identifiers Q1, A2, Q3, and Q4, and Q1 was treated as the baseline in statistical tests. The analysis results are presented in Table 4. From them, we found some meaningful patterns regarding the relationship between a nutrient/ingredient and the PCa risk. For example, in the scenario of aggressive cancer and saturated fat, a single-step pattern of risk increases was apparent, as indicated by the similar RR values and 95% CIs for the contrasts Q2 versus Q1, Q3 versus Q1 and Q4 versus Q1. The estimated RR value of 1.11 to 1.14 denoted an 11% to 14% increase in PCa risk.
Differences in PCa risk between quantile levels in the intake of nutrients and food ingredients. a

The identifier annotations of nutrients and food ingredients are the same as those in Table 3.
It is worth noting that the detected associations between PCa risk and diet metrics were moderate with the FDR values ⩾0.36 (Table 3). This implies that the findings warrant further validation. However, in interpreting a confirmative (to previous studies) observation, there is no strong rationale to use FDR or a multiple testing adjusted P-value. 26
Racial disparities in diet and nutrition
The study of racial disparity in diet and nutrition was focused on PCa-related diet metrics (see Table 3). Two sets of analyses were performed on cancer samples and noncancer samples. As shown in Table 5, for all 15 diet metrics, the differences between the AA and EA noncancer groups were significant (P < .05). The results from the analysis of cancer samples were consistent with those of noncancer samples in terms of the estimated fold changes. However, the differences between the AA cancer group and the EA cancer group in dietary poultry and supplementary vitamin B6 were not significant (P > .05). This may be due to the small sample size (N = 265) of the AA cancer group. Only in dietary carbohydrates and organ meat did AA have higher intake levels than EA, regardless of whether the males were diagnosed with prostate cancer during the follow-up. In other nutrients/ingredients, the intake levels of AA were consistently lower than those of EA. In general, the racial disparity was moderate in the macro nutrients but was substantial in food ingredients and supplementary micronutrients. For example, in the scenario of cancer and protein, the log2-fold change (FC) was −0.114, indicating that AA (average) intake was 92%
Racial disparities in nutrient and food intake. a

The identifier annotations of nutrients and food ingredients are the same as those in Table 3.
Correlations between PSA and diet metrics
The association between each of the 80 diet metrics and PSA level was assessed by correlation analysis, which was first performed in cancer samples and then replicated in noncancer samples. The detected significant correlations, in which 28 metrics were involved, are summarized in Table 6. These correlations were moderate, with absolute r values ranging from .012 to .044. For a specific of diet metric, the correlations in cancer samples and noncancer samples were largely consistent. An exception was dietary saturated fat, for which the correlation was significant (P = .02) and relatively substantial (r = .04) in cancer samples but not in noncancer samples. For dietary protein and red meat, the negative correlations deviated from the conventional implication of their positive association with PCa risk. For dietary dairy and milk, the positive correlations were well fit with their positive association with cancer. The latter pattern was also true for dietary saturated fat and supplementary selenium.
Correlations between diet metrics and PSA level. a

The identifier annotations of nutrients and food ingredients are the same as those in Table 3.
Discussion
We performed a unique analysis of the PLCO Diet History Questionnaire data (along with the Prostate Person dataset). The achieved results are summarized and discussed here.
First, we established a priority ranking, or importance ranking, among PCa risk-related genetic and environmental metrics according to the deviances explained by them in the multivariate Cox-PH regression analysis; that is: age >PCa-fh (family history of prostate cancer) > diabetes ⩾ race > lifestyle (smoking and coffee consumption) ⩾ marital status ⩾BMI > X, in which X represented a specific diet nutrient/ingredient metric. Age at the date of trial entry and PCa-fh were determined to be in the top places of the rank without ambiguity, reflecting the well-known knowledge that PCa is more likely to develop in older men and those with a family history of the disease. 6 In the third to fourth ranks were diabetes history and race. Diabetes is a hereditary disease, and its relevance to PCa has been reported in the literature.27,28 Regarding this relationship, a heuristics hypothesis is that the two diseases may share common genetic risk factors, but supporting evidence for that has been weak. 29 An alternative hypothesis is that diabetes can change the internal environment for the initiation, progression or diagnosis of prostate cancer or influence cancer-related lifestyle sport and diet compositions. 6 Our results supported the latter hypothesis because the association between diabetes and PCa occurrence was negative rather than positive. The priority of race may be underestimated due to the inclusion of PCa-fh in the analysis model. In the last 3 ranks were the lifestyle defined by smoking and coffee consumption, marital status and BMI. The negative effects of cigarette smoking and high-level consumption of coffee on the PCa risk or diagnosis confirmed previous studies on this issue.30,31 The negative association of “married” living status with the PCa risk confirmed the finding in Ref 5 and may share a common mechanism with the connection between the frequency of ejaculation throughout adult life and prostate cancer occurrence, which was reported in Ref. 32 The negative association of a high BMI with PCa was somewhat conflicting with the conventional conception about the relationship between obesity and prostate cancer.33,34
Second, we identified over a dozen diet metrics that were associated with the PCa risk. The confirmative observations included the following: a saturated fat diet was related to an increased risk for aggressive PCa,21,35 and a high-level intake of supplementary selenium may be harmful rather than beneficial for preventing PCa, 24 and supplementary vitamin B6 was beneficial for preventing benign PCa. The novel findings included the following: organ meat intake, as an independent predictor rather than as a contributing component of a PCa-related dietary pattern composed of the intakes of many foods, 36 was positively associated with aggressive PCa risk; and supplementary iron, copper and magnesium increased benign PCa risk. Our results also demonstrated that PCa risk was associated with the intake levels of protein and a few major animal protein ingredients, such as red meat, poultry and milk. We noted that in an early publication that was based on the analysis of the midway data of the PLCO project, 12 Cross and her colleagues reported that very well-performed meat was positively associated with PCa risk, but they did not observe any association between PCa risk and red/white meat intake. The inconsistency between Cross et al ’s result and our result may be attributed to the differences in the data preprocessing procedure and statistical models. For example, age, not clearly specified in Ref, 12 was considered as the underlying time metric in the Cox-PH regression model used in Cross et al ’s work. However, in our model, the time metric was disease-free survival years from the date of trial entry to the end of the follow-up, and the age at the date of trial entry was considered a covariate. The associations observed here between PCa risk and the intakes of several micronutrients (i.e., iron, copper, magnesium and vitamin B6) may hold significant implications for cancer prevention. The reason is that controlling the intake of these supplementary nutrients is much more practical and convenient than modifying genetic factors and other environmental factors. Moreover, the potential of vitamin B6 as a cancer risk reduction agent was also reported in a previous study of gastrointestinal cancer. 37 An issue worthy of further investigation is that, among iron, copper and magnesium, which one was actually responsible for their association with PCa risk. Given that microminerals are usually supplemented by taking multimineral product(s), we could not solve the uncertainty using the PLCO questionnaire data.
Third, regarding the PCa risk-related diet metrics, we pinpointed a few racial disparities. Based on the observed differences, we conceived that the AA diet was “healthy” in terms of the relatively lower protein and fat levels and was “unhealthy” in that it more commonly contained organ meat. However, for deciphering racial disparity in PCa occurrence, the implication of these results should be considered to be limited. This postulation can be further scrutinized in the following manner. Prostate cancer prevalence in the AA population is over 1.5 times the prevalence in EA populations. While recent genetic studies have provided explanations for the disparity from multiple angles,38-41 the etiology of the disparity has been elusive due to the missing heritability problem. Namely, the heritability of PCa susceptibility estimated using AA datasets is much lower than that of the genetic parameter estimated using EA datasets,1,2 indicating that the contribution of nongenetic factors, including dietary variables and others, to the disease in AA males may be more substantial than that in EA males. In this context, we perceive that beyond those identified here, more PCa- and race-related environmental variables and within-population stratification patterns of diet metrics may exist.
Fourth, we found that of the 80 diet metrics assessed in this study, 28 were associated with blood PSA levels. The positive correlation between PSA and a few calcium-related metrics, including the intake of dietary calcium and calcium-enriched food ingredients such as milk and the ratio of dietary calcium and phosphorous, was consistent with the results from the National Health and Nutrition Examination Survey data. 42 The moderate negative (or positive) correlation between PSA and protein (or saturated fat) intake confirmed the results in Ref, 43 which showed that men with a lower percentile rank in protein intake and higher percentile rank in fat intake had elevated PSA levels. The positive correlation between PSA and supplementary selenium conflicted with the result from an interventional study, which reported that combined selenium, vitamin E and soy isoflavonoid supplementation reduced serum PSA levels. 44 To our knowledge, the correlations between PSA and the supplementary microminerals copper and zinc have not been reported in the literature. In particular, we noticed that most of the PSA-related diet metrics did not show any association with PCa or were associated with disease risk in the direction opposite to their correlations with PSA levels, indicating that while PSA is a highly useful marker for PCa progression, its associations with diet metrics could hardly be used to identify risk diet/nutrition patterns for PCa. Alternatively, prior to using PSA markers to screen prostate cancer, adjusting for diet metrics may be helpful to increase prediction accuracy.
Supplemental Material
sj-docx-1-cix-10.1177_11769351231168006 – Supplemental material for Quantifying the Contributions of Environmental Factors to Prostate Cancer and Detecting Risk-Related Diet Metrics and Racial Disparities
Supplemental material, sj-docx-1-cix-10.1177_11769351231168006 for Quantifying the Contributions of Environmental Factors to Prostate Cancer and Detecting Risk-Related Diet Metrics and Racial Disparities by Wensheng Zhang and Kun Zhang in Cancer Informatics
Footnotes
Acknowledgements
The authors thank the editor and two reviewers for their constructive comments. This work was partially supported by funding from the National Institutes of Health (NIH) grants 2U54MD007595 and U19AG055373. The contents are solely the responsibility of the authors and do not represent the official views of the NIH.
Funding:
The author(s) disclosed receipt of the following financial support for the research, authorship, and/or publication of this article: WZ and KZ were supported by NIH grant 2U54MD007595. The funders had no role in the study design, data collection and analysis, decision to publish, or preparation of the manuscript.
Declaration Of Conflicting Interests:
The author(s) declared no potential conflicts of interest with respect to the research, authorship, and/or publication of this article.
Author Contribution
Study conception: WZ, KZ. Method design: WZ, KZ. Experiments performed: WZ. Data analysis: WZ, KZ. Writing: WZ, KZ. All authors read and approved the final manuscript.
Supplemental Material
Supplemental material for this article is available online.
References
Supplementary Material
Please find the following supplemental material available below.
For Open Access articles published under a Creative Commons License, all supplemental material carries the same license as the article it is associated with.
For non-Open Access articles published, all supplemental material carries a non-exclusive license, and permission requests for re-use of supplemental material or any part of supplemental material shall be sent directly to the copyright owner as specified in the copyright notice associated with the article.