
Abstract
Driver genes are directly responsible for oncogenesis and identifying them is essential in order to fully understand the mechanisms of cancer. However, it is difficult to delineate them from the larger pool of genes that are deregulated in cancer (ie, passenger genes). In order to address this problem, we developed an approach called TRIAngulating Gene Expression (TRIAGE through clinico-genomic intersects). Here, we present a refinement of this approach incorporating a new scoring methodology to identify putative driver genes that are deregulated in cancer. TRIAGE triangulates - or integrates -three levels of information: gene expression, gene location, and patient survival. First, TRIAGE identifies regions of deregulated expression (ie, expression footprints) by deriving a newly established measure called the Local Singular Value Decomposition (LSVD) score for each locus. Driver genes are then distinguished from passenger genes using dual survival analyses. Incorporating measurements of gene expression and weighting them according to the LSVD weight of each tumor, these analyses are performed using the genes located in significant expression footprints. Here, we first use simulated data to characterize the newly established LSVD score. We then present the results of our application of this refined version of TRIAGE to gene expression data from five cancer types. This refined version of TRIAGE not only allowed us to identify known prominent driver genes, such as
Introduction
Cancer is characterized by the accumulation of genomic abnormalities that result in activated oncogenes and inactivated tumor suppressor genes. These deregulated genes are known as “driver genes.” Identifying genes that “drive” oncogenesis is central to improving our understanding of the mechanisms of cancer and to developing new anticancer therapies. Driver genes can be used as biomarkers of cancer susceptibility. For instance, inherited mutations in
breast cancer 1/2, early onset.
v-erb-b2 erythroblastic leukemia viral oncogene homolog 2, neuro/glioblastoma derived oncogene homolog avian).
Driver genes may be deregulated through a number of mechanisms, operating at the levels of both DNA and RNA to trigger oncogenesis. The first genomic aberration consistently found to be associated with malignancy in humans was a translocation between
breakpoint cluster region.
c-abl oncogene 1, non-receptor tyrosine kinase.
transmembrane protease, serine 2.
v-ets erythroblastosis virus E 26 oncogene homolog (avian).
ets variant 1.
ets variant 4.
tumor protein p53.
v-Ha-ras Harvey rat sarcoma viral oncogene homolog.
retinoblastoma 1.
We have recently developed a data-mining strategy called TRIAngulating Gene Expression (TRIAGE through clinico-genomic intersects) to guide the identification of potential driver genes, which are typically deregulated in only a subset of tumor samples. TRIAGE triangulates three levels of information: gene expression, gene location and clinical survival. We have used TRIAGE to discover and validate a novel oncogene
RAB11 family interacting protein 1 (class I).
ribosomal protein S6 kinase, 70kDa, polypeptide 1– vacuole membrane protein 1.
The first step in the TRIAGE methodology is to identify “expression footprints” (ie, regions that are either induced or repressed at the RNA level and are therefore referred to as “induced” or “repressed” expression footprints, respectively). These areas, which are identified using a novel measure called a Local Singular Value Decomposition (LSVD) score, may overlap at the level of DNA with other genomic events including copy number alterations, mutations or epigenomic changes and may contain driver genes. TRIAGE then uses dual survival analyses to distinguish driver genes from passenger genes located in the same expression footprint. The first survival analysis identifies the genes that are significantly associated with the time-to-event outcome (eg, time to local or distant recurrence) by fitting a Cox proportional hazards model 9 over all patients in the cohort. The second survival analysis identifies potential driver genes by testing associations with the time-to-event outcome in the samples that are not characterized by these expression footprints.
TRIAGE represents several improvements over classical approaches to the analysis of differential expression. First, unlike single whole cohort survival analysis, the TRIAGE approach allows one to distinguish between driver and passenger genes. Second, it is sensitive enough to detect driver genes that are deregulated in a small subset of patients, whereas classical analyses are only able to detect genes that are commonly deregulated in most patients (as described in a number of detailed reviews10–13). Third, it is able to identify the samples and genes that contribute to the expression footprint. Furthermore, contrary to previous methods, 14 which derive a measure of significance for each sample separately, TRIAGE analyzes the whole tumor cohort simultaneously. Finally, unlike other methods, 15 it does not require samples from normal tissues.
Here, we present the statistical properties of the LSVD score, which we characterized using simulated data. We then present the results of our analysis to identify potential candidate driver genes by applying TRIAGE to five human cancers and we discuss the resulting catalog.
Methods
The TRIAGE approach comprised three main steps, as outlined in Figure 6, and described in detail below:
These three steps are further detailed below.
Using LSVD Score to Identify Induced (Or Repressed) Genomic Expression Footprints
The objective of this step is to identify regions (ie, expression footprints) of co-expressed (ie, co-induced or co-repressed) genes and corresponding subgroups of tumors that share the same expression footprints. The problem can be posed as the analysis of an undirected bipartite graph between the set of tumor samples and the set of genes. An edge between a tumor sample and a gene is established if the gene is overexpressed (or repressed) in that particular sample, ie, if its expression is above (or below) a predefined threshold (denoted by
The link structure is then analyzed using Singular Value Decomposition (SVD) constrained upon the localization of gene nodes in the genome as described below.
In the following procedures, we consider the measurement of gene expression for a set of
The expression footprints are identified by analyzing
Defining the bipartite graph structure by transforming
Deriving chromosome localized matrices
Applying SVD and computing the connectivity or LSVD score Δ
Identifying the regions of interest (ie, expression footprints).
While the first step is slightly different for the analysis of induced and repressed expression footprints (as described below), steps 2, 3, and 4 remain the same.
Defining the Gene–Tumor Bipartite Graph
Induced expression footprints.
For each tumor sample 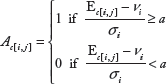
Repressed expression footprints
For each tumor sample 
Deriving Localized Matrices
To account for the localization of expression footprints in the genome, we derive localized connectivity matrices. Local matrices
Performing SVD of Localized Matrices Y
lc
SVD decomposes a matrix 
The largest or principal singular value of
Identifying the Regions of Interest
As shown by Kleinberg,
17
the discriminative ability of the principal singular value increases with the number of repeated multiplications of the matrix to be decomposed. In order to build the final score, SVD is thus applied on matrices 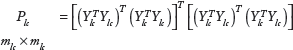

These matrices can be decomposed by SVD as

Then, an LSVD score Δ
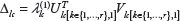
In the above formula, the value of
Higher the LSVD score, the higher confidence in the expression footprint around
Finally, the genomic regions with consecutive LSVD scores above the predetermined threshold represent the expression footprints. The weights
Dual Survival Analysis
Dual survival analysis is used to distinguish between driver and passenger genes.
Let
Unselected survival analysis
First, for each gene
The Cox-PH model is defined by the following hazards function

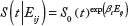
The score statistic and associated
Selected survival analysis
Since passenger genes located in the expression footprints may also be associated with the survival outcome, a so-called
Finally, genes that are significantly associated with survival in both the unselected and selected survival analyses are interpreted as candidate driver genes.
Simulations to Study the Properties of the LSVD Score
Simulation Scheme
We conducted a simulation study to evaluate the statistical properties of the LSVD score (ΔA
We simulated gene expression datasets composed of
As genes involved in the same or related pathway are likely to be co-expressed, we generated datasets with so-called “clumpy” dependence (ie, while gene measurements are dependent upon each other in small groups, measurements in each group are independent from the other groups) using the following procedures.19,20 For each group of 10 genes indexed by
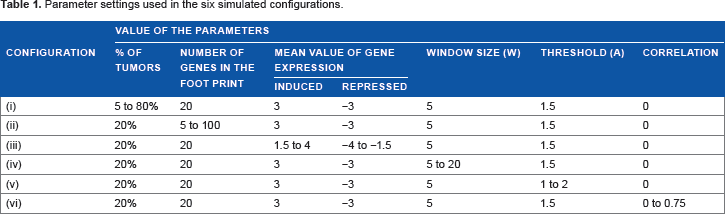
Number of configurations were considered in order to study the influence of (i) percentage of tumors contributing to the expression footprint, (ii) number of genes forming the expression footprint, (iii) mean value of the log-normal distribution μ, (iv) window size ω (v) threshold parameter
Parameter settings used in the six simulated configurations.
Simulation Results
Simulations results for configurations (i), (ii), and (iii) are presented in Figures 1, 2, and 3, respectively. Simulation results for configurations (iv), (v), and (vi) are shown in Figures S1, S2, and S3 in Supplementary File 2, respectively.

Graph (

Graph (

Graph of the score value for 1,000 overexpressed (
Figure 1 presents the variation of the LSVD score for different percentages of tumor samples contributing to the induced expression footprint. The LSVD score Δ
Results for expression footprints of varying sizes (Fig. 2) show that the value of Δ
The influence of the mean expression change is depicted in Figure 3A for induced expression footprints and in Figure 3B for repressed expression footprints. The score increases with the absolute value of the gene effect. The greater the absolute mean value of the log-normal distribution, the higher the score.
Figure S1 in Supplementary File 2 presents the results of simulations similar to configuration (ii) for different window sizes (ω = 5; 10; 20). The LSVD score is lower for smaller window sizes while its variance is larger.
Figure S2 in Additional File 2 shows the results of simulations similar to configuration (ii) for different threshold parameters (
Finally, the influence of the correlation parameter on Δ
Deriving Driver Gene Catalogs in Five Cancers
In this section, we present the results obtained when we used TRIAGE to identify candidate driver genes that are deregulated in subpopulations of tumors. We used five large datasets representing cancers of the breast, ovary, lung, colon, and glioma.
The datasets that we used are summarized in Table 2; sample sizes varied from 111 to 741 patient tumors. Gene expression was measured using Affymetrix HU133A, HU133B, and HU133Plus2.0 arrays (Affymetrix, Santa Clara, CA, USA). We used na32 annotation files obtained from Affymetrix (http://www.affymetrix.com). Raw data were normalized using quantile normalization. 21 We averaged the measurements of transcripts that corresponded to the same gene on a chromosome. Different types of survival outcomes were available in different datasets, defined as follows. Overall survival (OS) was defined as the time from inclusion of the respective patient in the study (eg, surgery) until death or last follow-up. Relapse free survival (RFS) was defined as the time from inclusion until disease-related death, disease recurrence (either local or distant), or last follow-up. Disease metastasis-free survival (DMFS) was defined as the time interval between inclusion to the first distant recurrence event or to last follow-up.
Description of the different cancer studies. The two rightmost columns give the number of putative driver genes identified by TRIAGE.

GSE3494, GSE1456, GSE6532, GSE4922.
For each dataset, Δ
Unselected and selected survival analyses were performed using the genes within the expression footprints. Associations between gene expression and “poor” prognosis were obtained for the genes located within induced expression footprints in order to identify potential oncogenes. Associations between gene expression and “good” prognosis were obtained for those within repressed expression footprints in order to identify potential tumor suppressor genes. A threshold of
Supplementary Files 4 and 5 provide lists of putative oncogenes and tumor suppressors selected by TRIAGE for different cancers studied. A pathway analysis on the selected genes (1638 oncogenes and 1196 tumor suppressors) performed using Ingenuity Pathway Analysis (Ingenuity Systems, www.ingenuity.com); see Supplementary File 6) shows significant enrichment in cancer annotated genes, most specifically in carcinoma, in solid tumor, and in several other types of tumors and cancers. A total of 786 genes were classified under this category. Other pathways commonly observed in cancers including apoptosis, cell death, cell growth and proliferation, and tumor morphology were also significantly enriched.
From the lists of potential oncogenes and tumor suppressors, we intersected those common to the different cancer types (see Fig. 4 for summary statistics). The number of genes commonly expressed in different cancer types was relatively small compared to the total number of genes identified for each individual cancer, indicating that driver genes are specific to a given cancer type. The most commonly expressed genes are listed in Table 3; the top four genes from this list are present in at least three different cancers. Among them,
matrix metallopeptidase 1 (interstitial collagenase).
interleukin 8.
collagen, type I, alpha 2.

Number of genes in common among different cancer types.
Genes common to the five cancer studies.
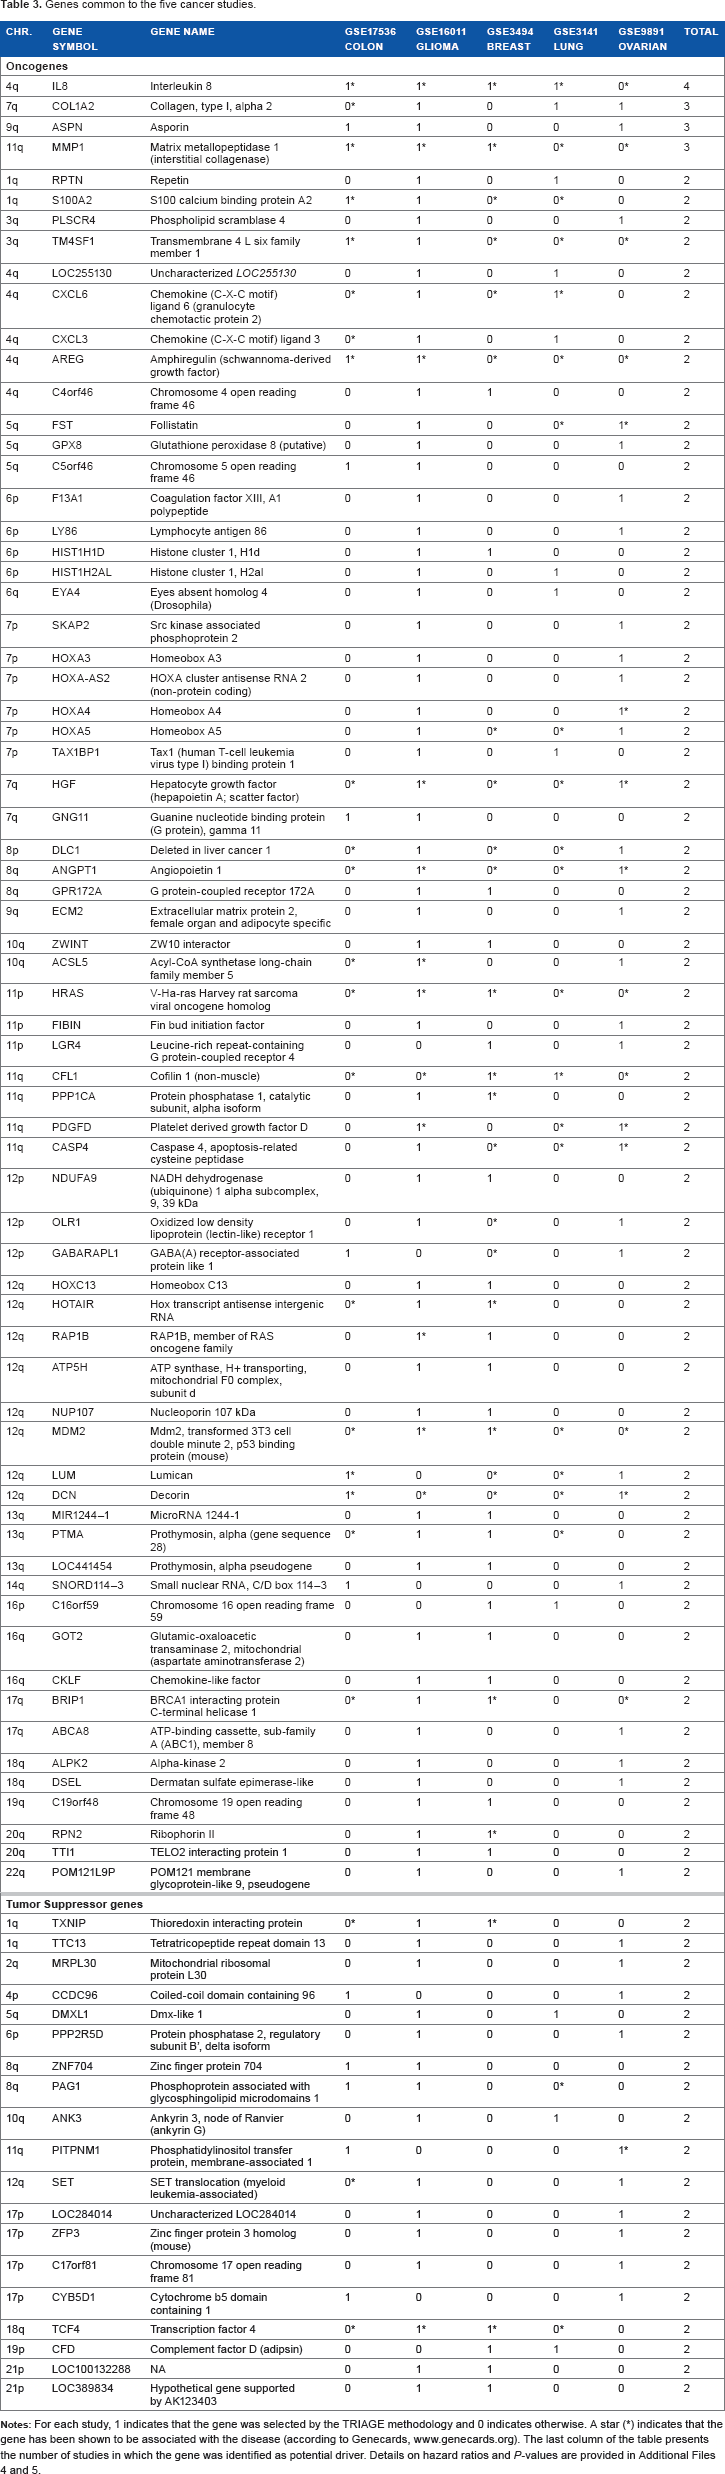
Figure 5 displays the centered and normalized LSVD score for the different windows containing

Heatmap representation of the LSVD score for the windows centered on (
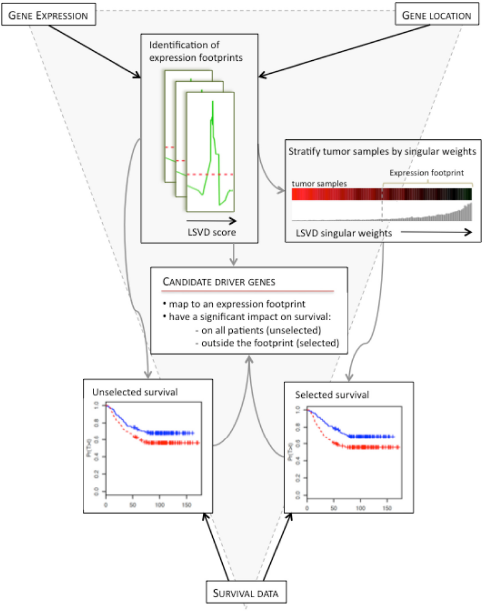
Overview of the TRIAGE methodology.
Discussion
In this paper, we presented refinements of the TRIAGE method, an approach that we developed to identify potential driver genes. We first characterized the LSVD score using simulation. We next identified known and novel driver genes in cancer using gene expression data, genomic information, and survival data. TRIAGE uses two main steps. First, Δ
In the second step, dual survival analyses are used to distinguish driver genes from passenger genes. First, unselected survival analysis is used to identify the genes that are significantly associated with time-to-event outcomes. A selected survival analysis is conducted next by excluding the tumor Samples that contribute to the expression footprint in order to distinguish driver genes from passenger genes. Driver genes are presumed to have an impact on survival even in the absence of the corresponding expression footprint, whereas passenger genes are selected only because they are co-located with a driver gene and thus belong to the expression footprint. Potential driver genes are those that are significantly associated with survival in both the unselected and selected survival analyses.
Our simulation results illustrated that the value of DL
Using real datasets derived from five different cancer types, we illustrated that TRIAGE was able to identify potential driver genes that were enriched for biological processes known to be involved in cancer progression. Among the selected genes, known oncogenes such as
Our results illustrate that TRIAGE offers several advantages over traditional methods of expression analysis, which select genes that are commonly over- or underexpressed. In contrast, TRIAGE relies on patient heterogeneity to highlight different subtypes of gene expression. TRIAGE is thus a useful tool for identifying the genes that distinguish between subgroups of patients having the same disease but differing in their genomic profiles, including differences in active driver genes. These subpopulations could thus potentially benefit from different treatments. Such patient-specific approaches are central to the increasingly influential field of personalized medicine.
TRIAGE is not without some limitations. Here, we focused on the analysis of gene expression. However, the mechanisms that underlie cancer are tremendously complex, involving a host of other genomic aberrations including copy number variations, mutations, and fusions. We anticipate that future refinements to the TRIAGE approach will allow us to account for these influences. TRIAGE is limited to the identification of driver genes harbored in regions associated with deregulated gene expression. However, many genes become deregulated in isolation through many mechanisms. For example,
Author Contributions
Conceived and designed the experiments: RKMK, LDM. Analyzed the data: SR, RKMK. Wrote the first draft of the manuscript: SR. Contributed to the writing of the manuscript: RKMK, LDM. Agree with manuscript results and conclusions: SR, LDM, RKMK. Jointly developed the structure and arguments for the paper: LDM, RKMK. Made critical revisions and approved final version: LDM, RKMK. All authors reviewed and approved of the final manuscript.
Footnotes
Acknowledgments
We thank Genome Institute of Singapore and The Jackson Laboratory for supporting this work. We also thank Joshy George for valuable comments and Tara Mclaughlin for helping editing the manuscript.