
Abstract
Different tumor types are characterized by unique histopathological patterns including distinctive nuclear architectures. I hypothesized that the difference in nuclear appearance is reflected in different nuclear maps of chromosome territories, the discrete regions occupied by individual chromosomes in the interphase nucleus. To test this hypothesis, I used interchromosomal translocations (ITLs) as an analytical tool to map chromosome territories in 11 different tumor types from the TCGA PanCancer database encompassing 6003 tumors with 5295 ITLs. For each chromosome I determined the number and percentage of all ITLs for any given tumor type. Chromosomes were ranked according to the frequency and percentage of ITLs per chromosome. The ranking showed similar patterns for all tumor types. Chromosomes 1, 8, 11, 17, and 19 were ranked in the top quarter, accounting for 35.2% of 5295 ITLs, whereas chromosomes 13, 15, 18, 21, and X were in the bottom quarter, accounting for only 10.5% ITLs. The correlation between the chromosome ranking in the total group of 6003 tumors and the ranking in individual tumor types was significant, ranging from P < .0001 to .0033. Thus, contrary to my hypothesis, different tumor types share a common nuclear map of chromosome territories. Based on the large number of ITLs in 11 different types of malignancy one can discern a shared pattern of chromosome territories in cancer and propose a probabilistic model of chromosomes 1, 8, 11, 17, 19 in the center of the nucleus and chromosomes 13, 15, 18, 21, X at the periphery.
Introduction
A hallmark of cancer is genomic instability of the cancer cell in which alterations in gene sequence and chromosome structure arise that range in size from single nucleotides to whole chromosomes. 1 Depending on the size, genetic abnormalities in cancer can be divided into 3 main types: point mutations, copy number aberrations, and chromosomal rearrangements, the latter with the subtype of translocation or gene fusion. In turn, translocations are subdivided into intra-and interchromosomal translocations. Recently, generic patterns of mutations, termed “mutational signatures” have been defined. 2 These mutational signatures provide insights into the causes of individual cancers, revealing both endogenous and exogenous factors that may influence cancer development. Signatures for point mutations have been characterized in great detail. However, the analysis of other classes of mutation has been relatively limited and the definition of chromosomal rearrangement signatures is still evolving. 3 In particular, the understanding of chromosomal translocations remains a challenge. In this study, I focused on interchromosomal translocations (ITLs).
Different tumor types are characterized by unique histopathological patterns including distinctive nuclear architectures. I hypothesized that the difference in nuclear appearance is reflected in different nuclear maps of chromosome territories, the discrete regions occupied by individual chromosomes in the interphase nucleus. To test this hypothesis, I used ITLs as an analytical tool to map chromosome territories as previously described for breast cancer. 4 ITLs are fusions between genes located on different chromosomes. This property permitted me to determine the number of contacts between chromosomes, made possible only because they are neighbors. In the earlier study, we utilized genomic data on ITLs in 1546 primary breast cancers and observed that the number of contacts was highest for chromosomes 1, 8, 11, and 17 compared to 18, 21, 22, and X, which had infrequent contacts with other chromosomes. 4 Moreover, the 4 chromosomes 1, 8, 11, and 17 accounted for 32.6% (346/1062) fusion events compared to only 7.2% (76/1062) for 18, 21, 22, and X. This striking difference in the number of contacts suggests that chromosomes 1, 8, 11, and 17 are clustered in close proximity to each other, in contrast to 18, 21, 22, and X, which are further apart. The deduced distance between chromosomes enabled me to create a tentative nuclear map of chromosome territories with chromosomes 1, 8, 11, and 17 located in the center and chromosomes 18, 21, 22, and X positioned in the periphery.
This clinical study on breast cancer is in contrast to experimental studies, which examine the spatial arrangement of chromosome territories by elaborate 3-dimensional fluorescence in situ hybridization (3D FISH) protocols, CRISPR live cell imaging, and chromosome conformation capture (3C) techniques, for example, Hi-C.5-7 Since these methods are technically complex, they have been largely limited to small sample sizes, for example, cell lines. Chromosome territories have mostly been studied in monolayer cultures of tumor cell lines, fibroblasts, or lymphocytes. 8 Although this experimental approach offers several technical advantages, even “normal” cells in monolayer cultures have a nuclear architecture different from that of the same cells in tissues. 9 This complicates comparisons between normal and malignant cell nuclei, and might obscure important points of difference in spatial organization.
In this study, I took an entirely different approach and examined 11 different tumor types from the TCGA PanCancer database10-12 encompassing 6003 tumors with 5295 ITLs. For each chromosome I determined the percentage of all fusion events for any given tumor type. Chromosomes were ranked according to the frequency of ITLs per chromosome. The ranking showed similar patterns for all tumor types. Chromosomes 1, 8, 11, 17, and 19 were ranked in the top quarter, accounting for 35.2% of 5295 ITLs, whereas chromosomes 13, 15, 18, 21, and X were in the bottom quarter, accounting for only 10.5% ITLs. The correlation between the chromosome ranking of the total group of 6003 tumors and the ranking of individual tumor types was significant, ranging from P < .0001to .0033. Thus, contrary to my hypothesis, different tumor types share a common nuclear map of chromosome territories.
Methods
Datasets
I used the exome-wide TCGA PanCancer Atlas datasets hosted by the cBioPortal for Cancer Genomics.10-12 The Atlas summarizes clinical and genomic data of 32 different types of malignancies encompassing 10 858 patients. For each patient I obtained the following data: study ID, patient ID, sample ID, traditional parameters (tumor type, sample type, ie, primary or metastatic), and genetic parameters (structural variants or chromosomal rearrangements, the latter with the subtype of translocation or gene fusion). An independent dataset of prostate adenocarcinoma (PRAD) was analyzed for comparison with the TCGA PRAD data. 13
Analysis
Within each tumor type I determined the number of tumors with structural variants and in each of those tumors the number of total translocations and ITLs. To assure representative sampling of ITLs, I limited the subsequent analysis to tumor types with >200 ITLs. There were 11 tumor types containing a total of 5295 ITLs that exceeded this cutoff (Table 1). In every tumor, I determined the number of ITLs for each chromosome. The Y chromosome was excluded from the analysis because it was involved in only 5 fusions compared to 88 for chromosome X and 106 to 457 for the autosomes.
Tumor types in PanCancer Atlas with >200 interchromosomal translocations.

Chromosomes were ranked according to the frequency of ITLs per chromosome. The Spearman correlation method was used to compute the correlation between the chromosome ranking of individual tumor types (GraphPad Software; San Diego, CA). I compiled a list of genes involved in ITLs and identified those participating in more than one ITL. For each chromosome I compared ITLs with the gene density (genes/Mb per chromosome) and used simple linear regression to analyze the correlation.
Circos plots of gene densities and ITLs in chromosomes were created with Circa (http://omgenomics.com/circa).
Results
PanCancer analysis
I analyzed structural variants in all 32 tumor types of the TCGA PanCancer Atlas. Only primary tumors were considered. The percentage of structural variants and the total number of intra-and interchromosomal translocations were determined for each tumor type. The final analysis was limited to 11 tumor types with >200 ITLs, ranging from 372 to 1084 tumors (Table 1). The number of total translocations observed in the 11 selected tumor types ranged from 786 to 5324. The corresponding number of ITLs ranged from 211 to 1618 with a percentage ranging from 23 to 37. Altogether, the analysis is based on 6003 tumors harboring 17 400 total translocations, of which 12 105 are intrachromosomal and 5295 interchromosomal, corresponding to 70 and 30%, respectively.
Analysis of individual tumor types
For each tumor type I performed a detailed analysis of the ITLs as a matrix table, with chromosomes listed in sequential order from 1 to 22 followed by chromo X as rows and columns. I selected PRAD as example of a matrix table (Table 2) and used a heatmap to visualize the magnitude of ITLs in PRAD (Figure 1). The observed frequency of interchromosomal contacts between all pairs of chromosomes was displayed by a color scale ranging from none (green) to a maximum of 15 (red).
Matrix of interchromosomal fusion events in prostate adenocarcinoma.

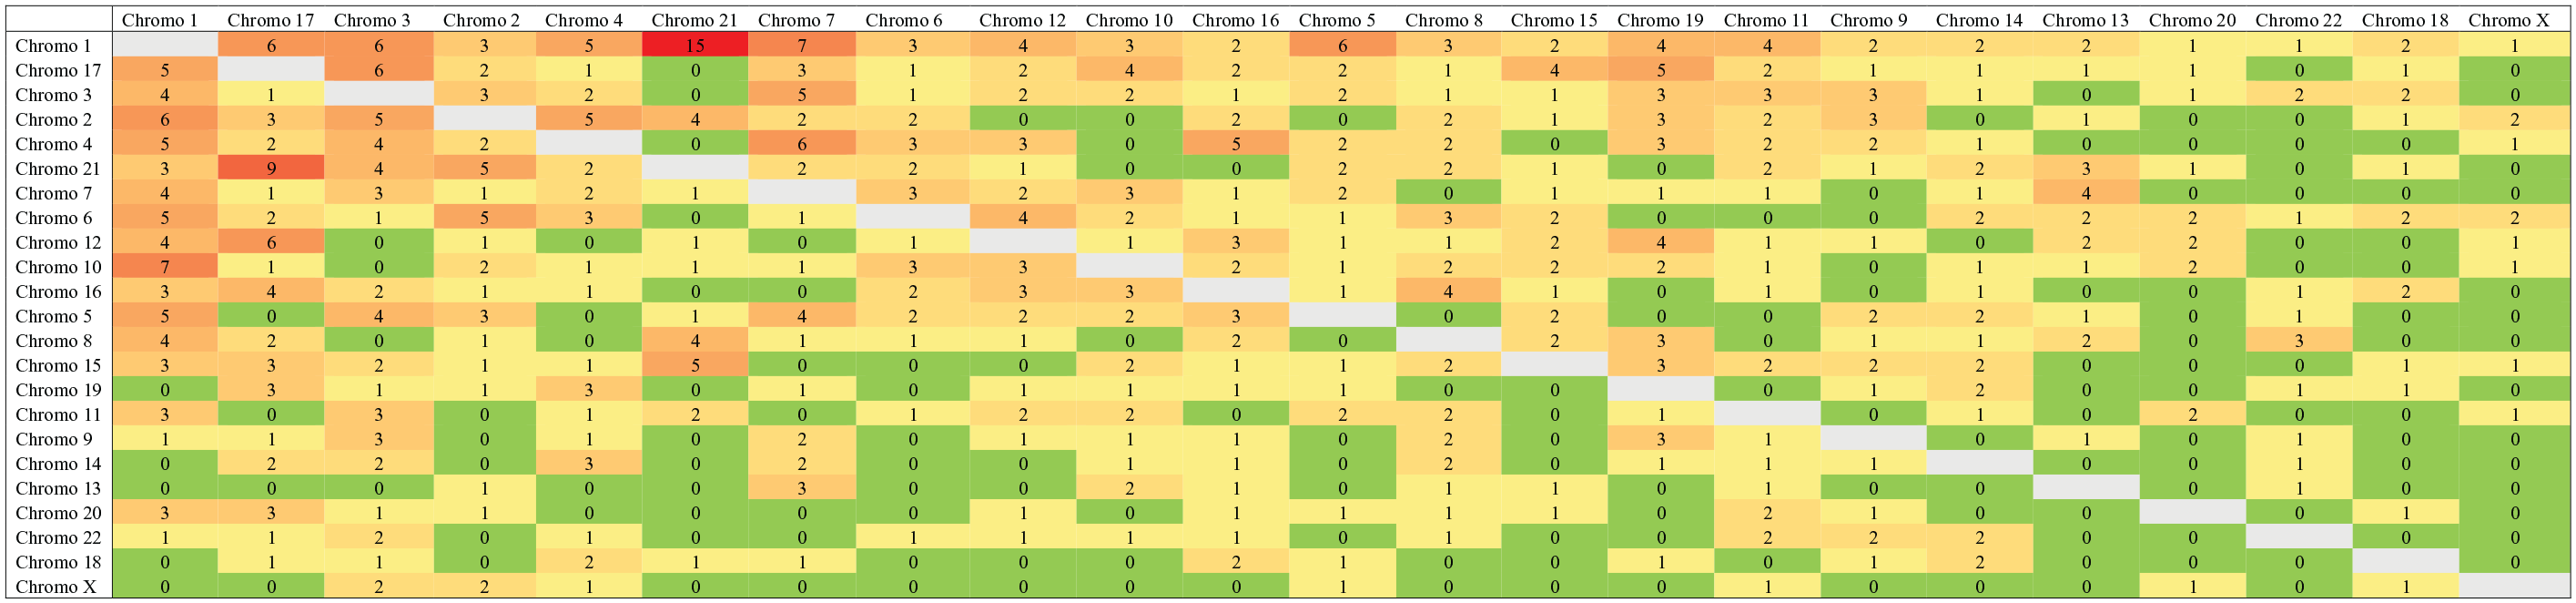
Heatmap of interchromosomal fusion events in prostate adenocarcinoma. The heatmap shows the observed number of interchromosomal contacts between all pairs of chromosomes. The observed frequency of contacts is displayed by a color scale ranging from none (green) to a maximum of 15 (red).
For each tumor type I obtained the fusion events per chromosome (Supplemental Table 1). For each chromosome I determined the number and percentage of all fusion events for any given tumor type. Chromosomes were then ranked according to the frequency of ITLs per chromosome followed by ranking of chromosomes according to the frequency and percentage of ITLs for the 11 tumor types (Figure 2). The ranking showed similar patterns for all tumor types. For example, chromosomes 1, 8, 11, 17, and 19 were ranked in the top quarter, whereas chromosomes 13, 15, 18, 21, and X were generally in the bottom quarter. I calculated the frequency of ITLs per chromosome for the total number of 5295 and used the obtained ranking as a reference. The correlation between the chromosome ranking in “All Tumors” and the ranking in individual tumor types was significant, ranging from P < .0001 to .0033 (Figure 2).
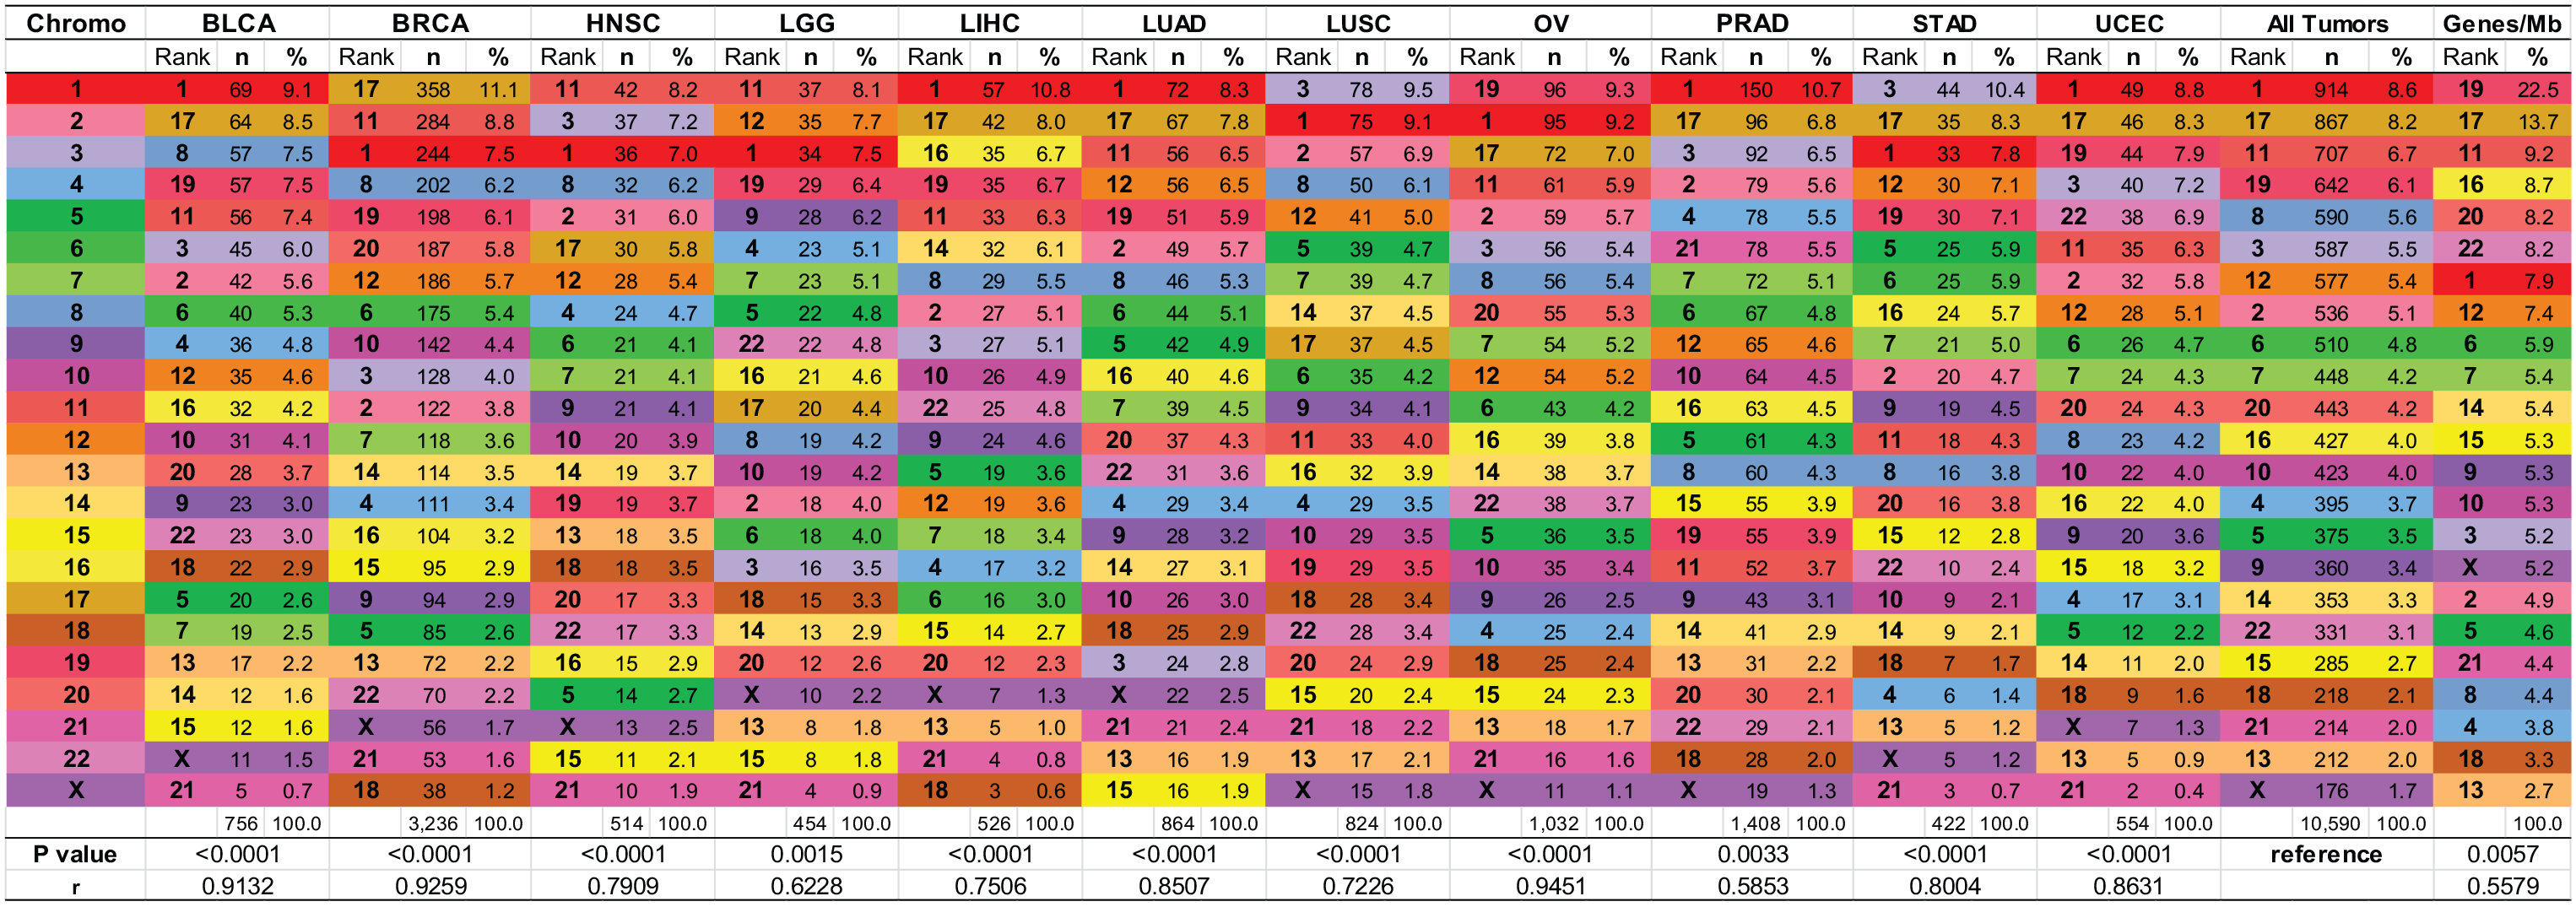
Ranking of chromosomes per ITLs in 11 different tumor types, “All Tumors,” and by gene density. For each tumor type the color-coded chromosomes are ranked from top to bottom by number (n) and percentage (%) of ITLs. The number and percentage of ITLs were also determined for “All Tumors” and the obtained ranking used as reference to compute the correlation with the chromosome ranking of individual tumor types. The correlation ranged from P value <.0001 to .0033 with correlation coefficient r .9259 to 5853. The ranking of gene density is shown as a separate analysis in the extreme right column. The ranking of gene density (genes/Mb) per chromosome is significantly correlated with the ranking of ITLs per chromosome (P = .0057; r .5579).
The large database of 5295 ITLs in 11 tumor types allowed an unbiased assessment of recurrent ITL genes. I compiled a list of genes involved in ⩾10 ITLs (Table 3). The majority of the 34 genes identified above this cutoff participated in more than one tumor type. Half of the 34 recurrent genes are located on 3 chromosomes, namely the central chromosomes 8 (n = 3), 11 (n = 5), and 17 (n = 9).
Genes most frequently involved in ITLs.

Validation study
To validate the results obtained for the TCGA PanCancer Atlas, I searched for an independent database of tumors with an analysis of structural variants. I identified a PRAD study with 969 ITLs, 13 which was compared to 704 in the TCGA PRAD study (Supplemental Table 2). The correlation between the chromosome ranking of the independent and the TCGA study was P < .0001 (Supplemental Figure 1).
Correlation of gene density with ITLs
A correlation between the nuclear position of chromosomes and their gene density has been observed, with gene-rich chromosomes located in the center and gene-poor chromosomes positioned toward the nuclear periphery. 14 I analyzed the correlation of gene density with ITLs and found that the ranking of gene density per chromosome was significantly correlated with the ranking of ITLs per chromosome (P = .0057; r = .5579) (Figure 2). In addition to this general analysis, I visually assessed the correlation between gene density and ITLs for each chromosome. Representative Circos plots of chromosomes 1, 8, 11, 17, and 19, which are top ranked in the “All Tumors” group, illustrate the correlation between gene density and ITL (Figure 3). For comparison, I show the Circos plots of chromosomes 13, 15, 18, 21, and X that are ranked at the bottom (Figure 4). There is a striking difference between the gene densities and ITLs of central and peripheral chromosomes. Linear regression between gene density and ITLs was P < .0001 for all chromosomes.

Circos plots showing gene density and ITLs in chromosomes 1, 8, 11, 17, and 19, the top chromosomes in the entire group of 6006 tumors. The red tracks display the gene density (gene/Mb) for each chromosome, with each line representing one gene. The blue tracks display the ITLs for each chromosome, with each line representing one translocation site. The comparison of red and blue tracks shows similar profiles for gene density and ITLs (P < .0001).

Circos plots showing gene density and ITLs in chromosomes 13, 15, 18, 21, and X, the bottom chromosomes in the entire group of 6006 tumors. The red tracks display the gene density (gene/Mb) for each chromosome, with each line representing one gene. The blue tracks display the ITLs for each chromosome, with each line representing one translocation site. The comparison of red and blue tracks shows similar profiles for gene density and ITLs (P < .0001).
Discussion
Alterations in nuclear structure is a morphological hallmark of cancer diagnosis. Criteria for malignancy include variation in the following: nuclear size, nuclear shape, nuclear texture, and nuclear density. Since different tumor types are characterized by unique histopathological patterns including distinctive nuclear architectures, I hypothesized that the difference in nuclear appearance would be reflected in different nuclear maps of chromosome territories. To test this hypothesis, I used ITLs as a means to map chromosome territories as described previously for breast cancer. 4 To evaluate nuclear architectures across the spectrum of malignant tumors, I examined 11 different tumor types from the TCGA PanCancer database encompassing 6003 tumors with 5295 ITLs (Table 1). In this endeavor, ITLs served as investigative tool and simultaneously were target of the analysis.
For each chromosome I determined the percentage of all fusion events for any given tumor type. Chromosomes were ranked according to the frequency of ITLs per chromosome. Chromosomes 1, 8, 11, 17, and 19 ranked in the top quarter. In the entire group of tumors, they accounted for 35.2% of 5295 ITLs, whereas chromosomes 13, 15, 18, 21, and X were in the bottom quarter, accounting for only 10.5% ITLs (Figure 2). The observation that the top 5 chromosomes accounted for 35.2% fusion events suggests that they are clustered in close proximity to each other in the nuclear center, while the bottom 5 chromosomes accounted for only 10.5%, suggesting a wider distance between each other and a more peripheral location. The ranking showed similar patterns for all tumor types. The correlation between the chromosome ranking in the total group of 6003 tumors and the ranking in individual tumor types was significant, ranging from P < .0001 to .0033. Thus, contrary to my hypothesis, different tumor types share a common nuclear map of chromosome territories.
Observing recurrent mutations at the same genomic site provides strong evidence for positive selection during tumor growth and suggests a mechanistic contribution at some stage of tumor development. 15 The majority of studies examining recurrent somatic mutations has focused on point mutations rather than chromosomal rearrangements in form of translocation or gene fusion. 16 Among 5295 ITLs I identified 34 genes that were involved in ⩾10 ITLs (Table 3). Although the gene selection is skewed toward BRCA because this tumor type contributed the largest number of ITLs, it is apparent that the majority of the 34 recurrent genes participated in more than one tumor type, confirming the importance of translocations in the spectrum of genetic abnormalities. It is noteworthy that recurrent genes located on chromosomes 8 (n = 3), 11 (n = 5), and 17 (n = 9) accounted for half of the 34 genes, underlining the preferential involvement of these centrally located chromosomes.
The results do not mean that there is a single nuclear map of chromosome territories. Far from it, there are numerous maps, probably hundreds of discrete, individual maps in as many tumors. However, despite the individuality, the maps share certain features. The chromosome arms are generally kept apart from each other and the homologous chromosomes occupy distinct positions and have different immediate neighbors. 14 The present study indicates that chromosomes 1, 8, 11, 17, and 19, are centrally located, whereas chromosomes 13, 15, 18, 21, and X are positioned near the nuclear periphery. It is likely that a group of chromosomes with frequent contacts, for example, 1, 8, 11, 17, and 19 is clustered in the nucleus, though not necessarily in the center. I reason that it is easier to pack objects closer together as a cluster in the center of a 3-dimensional space than near its boundary, but cannot rule out a peripheral position. 4 For example, I cannot precisely predict where chromosomes 17 and 18 are located in the nucleus. Both chromosomes contain approximately the same number of base pairs and are of equal length, but chromosome 17 has 4 times more ITLs than chromosome 18 (Figure 2). The higher number of contacts with neighboring chromosomes suggests that chromosome 17 is more centrally located than chromosome 18. Thus, the proposed map does not present a definitive view of the nuclear interior but a probabilistic model inferred from the frequency and distribution of ITLs.
To date, the spatial arrangement of chromosome territories has been examined by elaborate techniques, for example, 3D FISH and Hi-C.5-7 These methods are technically complex and therefore have been largely limited to small sample sizes, for example, cell lines. 8 Another inherent disadvantage of this experimental approach is the fact that cells in monolayer cultures have a nuclear architecture different from that of the same cells in tissues. 9 This complicates comparisons between normal and malignant cell nuclei, and might obscure important points of difference in spatial organization. A strength of this study is the large number of tumors examined in the TCGA PanCancer Atlas, which comprises data from 32 different tumor types, all with ITLs. To assure representative sampling of ITLs for the statistical analysis, I limited the examination to tumor types with >200 ITLs. Thus, the PanCancer Atlas analysis is restricted to 11 different tumor types, still with a large number of tumors, namely 6003, and a large number of translocations, 17 400, with 5295 ITLs (Table 1), which reflects the common occurrence of structural variants in all types of malignancies. The large number of tumors in each tumor category and the large number of ITLs enable statistical analyses with rather large P-values.
This study has limitations. First, I did not address the chromosome territory architecture of normal cells. Therefore, I cannot answer the important question if specific topographic changes in the nucleus are associated with malignancy. Second, while the study made use of ITLs as a tool to map chromosome territories in cancer, it does not add to our understanding of translocations in malignancies. Translocations can arise through several mechanisms, including complicated ones, such as chromoplexy and chromothripsis. 17 I am unable to discuss mechanisms because the TCGA PanCancer database does not provide any mechanistic insights. But regardless of the underlying mechanism leading to the translocation, ITLs are final products allowing valid conclusions about the topography of chromosome territories.
At the present time it is poorly understood on what basis chromosome territories assume their position in the nuclear interior and which mechanisms maintain this position. Chromosomes consist of DNA and chromatin, which my analysis does not consider. Nuclear DNA does not exist in free linear strands, but is highly condensed and wrapped around histones, which package the DNA into a highly compact volume that can fit in the nucleus.6,18 The length of chromosomes does not correlate with either the number of genes per chromosomes or the gene density, gene/Mb, on a chromosome. Similarly, there is no correlation between the length of chromosomes and their nuclear location. However, there is a strong correlation between the position of chromosomes and their gene density, with gene-rich chromosomes located in the center and gene-poor chromosomes positioned toward the nuclear periphery. 19 The same principle drives the organization of chromosome territories of individual chromosomes, that is, gene-rich and gene-poor sections are physically separated from each other.20,21 (G + C)-rich gene clusters generally displaying open chromatin structure localize preferentially in the center, whereas (A + T)-rich constitutive hetero-chromatin is positioned toward the nuclear lamina. An open chromatin configuration is associated with elevated translocation risk. 22 Interestingly, I observed a correlation of ITLs with gene density. Table 2 shows that the ranking of gene density per chromosome was significantly correlated with the ranking of ITLs per chromosome (P = .0057; r = .5579). The association between gene density and translocation has been reported before,4,23 but not at the level of the individual chromosome. The large number of ITLs in this study provided the opportunity to make detailed gene assignments and correlations. The gene resolution in individual chromosomes is a novel finding, which I document in representative Circos plots of chromosomes 1, 8, 11, 17, and 19, top ranked in the “All Tumors” group (Figure 3). Circos plots of the bottom-ranked chromosomes 13, 15, 18, 21, and X reveal a striking difference between the gene densities and ITLs of central and peripheral chromosomes (Figure 4). Linear regression between gene density and ITLs was P < .0001 for all chromosomes.
Conclusions
The large number of ITLs in 11 different types of malignancy allows to discern a shared pattern of chromosome territories in cancer: a probabilistic model of chromosomes 1, 8, 11, 17, 19 in the center of the nucleus and chromosomes 13, 15, 18, 21, X at the periphery.
Supplemental Material
sj-xlsx-1-cix-10.1177_11769351221148592 – Supplemental material for Different Tumor Types Share a Common Nuclear Map of Chromosome Territories
Supplemental material, sj-xlsx-1-cix-10.1177_11769351221148592 for Different Tumor Types Share a Common Nuclear Map of Chromosome Territories by Fritz F Parl in Cancer Informatics
Supplemental Material
sj-xlsx-2-cix-10.1177_11769351221148592 – Supplemental material for Different Tumor Types Share a Common Nuclear Map of Chromosome Territories
Supplemental material, sj-xlsx-2-cix-10.1177_11769351221148592 for Different Tumor Types Share a Common Nuclear Map of Chromosome Territories by Fritz F Parl in Cancer Informatics
Supplemental Material
sj-xlsx-3-cix-10.1177_11769351221148592 – Supplemental material for Different Tumor Types Share a Common Nuclear Map of Chromosome Territories
Supplemental material, sj-xlsx-3-cix-10.1177_11769351221148592 for Different Tumor Types Share a Common Nuclear Map of Chromosome Territories by Fritz F Parl in Cancer Informatics
Footnotes
Acknowledgements
I am indebted to all scientists and patients who contributed to the TCGA PanCancer Atlas. This study would not have been possible without the accessibility and transparency of cBioPortal.org - kudos to the developers and curators.
Funding:
The author received no financial support for the research, authorship, and/or publication of this article.
Declaration of Conflicting Interests:
The author declared no potential conflicts of interest with respect to the research, authorship, and/or publication of this article.
Author Contributions
Not applicable.
Supplemental Material
Supplemental material for this article is available online.
References
Supplementary Material
Please find the following supplemental material available below.
For Open Access articles published under a Creative Commons License, all supplemental material carries the same license as the article it is associated with.
For non-Open Access articles published, all supplemental material carries a non-exclusive license, and permission requests for re-use of supplemental material or any part of supplemental material shall be sent directly to the copyright owner as specified in the copyright notice associated with the article.