
Abstract
Epidemiologic evidence for the association of cholesterol and breast cancer is inconsistent. Several factors may contribute to this inconsistency, including limited sample sizes, confounding effects of antihyperlipidemic treatment, age, and body mass index, and the assumption that the association follows a simple linear function. Here, we aimed to address these factors by combining visualization and quantification a large-scale contemporary electronic health record database (the All of Us Research Program). We find clear visual and quantitative evidence that breast cancer is strongly, positively, and near-linearly associated with total cholesterol and low-density lipoprotein cholesterol, but not associated with triglycerides. The association of breast cancer with high-density lipoprotein cholesterol was non-linear and age dependent. Standardized odds ratios were 2.12 (95% confidence interval 1.9-2.48), P = 5.6 × 10⁻³¹ for total cholesterol; 1.99 (1.75-2.26), P = 2.6 × 10⁻²⁶ for low-density lipoprotein cholesterol; 1.69 (1.3-2.2), P = 9.0 × 10⁻⁵ for high-density lipoprotein cholesterol at age < 56; and 0.65 (0.55-0.78), P = 1.2 × 10⁻⁶ for high-density lipoprotein cholesterol at age ⩾ 56. The inclusion of the lipid levels measured after antihyperlipidemic treatment in the analysis results in erroneous associations. We demonstrate that the use of the logistic regression without inspecting risk variable linearity and accounting for confounding effects may lead to inconsistent results.
Keywords
Introduction
Breast cancer (BRCA) is the most commonly occurring cancer in females. The association of BRCA with circulating lipids, including low-density lipoprotein cholesterol (LDL), high-density lipoprotein cholesterol (HDL), total cholesterol (TC) and triglycerides (TG), has been studied repeatedly. However, the results are largely inconsistent. For example, positive association for TC, 1 LDL,2 -4 HDL,2,5 and TG, 6 null association for TC,7,8 LDL,9,10 and HDL,11,12 and negative association for TC, 13 LDL,14,15 and HDL13,16,17,18 have all been reported. Several factors may account for these inconsistent results, including limited sample sizes, the confounding effects of antihyperlipidemic treatment, age, and body-mass index (BMI).19 -25 It is not clear from prior studies how lipids, age, and BMI interact to shape BRCA risk. In addition, logistic regression analysis for a continuous exposure variable assumes that the underlying relationship follows a linear function, which has rarely been validated.
It is generally assumed that a positive association means a monotonic increase of the BRCA risk with the increase of the lipid value over the full spectrum of the lipid value, a negative association means a monotonic decrease of the risk with the increase of the lipid value, and a null association means no clear change of the risk with the change of the lipid value. However, such a detailed relationship over the full spectrum of the lipid values has not been validated. To acquire a clear, reliable understanding of the relationship between BRCA risk and lipid values, an approach that can directly assess the BRCA risk at many different lipid levels, representing the full spectrum of the lipid variable, is needed. Further, to understand the confounding effect of a variable such as age on the relationship of BRCA risk and a lipid, a map can be created to visualize the changes of the risk at two-dimensional coordinates (eg, [LDL, age]).
The All of Us research program is a national-wide effort to collect health-related information in 1 million US residents.26,27 Electronic health records (EHR) of the current release (2020, v4) includes 315 297 participants. In this study, we aimed to provide a complete assessment of association of BRCA risk across the full spectrum of TC, LDL, HDL, and TG values while accounting for age, BMI and race/ethnicity using data from the All of Us Research Program.
Materials and Methods
Study design and participants
ICD9 and ICD10 codes 174 and C50 are used to identify BRCA cases in All of Us database. 27 There are 6519 BRCA cases, where 6347 females, 86 males and 86 others. Since the number of non-female BRCA patients was small and BRCA mechanisms for male and female may differ to some extent, male and unknown-gender BRCA patients are excluded from our study. BRCA related carcinoma in situ of BRCA (ICD 9 code 233 and ICD10 code D05) is excluded from our analysis. The age for BRCA cases is calculated from the first diagnosis date, while for controls it is calculated from the date of the lipid measurement. Participant BMI is calculated from weight and height that are measured at the time of physical measurement assessment for all participants. For race/ethnicity, the common categories White, Black, Hispanic, and Asian are used.
To find the intact association of BRCA with cholesterol and to examine the influence of lipid-treatment on the association, we selected 2 cohorts (Table 1) that make use of all available participants for 2 different situations. In cohort 1, cases are female BRCA patients who have all variate and covariates data (TC, LDL, HDL, TG, BMI, age, and race/ethnicity), where TC, LDL, HDL, and TG values that are measured before any statin treatment, including atorvastatin, cerivastatin, fluvastatin, lovastatin, pitavastatin, pravastatin, rosuvastatin, and simvastatin, and are most close to the diagnosis date of BRCA are chosen for analysis. Controls were female participants who have all covariates data but do not have any record of BRCA, carcinoma in situ of BRCA, or statin treatment. So, no influence of lipid-treatment on the association is expected from cohort 1. In Cohort 2, no restriction of lipid treatment is applied for each case, therefore, it includes cases whose lipid values are measured after lipid treatment. The last record of the multiple measurements of TC, LDL, HDL or TG is chosen without considering the date of drug treatment. Cohort 2 uses the same controls as cohort 1.
Characteristics of female breast cancer cohorts from All of Us research program.

Participants for cohort 1 have lipid measurements prior to lipid treatment. Cases in cohort 2 are mixed with lipid treated and untreated BRCA patients, while the controls are the same as that of cohort 1. Cohort 2 is used to examine the effect of lipid-treatment on the association of breast cancer with cholesterol. Participants with unknown race-ethnicity are not listed. Data are expressed as mean ± SD, or n (%).
Visualization of the association
In order to estimate the shape of the BRCA association with each continuous variable without assuming a linear relationship, we used prevalence (risk) curves and spline regression curves. 28 A risk curve directly accesses the BRCA prevalence P at a series of intervals for a continuous variable x, while a spline regression curve shows the logit of P (log [P/(1-P)]) at a series of knots of x. For a perfect linear association, the logit curve is a line, while the risk curve is a sigmoid function which has a linear region around the center. To visually estimate the confounding effect between 2 continuous variables, we extend the risk curve to a two-dimensional map that assesses the risk variation over 2 coordinates.
To visualize the association of BRCA with continuous variables with above approaches, we take a wide value range for each variable and then divide the range into fine-scale bins to reveal the detailed relationship. Here, a bin is defined as a half-closed interval which is labeled by the end value, for example, the bin of age 50 with a bin-size of 5 years is (45, 50). In this study, the number of intervals or nodes for each variable is set to at least 10. Values outside the range are put into their nearest bins. The value ranges are 100-300 mg/dL for TC, 40-220 mg/dL for LDL, 30-100 mg/dL for HDL, 50-250 mg/dL for TG, 30-75 years for age, and 22-40 kg/m2 for BMI. These continuous variables are divided into fine-scale bins (interval size 5-20 mg/dL for lipids, 5 years for age and 2 kg/m2 for BMI), then BRCA risk (number of BRCA cases over number of participants) at each bin is calculated. This results in a one-dimensional curve for univariate analysis and a two-dimensional map for bivariate analysis.
Quantitation of the association
Logistic regression is used to quantitate the relationship between BRCA with each variable and combination of variables. Lipid values measured after statin treatment are used to evaluate the treatment effect on the BRCA association. For multivariable logistic regression, age, BMI, and race/ethnicity are included as covariates. Our strategy for multivariable logistic regression was to include only non-linear terms that are significant and validated as well by the risk-curve and risk-map. Because of the co-linearity of variable TC with LDL and HDL, and variable White with Black, Hispanic, and Asian, 2 separate multivariable logistic regressions were carried out for the final models: one with variables LDL, HDL, TG, age, BMI, and White, and the other with variables TC, age, BMI, Black, Hispanic, and Asian. The results for age and BMI are the average over the 2 regressions.
The continuous variables TC, LDL, HDL, TG, BMI and age either have different units or have the same unit but different ranges, so the usual logistic regression coefficient and odds ratio (OR) cannot be directly compared to rank their association strengths with BRCA. To aid in the direct interpretation between effect sizes of different lipid values, we calculated the standardized regression coefficients by first multiplying the usual coefficients with standard deviations of the independent variables and then dividing by the standard deviation of the dependent variable. 29 The standardized odds ratio can then be calculated from the standardized coefficient. Python module statsmodels was used for logistic regression in this work and the Jupyter notebook source code can be accessed as All of Us registered users.
Results
Visualization of associations between BRCA and cholesterol measures
The visualization is applied to continuous variables TC, LDL, HDL, TG, age, and BMI. Figure 1 shows the risk curves of BRCA versus age and BRCA versus BMI, and 2D risk map of BRCA versus [age, BMI]. The age curve reveals a near-linear and positive relationship between BRCA and age, and the BMI curve shows an overall negative association between BRCA and BMI with apparent fluctuations. The risk variability (highest risk − lowest risk) of a curve may reflect the underlying association strength. The risk variability is 0.2 for the age curve and 0.05 for the BMI curve, indicating that the association of BRCA with age is much stronger than that of BRCA with BMI. Although the overall BRCA-BMI association is negative, the highest risk region in [age, BMI] map is located at high BMI (3438) and high age (6575). As age is the dominating covariate, only 2D risk maps for lipid with age are shown (Figure 2). The risk curve of BRCA with TC is very similar to that with LDL: strong, positive, smooth, and approximated as Sigmoid functions, although there is a small rise at the lower end. The risk variability is 0.24 for TC and 0.29 for LDL, and both associations are much strong than BMI.
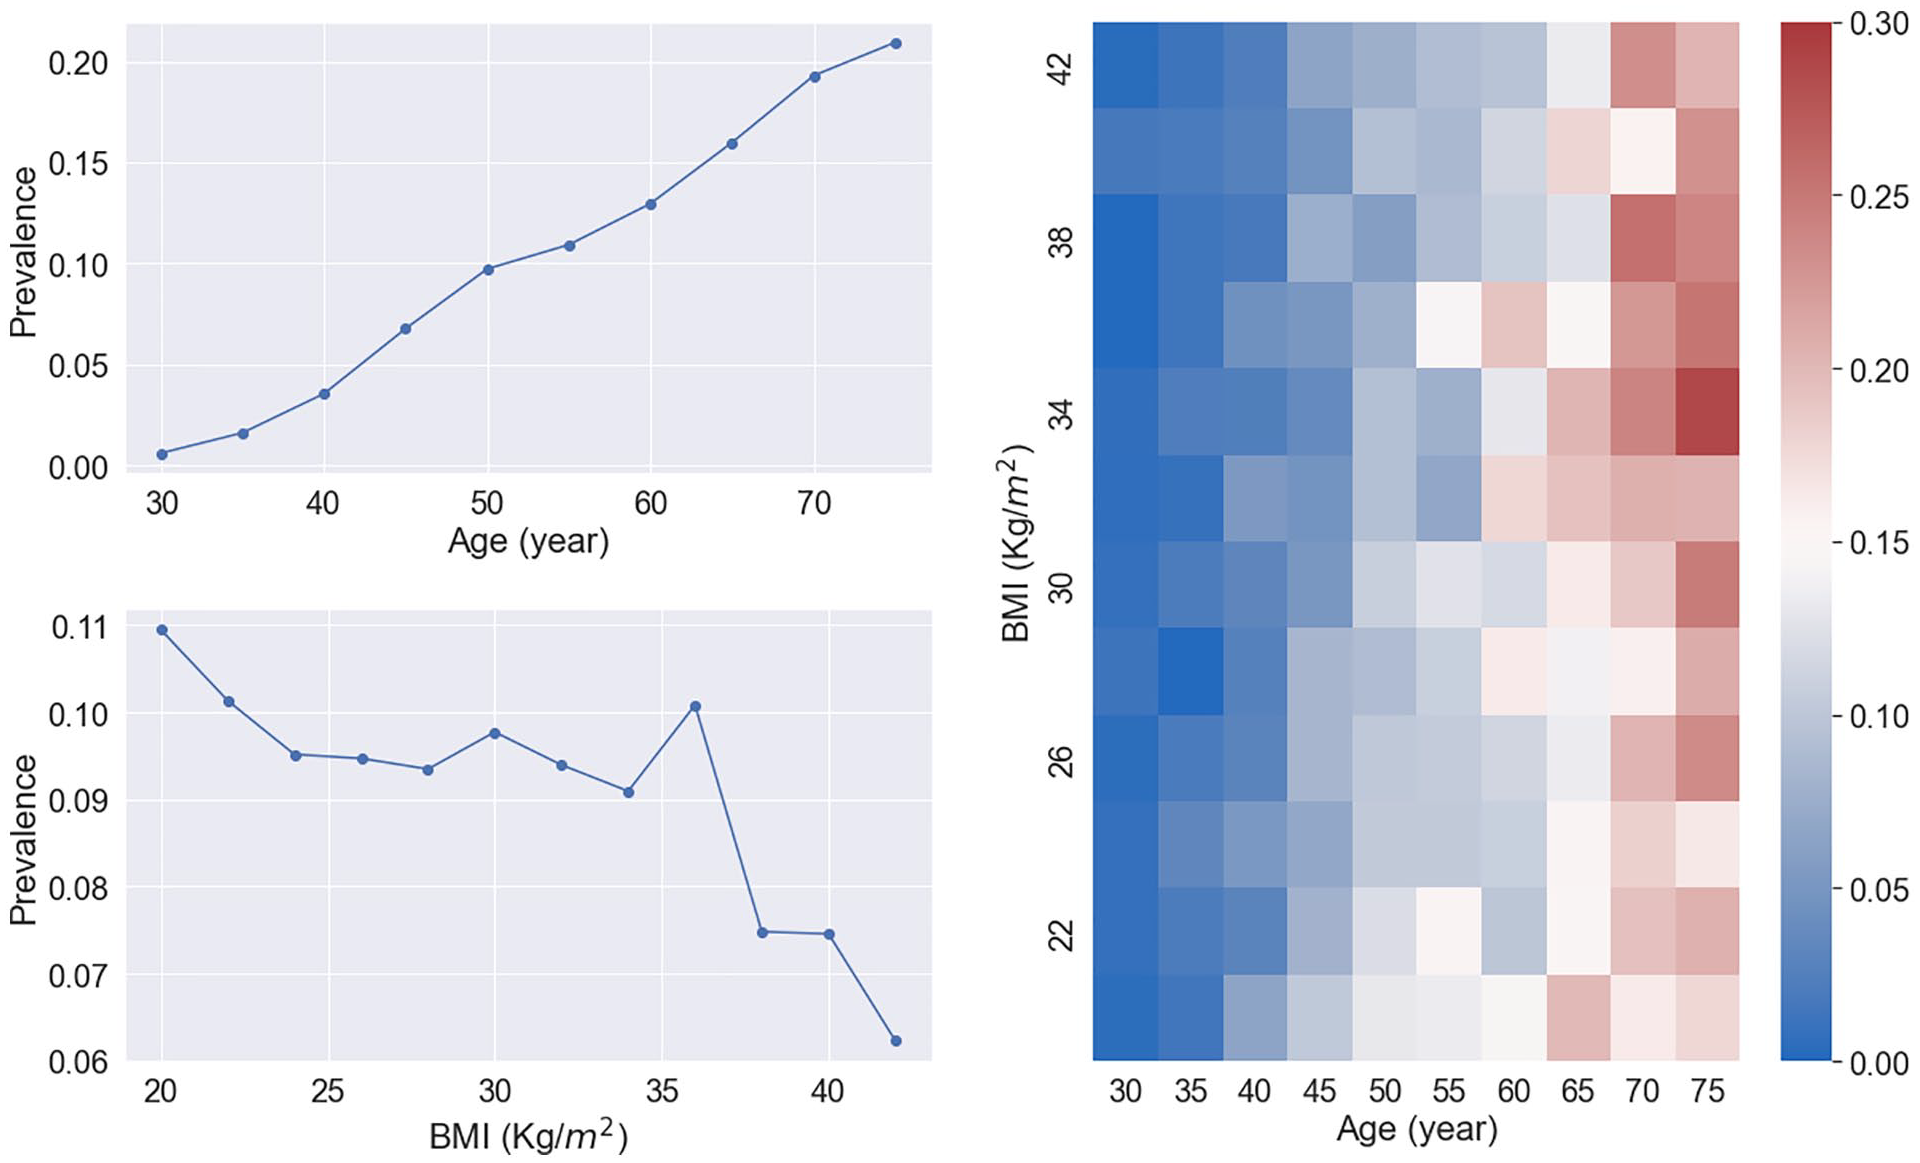
BRCA risk curves of age and BMI (left) and the risk map of age and BMI (right) for cohort 1. Age is positively and strongly associated with BRCA and the association of BMI and BRCA is confounded by Age. The color scale-bar value for the risk map represents breast cancer prevalence.
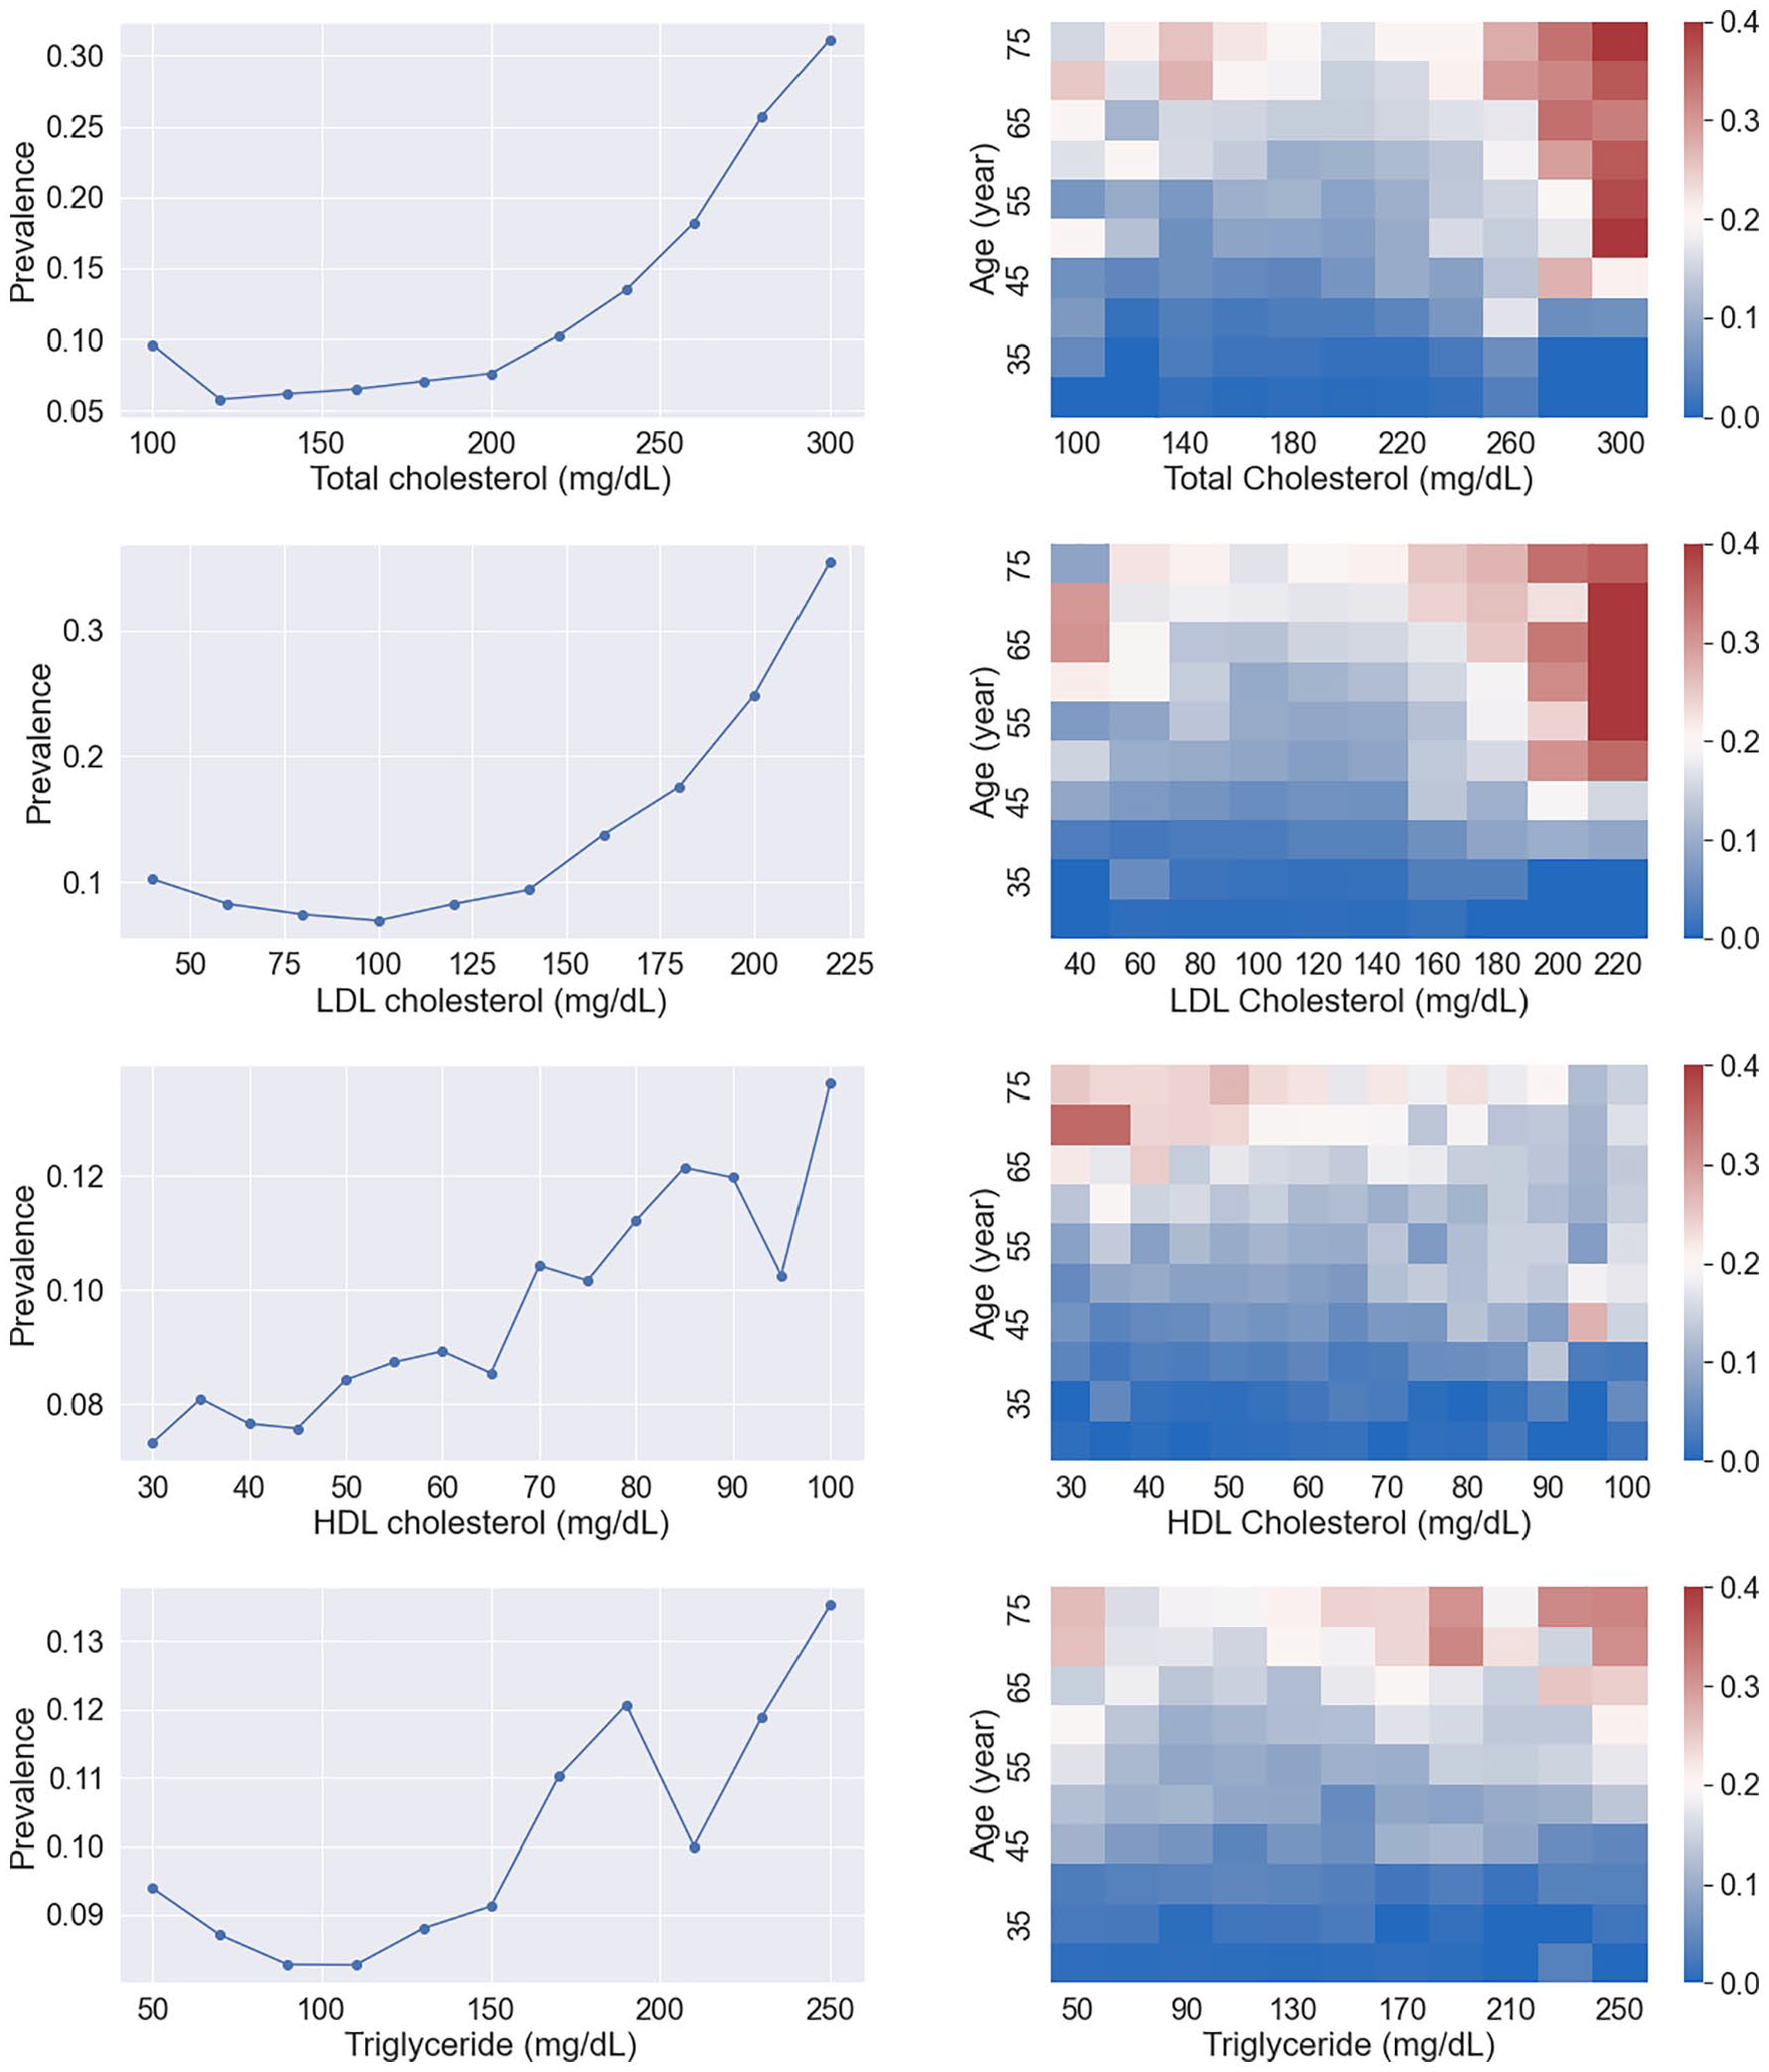
BRCA risk curves (left) of lipids and their risk maps (right) with Age for cohort 1. The overall associations of TC and LDL with BRCA are positive, strong and their curve shape is close to the sigmoid function. The association of HDL with BRCA is confounded by Age. Triglyceride is weakly associated with BRCA. The color scale-bar value for the risk map represents breast cancer prevalence.
The HDL curve shows an overall positive association between HDL and BRCA. The risk variability is 0.07, suggesting that HDL association is weaker than TC or LDL association. Although the HDL curve shows a positive and near-linear association, the [HDL, age] map shows that the main high-risk region is located at low HDL and high age, indicating a strong confounding effect of age on HDL. By careful examination of this map, a reverse association of HDL with BRCA for high age (⩾60) is discernible. The TG curve has an irregular shape with a risk variability of 0.05. The overall association appears positive but very weak. Spline-regression curves showed similar relationships (Figure 3). The association coefficient of triglyceride with BRCA is much smaller than those of TC, LDL and HDL, suggesting a null association between TG and BRCA.

Figure 4 shows the risk curve and maps of TC, LDL, HDL, and TG for cohort 2. These risk curves and maps for TC and LDL are clearly altered when compared to the non-statin treated case in Figure 2: the shape is significantly deviated from the sigmoid/linear function. Significant reverse associations are present for TC and LDL on the lower side. This can be seen more clearly from the [TC, age] and [LDL, age] maps, where the main high-risk region is on the top-left corner. On the contrary, the shapes of HDL and TG risk curves are more linear than their non-treated curves and maps, and the associations appear enhanced (risk variability is 0.09 for HDL and 0.08 for TG).

Visualization of the influence of lipid treatment on the association of BRCA with TC, LDL, and HDL for cohort 2. The color scale-bar value for the risk map represents breast cancer prevalence.
Quantitation of associations between BRCA and cholesterol measures
The above visual inspection for cohort 1 suggests that variables TC, LDL, and TG can be treated as linear, but for HDL a non-linear cross term HDL × age should be added to the multivariable logistic regression because of the strong confounding effect between HDL and age (Table 2). Coefficients of HDL and HDL × age can be combined as 0.0484(1-age/55.8) HDL, suggesting a positive HDL association for age < 56 and a negative association for age ⩾ 56. At age ~56, the BRCA risk is nearly constant over the full range of HDL (Figure 2). If the cross-term is not included in the model, that is, if a linear HDL relationship is assumed, the logistic regression gives a coefficient of −0.0009 with P-value of .49 (listed as HDL* in Table 2), which would suggest a null association for HDL.
Multivariable logistic regression results for cohort 1.
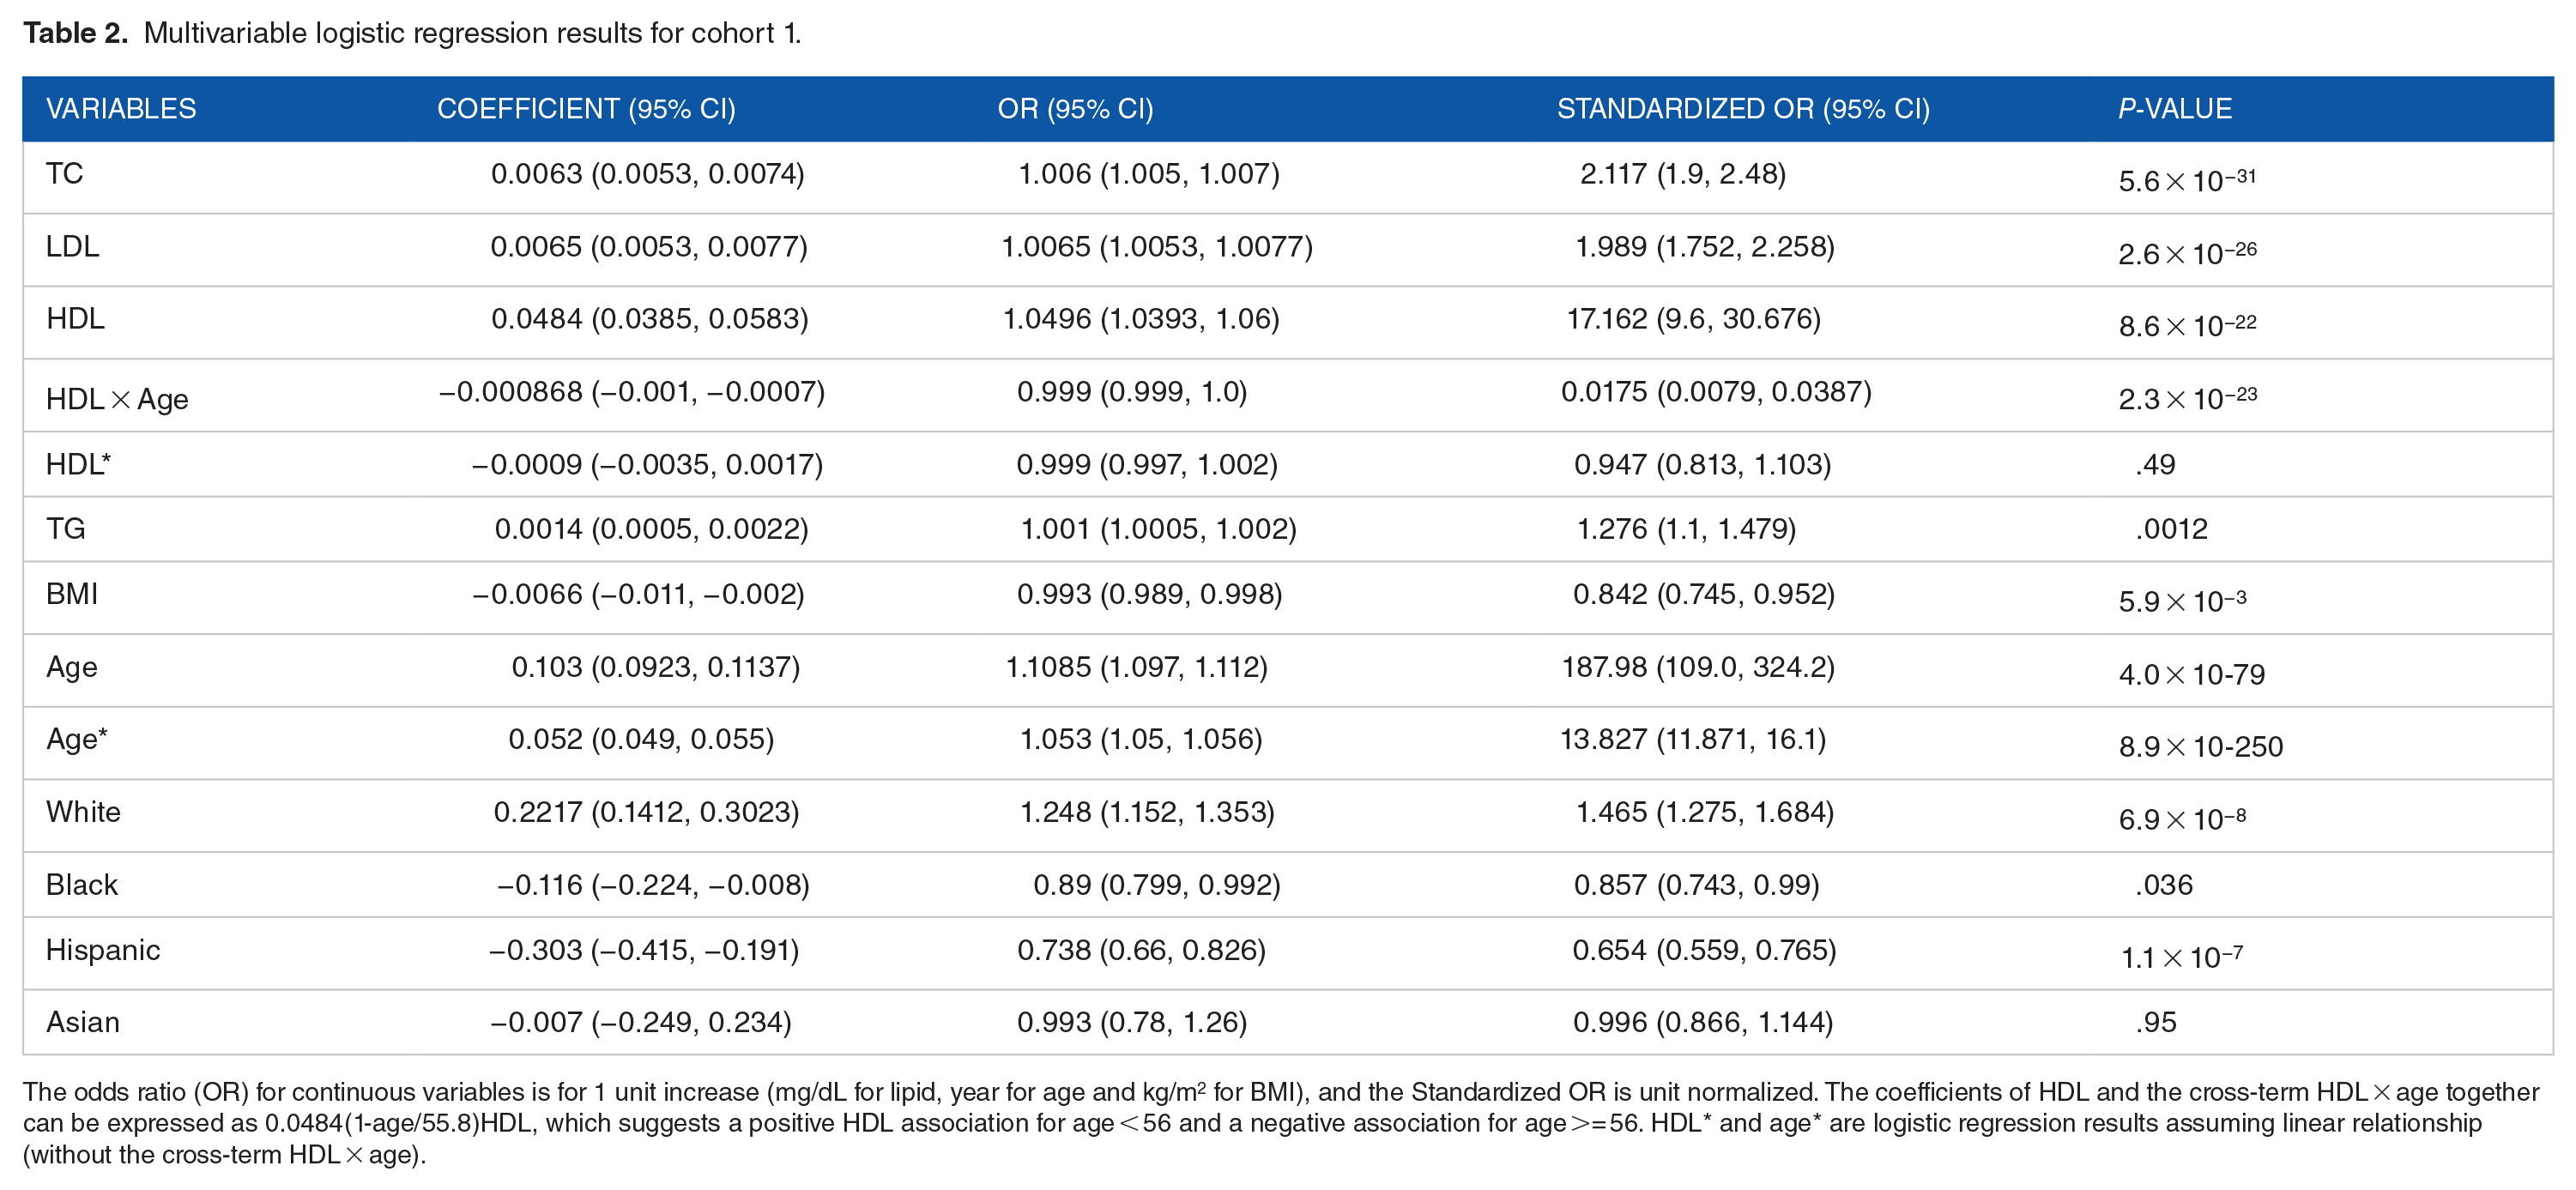
The odds ratio (OR) for continuous variables is for 1 unit increase (mg/dL for lipid, year for age and kg/m2 for BMI), and the Standardized OR is unit normalized. The coefficients of HDL and the cross-term HDL × age together can be expressed as 0.0484(1-age/55.8)HDL, which suggests a positive HDL association for age < 56 and a negative association for age >= 56. HDL* and age* are logistic regression results assuming linear relationship (without the cross-term HDL × age).
By splitting cohort 1 into 2 sub-cohorts at Age = 56, we can quantitate the 2 sub-cohorts separately. Table 3 lists the quantitation results, which suggest that HDL and BMI are age-dependent, while LDL, TG and race/ethnicity are not age-dependent. The standardized odds ratio is 1.69 for the positive HDL association and 0.653 for the negative association; the pre-menopausal group shows a strong BMI negative association (standardized OR 0.58, P = 8.9 × 10⁻⁵), while the post-menopausal group shows a nearly null BMI association (standardized OR 0.954, P = .53). The association of age with BRCA decreases for the post-menopausal group (from standardized OR of 33.9 to 1.48). According to the standardized odds ratio in Tables 2 and 3 we can rank the association strengths of the continuous variables with BRCA: for positive association, age (overall 13.8 from Age* in Table 2) >TC (2.12, Table 2) ~LDL (1.99, Table 2) >HDL (pre-menopausal 1.69, Table 3) >TG (1.28, Table 2); for negative associations, BMI (pre-menopausal 0.58, Table 3) is stronger than HDL (post-menopausal 0.65, Table 3). The strong associations of BRCA with variable age, TC and LDL are also reflected by the large differences between the case mean and control mean (Table 1).
Logistic regression results with 2 age sub-groups of Cohort 1, subgroup with age<56 (~pre-menopausal group), and subgroup with age ⩾ 56 (~post-menopausal group).

The risk curves and maps in Figure 4 were created using cohort 2 and reveal that among lipids TC and LDL are affected mostly by statin treatment and their associations are significantly non-linear, so quadratic term TC2 and LDL2 should be included in the multivariable logistic regression. Variable TC and its square term TC2 can be combined as 1.0028 × 10⁻⁴(TC-207.4)2 (Table 4). This suggests that statin treatment leads to 2 strong opposite associations that are separated at 207 mg/dL: a negative association at lower TC, a positive association at higher TC and an optimal TC value 207 mg/dL at which the risk with TC is the minimum. Similarly, LDL and LDL2 can be expressed as 1.74 × 10⁻⁴(LDL-129.1)2, suggesting 2 opposite associations separated at 129 mg/dL. TC* and LDL* in Table 4 are logistic regression results assuming linear relationship for TC and LDL. The coefficient of −0.0032 for TC and −0.0054 for LDL would indicate that the overall associations are both negative.
Multivariable logistic regression results for cohort 2 that is affected by lipid treatment.

Variable units, mg/dL for lipid, year for age and kg/m2 for BMI. Variable TC and its square term TC2 can be expressed as 1.0028 × 10⁻⁴(TC-207.4)2, LDL and LDL2 can be expressed as 1.74 × 10⁻⁴(LDL-129.1)2, suggesting that TC and LDL have 2 opposite associations with BRCA separated at 207 mg/dL and 129 mg/dL respectively. TC* and LDL* are logistic regression results assuming linear relationship for TC and LDL, which lead to an overall negative association for both.
Discussion
The association of BRCA with lipid measures has been studied extensively, but with inconsistent results. Here we utilize a large, contemporary cohort to visualize and quantify the association of BRCA with lipid values and other co-variates. Our analysis suggests that utilization of logistic regression that assumes a simple linear between BRCA and lipids leads to erroneous conclusions due to difference in disease risk across the full spectrum of lipid values. Using one-dimensional risk curves and two-dimensional risk maps, we visually inspected the linearity of associations between BRCA and cholesterol, and the confounding effects between cholesterol values, age, and body mass index. We find that the associations of BRCA with TC and LDL are strong, positive, and near-linear, the association with HDL is non-linear and age-dependent, and the association with TGs is very weak or null. The size of the All of Us cohort also enabled a high resolution of variable relationships. Limitations of our analysis included a lack of consideration of other laboratory data such as estrogen levels and a lack of consideration of non-statin antihyperlipidemic treatment.
Conclusion
In summary, we visualized and quantified the association of BRCA with lipid measures and other co-variates. We find that the associations of BRCA with TC and LDL are strong, positive, and near-linear, the association with HDL is non-linear and age-dependent, and the association with TGs is very weak or null. We explored effects of statin treatment on the associations and demonstrated that the inclusion of treated lipid values can significantly alter the underlying associations. Our study demonstrates that the use of the logistic regression without considering BRCA risk across the spectrum of lipid values may lead to inconsistent results.
Footnotes
Funding:
The author(s) disclosed receipt of the following financial support for the research, authorship, and/or publication of this article: This work and the University of Arizona - Banner Health All of Us Research Program is supported by OT2OD026549 from the National Institutes of Health’s Office of the Director. JHK is supported by the NIH’s National Heart, Lung, and Blood Institute (NHLBI, K01HL143137, R01 HL158686, R01 HL156993). The All of Us Research Program is supported by the National Institutes of Health, Office of the Director: Regional Medical Centers: 1 OT2 OD026549; 1 OT2 OD026554; 1 OT2 OD026557; 1 OT2 OD026556; 1 OT2 OD026550; 1 OT2 OD 026552; 1 OT2 OD026553; 1 OT2 OD026548; 1 OT2 OD026551; 1 OT2 OD026555; IAA #: AOD 16037; Federally Qualified Health Centers: HHSN 263201600085U; Data and Research Center: 5 U2C OD023196; Biobank: 1 U24 OD023121; The Participant Center: U24 OD023176; Participant Technology Systems Center: 1 U24 OD023163; Communications and Engagement: 3 OT2 OD023205; 3 OT2 OD023206; and Community Partners: 1 OT2 OD025277; 3 OT2 OD025315; 1 OT2 OD025337; 1 OT2 OD025276. In addition, the All of Us Research Program would not be possible without the partnership of its participants.
Declaration Of Conflicting Interests:
The author(s) declared no potential conflicts of interest with respect to the research, authorship, and/or publication of this article.
Author Contributions
Conceptualization and design: JF, JHK, and EAS; Data curation: JF; Formal analysis: JF; Funding acquisition: JHK; Investigation: JF and JHK; Methodology: JF and JHK; Project administration: JHK; Resources: JHK; Software: JF; Validation: JF; Visualization: JF; Roles/Writing – original draft: JF and JHK; Writing – review & editing: JF, JHK, and EAS.