
Abstract
Motivation:
The PAM50 signature/method is widely used for intrinsic subtyping of breast cancer samples. However, depending on the number and composition of the samples included in a cohort, the method may assign different subtypes to the same sample. This lack of robustness is mainly due to the fact that PAM50 subtracts a reference profile, which is computed using all samples in the cohort, from each sample before classification. In this paper we propose modifications to PAM50 to develop a simple and robust single-sample classifier, called MPAM50, for intrinsic subtyping of breast cancer. Like PAM50, the modified method uses a nearest centroid approach for classification, but the centroids are computed differently, and the distances to the centroids are determined using an alternative method. Additionally, MPAM50 uses unnormalized expression values for classification and does not subtract a reference profile from the samples. In other words, MPAM50 classifies each sample independently, and so avoids the previously mentioned robustness issue.
Results:
A training set was employed to find the new MPAM50 centroids. MPAM50 was then tested on 19 independent datasets (obtained using various expression profiling technologies) containing 9637 samples. Overall good agreement was observed between the PAM50- and MPAM50-assigned subtypes with a median accuracy of 0.792, which (we show) is comparable with the median concordance between various implementations of PAM50. Additionally, MPAM50- and PAM50-assigned intrinsic subtypes were found to agree comparably with the reported clinical subtypes. Also, survival analyses indicated that MPAM50 preserves the prognostic value of the intrinsic subtypes. These observations demonstrate that MPAM50 can replace PAM50 without loss of performance. On the other hand, MPAM50 was compared with 2 previously published single-sample classifiers, and with 3 alternative modified PAM50 approaches. The results indicated a superior performance by MPAM50.
Conclusions:
MPAM50 is a robust, simple, and accurate single-sample classifier of intrinsic subtypes of breast cancer.
Introduction
The intrinsic subtypes of breast cancer, namely Luminal A (LumA), Luminal B (LumB), HER2-enriched (Her2), Basal-like (Basal), and Normal-like (Normal), have distinct molecular characteristics and prognostic attributes. 1 Thus, it is of great importance to have a robust breast cancer intrinsic subtype classifier. Unlike the clinical subtypes of breast cancer, which are identified using immunohistochemical biomarkers such as estrogen receptor (ER), the intrinsic subtypes are determined based on expression profiling of a gene signature. The most widely used signature/method for intrinsic subtyping of breast cancer, PAM50 uses the expression of a set of 50 genes in conjunction with a nearest centroid approach. Specifically, PAM50 computes the rank correlations between the preprocessed samples and 5 centroids, found using the PAM algorithm, 2 each corresponding to one of the subtypes. Each sample is then assigned the subtype corresponding to its nearest centroid (the one with highest rank correlation).
Despite its popularity and widespread use, PAM50 subtyping has been shown to suffer from lack of robustness: that is, the subtype assigned to a sample from a cohort may change depending on the other samples included in the cohort.3-7 For example, Patil et al 3 showed that both the number of samples and the percentage of ER-positive samples in a dataset significantly affect the subtyping results. This lack of robustness is due to sample preprocessing, which includes subtraction of a reference profile from each sample. The reference is computed using all samples included in the analysis, and so removing or adding samples to the dataset generally changes the reference and consequently may change the assigned subtypes. Even for the same set of samples, the assigned subtypes may depend on the applied gene expression normalization method. 8 Additionally, there are different PAM50 implementations that differ in the way the reference is computed. The results of these different implementations have also been shown to have less than optimal concordance with each other.6,9
To resolve the robustness issue, Patil et al 3 suggested using PAM50 with no preprocessing. On the other hand, 2 recent publications proposed new methods to subtype a breast cancer sample in an “absolute” way, namely in a manner that is independent of all other samples. Raquett and Hallett 6 proposed a set of 151 genes and a set of 100 rules comparing the pair-wise unnormalized expressions of these genes to classify breast cancer samples. Note that, this method, called AIMS, uses unnormalized (no between-sample normalization) gene expressions, thus eliminating the effect of other samples. The authors showed good agreement between the PAM50 subtyping and their results when the method was applied to an independent dataset. To improve on this work, Seo et al developed MiniABS, 7 a method that utilizes an 11-gene signature in conjunction with a Random Forest model (again using unnormalized data) for intrinsic subtype classification. MiniABS was tested on multiple datasets demonstrating improved performance.
This paper aims to classify breast cancer samples in a way that is robust and more accurate than previously published approaches. To this end, we propose a modified version of PAM50, called MPAM50, which uses unnormalized expression values for subtyping and thus avoids the issue of lack of robustness. We show that: (1) MPAM50- and PAM50-assigned subtypes are in overall good agreement, (2) MPAM50 preserves the prognostic value of the intrinsic subtypes, and (3) MPAM50 and PAM50 perform comparably in terms of agreement between the assigned intrinsic subtypes and the reported clinical subtypes. Additionally, we compare our results to those of AIMS, MiniABS, and 3 alternative modified PAM50 approaches (including the one suggested by Patil et al 3 ), and show a superior performance by MPAM50. These findings suggest MPAM50 is a robust and accurate method for intrinsic subtyping of breast cancer.
Methods
Overview
MPAM50, like PAM50, takes a nearest centroid approach for intrinsic subtyping of breast cancer. In other words, each intrinsic subtype is represented by a centroid vector, calculated using expression profiles form a training set, and a patient is assigned the subtype whose centroid is nearest to the patient’s expression profile. Additionally, MPAM50 utilizes the PAM50 genes, namely each centroid is a 50-dimensional vector whose elements correspond to these 50 genes. However, MPAM50 and PAM50 differ in 3 ways: in MPAM50 (1) each centroid is simply calculated as the average of the weighted unnormalized log-transformed expression profiles in the training set (see the next subsection for details), (2) each sample is classified independently using unnormalized log-transformed expression values (no reference subtraction), and thus the issue of lack of robustness is resolved, and (3) Pearson (instead of rank) correlations are used to measure the distances from the centroids.
We used publicly available data (see the “Data” subsection) to find the MPAM50 centroids and to assess the performance of MPAM50. We tested MPAM50 in 3 ways: (1) computing the prediction accuracy of MPAM50 (and comparing the accuracy to those achieved by previously published methods), (2) comparing the survival probability curves predicted by MPAM50 and PAM50, and (3) evaluating the agreement between the predicted intrinsic subtypes and the corresponding clinical subtypes. Detailed descriptions of these tests are given in the following subsections. To give a visual overview of the study, a flowchart describing the step by step procedure is shown in Figure 1.

Overview of the study. In this study, we first found the MPAM50 centroid corresponding to each intrinsic subtype. For a given subtype, the centroid was calculated as the weighted average of the log-transformed unnormalized samples (in the training set) that had been assigned that subtype by PAM50 (see equations (1) and (3)). The centroids were then used to classify all samples in the testing set (See the Data subsection and Table 1). Each sample was assigned the subtype whose centroid had the largest Pearson correlation with the sample. The performance of MPAM50 was then assessed in 3 ways: (1) comparing the prediction accuracy of MPAM50 with (a) concordance between 2 implementations of PMA50, and (b) accuracy of the previously published robust classifiers, (2) comparing the survival curves predicted by MPAM50 and PAM50, and (3) comparing MPAM50 and PAM50 in terms of the agreement between the assigned intrinsic subtypes and the reported clinical subtypes.
The MPAM50 centroids
In this subsection, the method we used to find the MPAM50 centroids is explained. Given a training set with known PAM50-assigned subtypes, the method uses the average of the weighted (log-transformed) unnormalized samples in each intrinsic subtype as the centroid corresponding to that subtype. We chose averages as the centroids because such centroids have been reported to lead to excellent results for subtyping of lung cancer across tens of independent datasets obtained using different technologies.10,11 To achieve a robust classification each sample should be classified independently, and so classification is performed on the unnormalized samples, namely samples that have not been between-sample normalized or preprocessed in a way that is dependent on other samples (although the samples may be within-sample normalized/preprocessed). Hence, the unnormalized samples are used for calculating the centroids. Mathematically, our approach can be formulated as follows. Let

where
Given the centroids obtained above, the

where
Generalization to more than one training dataset
To increase the number of samples, and to include expression data obtained using different technologies (eg, RNA-Seq and microarray), one may want to have multiple datasets in the training set.6,7,12 In such a case, we define the generalized score of the

In other words, when multiple datasets are present in the training set, the centroids for each dataset are first calculated independently and then the overall centroids are found using equation (3).
Data
Training set
To include both RNA-Seq and microarray data, and to increase the number of samples, we included
Also added to the training set was the largest microarray dataset (GSE115577) that we could find in the Gene Expression Omnibus (GEO) database. 14 For GSE115577, 9 Affymetrix CEL files (tumor samples only) and PAM50 subtypes were downloaded from GEO. Each sample of GSE115577 has been assigned 2 potentially different PAM50 subtypes, using 2 different reference calculation methods. Any sample that had been assigned different subtypes using the 2 methods was excluded. The remaining data included 110 Basal, 119 Her2, 346 LumA, 153 LumB, and 32 Normal microarray samples. Before using the data from these 2 datasets in the training set, the expression levels were preprocessed as explained in the “Preprocessing” subsection below.
Testing set
To construct a testing set, a search was conducted in the GEO database to find independent breast cancer datasets that: (1) had publicly available PAM50-assigned intrinsic subtypes, (2) included raw data or within-sample (but not between-sample) normalized values, and (3) contained at least 100 samples and included all 5 intrinsic subtypes. The last criterion was adopted to ensure a reliable assessment of the performance of MPAM50. Of note, there are different implementations of PAM50 and the way the samples are preprocessed before calculating their rank correlations with the PAM50 centroids is different in various implementations. We did not limit our search to a specific implementation or a particular way of calculating the reference (as long as such a reference had been subtracted from the data). We found 19 datasets satisfying our criteria comprising 9637 samples including 1956 Basal, 1101 Her2, 4013 LumA, 1924 LumB, and 643 Normal samples (Table 1). The raw (or, in the case of RNASeq, within-sample normalized) expression levels and, if available, the clinical data for these 19 datasets were downloaded from GEO. The downloaded expression levels were preprocessed as explained in the subsection below. For each dataset, excluding GSE41998, the PAM50 subtype assignments were obtained from the GEO record or the corresponding publication. The assigned PAM50 subtypes of samples in GSE41998 were collected from Prat et al. 15 In GSE54275 expression levels have been profiled using 2 different microarray technologies. For this study we used the ones obtained using the Agilent platform.
Datasets used for testing MPAM50.

Preprocessing
For data obtained using different technologies, the downloaded data were preprocessed as follows:
Prediction accuracy
To assess the performance of MPAM50, the samples in each of the 19 datasets in the testing set were classified and the resulting subtype assignments were compared with PAM50-assigned subtypes. Specifically, we computed the prediction accuracy (
To see if the
One way to assess performance across multiple datasets is to pool the scores and calculate the overall performance measures using the pooled scores. However, Table 1 indicates a large imbalance between the numbers of samples in the included datasets (GSE148426 and GSE96058, contain more than half of the samples). Given that our goal was to evaluate the performance of MPAM50 on data obtained employing different platforms and subtyped using various implementations of PAM50, and due to the large differences in the numbers of samples, pooling the scores was not the best approach for overall performance assessment. Hence, we opted to use the mean, denoted by 〈*〉, and the median, denoted by
Survival analyses
As a second way of testing MPAM50, the MPAM50-predicted survival probabilities for different subtypes were compared with those predicted by PAM50. For datasets reporting survival data (see Table 2), survival analyses were performed using the MPAM50- and PAM50-assigned subtypes. GSE59246 was excluded from this analysis because survival data were available for few samples in this dataset (eg, only 1 Basal sample). Kaplan-Meier survival analyses were performed using the survival package of Bioconductor and the statistical significance of the differences between survival probabilities were assessed using the log-rank test. The differences between survival curves were regarded as significant if the p-value was smaller than 0.05. The figures depicting the survival probabilities (see Results) were generated using the survminer package. Some datasets mentioned in Table 1 contain both overall survival (OS) and relapse-free survival (RFS) data. For these datasets, survival analyses were performed for both OS and RFS data.
Datasets containing survival data.
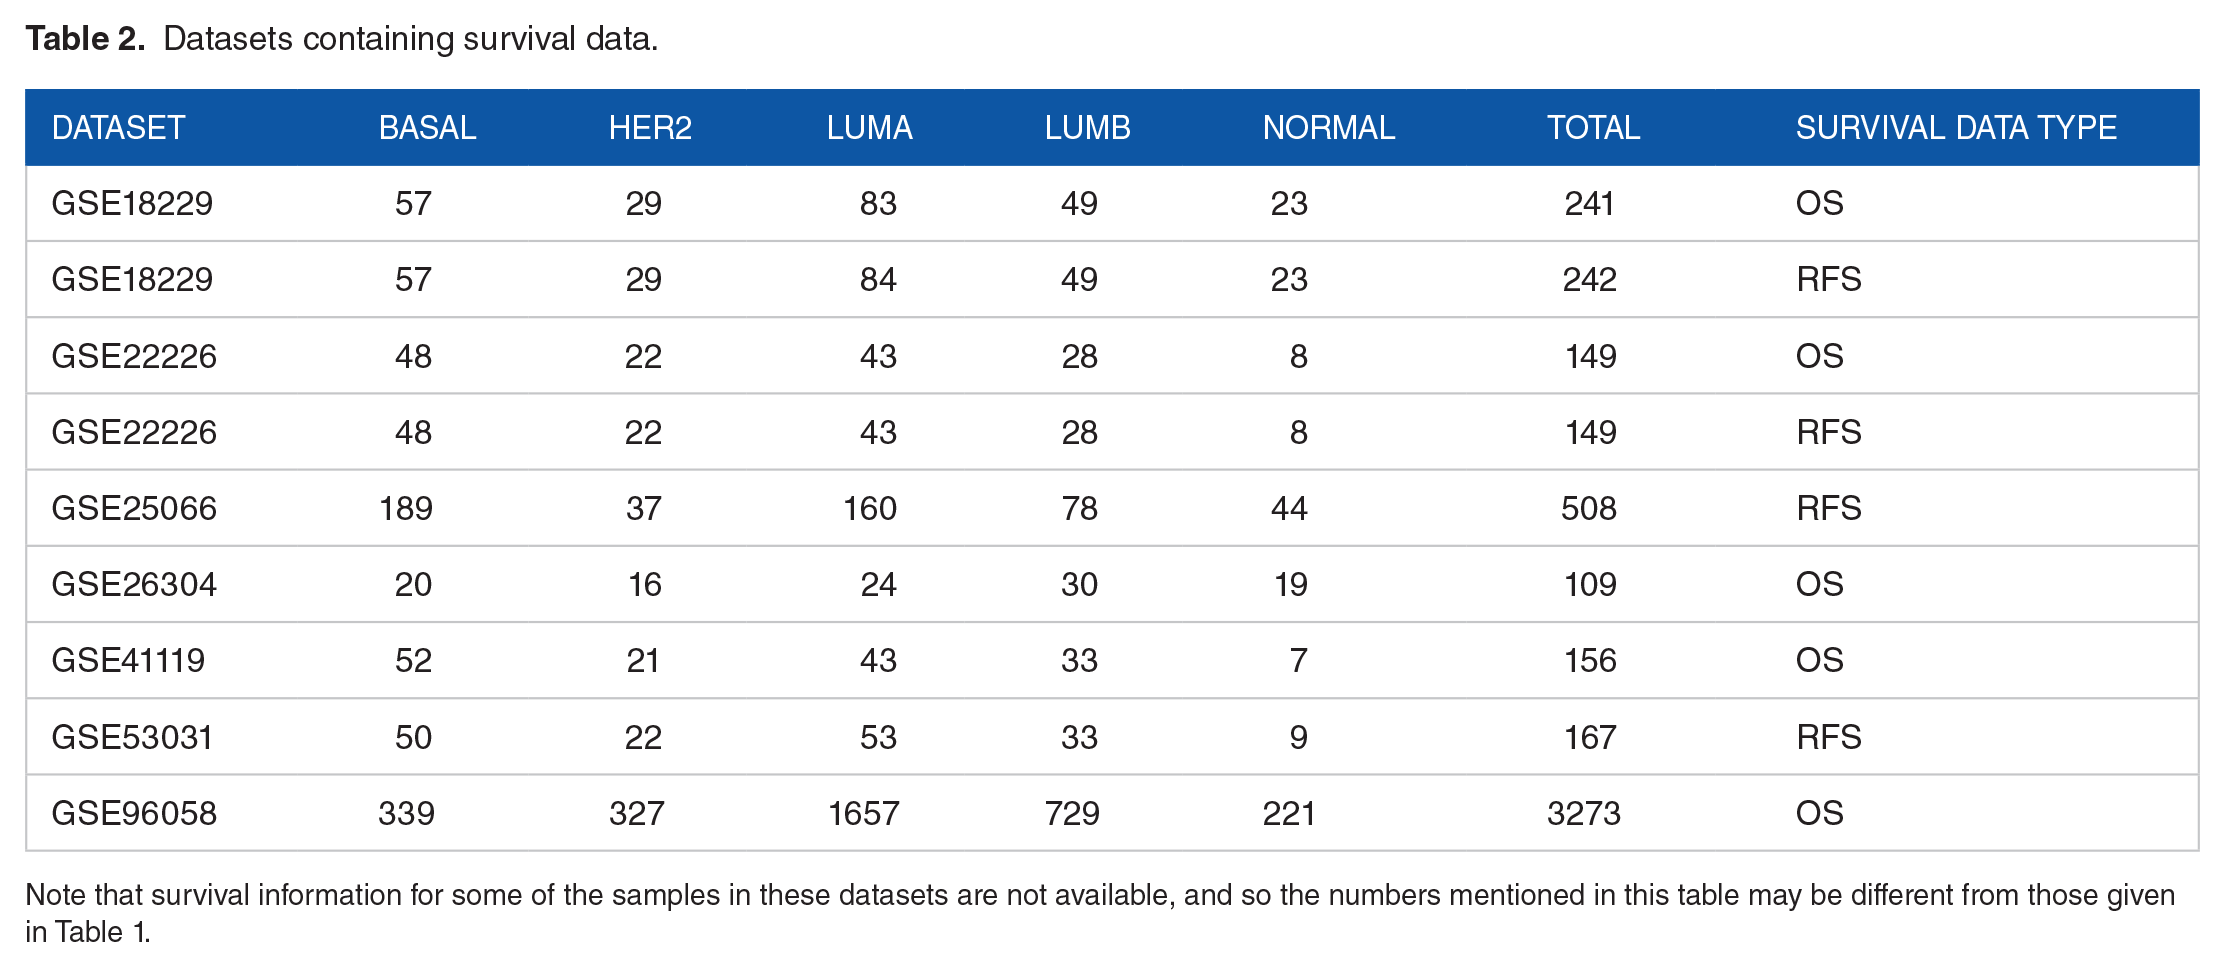
Note that survival information for some of the samples in these datasets are not available, and so the numbers mentioned in this table may be different from those given in Table 1.
Agreement between intrinsic and clinical subtypes
As another way of testing MPAM50, we investigated the degree of overlap between the intrinsic subtypes assigned by MPAM50 and their corresponding clinical subtypes. The clinical subtypes are assigned based on the status of the biomarkers ER, PR, HER2, and sometimes KI67, determined using immunohistochemistry. If the status of all 4 markers are known, 4 clinical subtypes can be distinguished that are luminal A-like (LumA-like), luminal B-like (LumB-like), HER2 + (non-luminal), and triple negative (TN). Based on the status of the 4 markers, the clinical subtypes are defined as follows1,20:
LumA-like: ER+, PR+, HER2−, and KI67 low
LumB-like: (1) ER+, HER2−, and (KI67 high or PR−), or (2) ER+ and HER2+
HER2 + (non-luminal): ER−, PR− and HER2+
TN: ER−, PR−, and HER2-.
Here +/− after a marker means the status of the marker is positive/negative. These 4 clinical subtypes correspond respectively to LumA/Normal, LumB, Her2, and Basal intrinsic subtypes. (Note that the Normal class does not have its own corresponding clinical subtype.) Based on these definitions, for each clinical subtype, we calculated the prediction
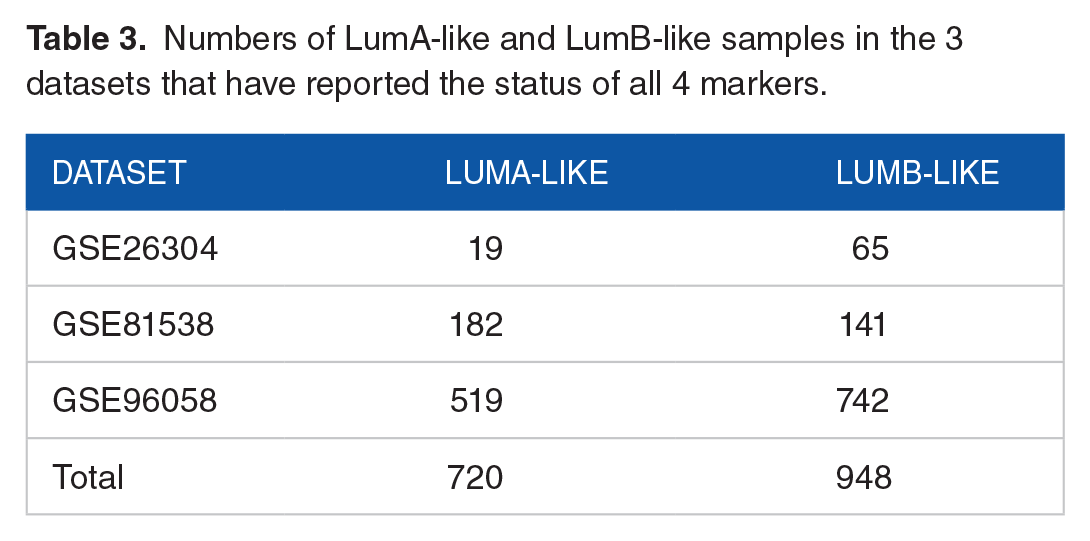
To distinguish LumA-like from LumB-like, the status of KI67 must be known. However, only 3 of the 19 datasets have included information regarding the status of all 4 markers (Table 3). We used these datasets to calculate
Numbers of LumA-like and LumB-like samples in the 3 datasets that have reported the status of all 4 markers.
The number of triple negative and HER2 + (non-luminal) samples in datasets containing the status of the 3 markers ER, PR, and HER2.

Results
This section is organized as follows. First, in the “Finding the centroids” subsection, we present the MPAM50 centroids computed using the approach described in Methods. In the subsequent subsections the results of testing MPAM50 are presented. As mentioned in Methods, and shown in Figure 1, testing was performed in 3 areas: (1) prediction accuracy, (2) agreement between the predicted intrinsic subtypes and the corresponding reported clinical subtypes, and (3) comparing the survival curves predicted by MPAM50 and those predicted by PAM50. Finally, we compare the performance of MPAM50 (in terms of prediction accuracy) with AIMS, MiniABS, and 3 alternative modified PAM50 methods.
Finding the centroids
We used our training set (consisting of data from TCGA and GSE115577) in conjunction with equations (1) and (3) to find a set of centroids for robust subtyping of breast cancer samples (using unnormalized samples and employing a nearest neighbor approach; see Methods for details). The expression values for 2 genes (KRT5 and KRT17) were missing in most of the GSE115577 samples. When calculating the standard deviations of samples with missing expression values, these genes were excluded (see equation (1)). Also, samples with missing values were excluded when computing the averages for these 2 genes. The resulting centroids are given in Table 5.
The centroids.

Prediction accuracy
MPAM50 was tested using 19 independent datasets containing 9637 samples (Table 1). Since the datasets have been obtained using various technologies covering different genes, expression levels for some of the PAM50 genes were not available in some of the datasets. In such cases the missing genes were ignored, and the sample scores were calculated using only the available expression values. All samples in each dataset were classified using MPAM50 and the resulting subtype assignments were compared with the reported subtypes and the performance measures were calculated. The

Prediction accuracy. The performance measures
For comparison, the concordance between the reported and genefu subtypes for each dataset and the overall concordance measures are also given in Figure 2, showing overall comparable
Note that in 2 of the 19 datasets (GSE54275 and GSE59246) the reported subtypes were obtained using the genefu package. In other words, for these 2 datasets the reported and genefu subtypes should be essentially the same. However, Figure 2 shows smaller than unity, although high, concordance for each of these 2 datasets, indicating that even using the same package for PAM50 subtyping may lead to slightly different results. These differences are presumably due to slightly different preprocessing steps (eg, when multiple probes map to the same genes, using maximum expression level instead of average) and/or various input parameters for genefu (eg, choosing “pam50.scale” rather than “pam50.robust” as the subtyping model).
To show how samples misclassified by MPAM50 are distributed among different subtypes, the average row-normalized confusion matrix is shown in Figure 3. (The individual confusion matrices were first row-normalized and then averaged over the 19 datasets.) The diagonal elements of the matrix are the average subtype-specific

The confusion matrix. The mean row-normalized confusion matrix, averaged over the 19 datasets, is shown.
We now address the issue of variability in
The same level of variability is seen in the concordance between the 2 implementations of PAM50. In fact,
The variability does not appear to be due to differences in gene expression quantification technologies used in various datasets. For example, the data in both GSE26304 and GSE54275 have been obtained using Agilent microarray technology. However, the
A low
Based on these observations we conclude that the variability in
Agreement between intrinsic and clinical subtypes
We first considered the samples that, based on the status of ER, PR, and HER2 markers, were assigned to HER2 + (non-luminal) or triple negative clinical subtypes (892 samples from 10 datasets; see Table 4). Using the clinical subtypes as the gold standard and MPAM50 subtypes as predicted ones, for each of the 10 included datasets

The median class-specific accuracy of predicting the clinical subtypes. The median subtype-specific accuracies achieved by PAM50 and MPAM50 have been plotted for each of the 4 clinical subtypes. For a given clinical subtype the median was computed over all datasets for which that clinical subtype was defined (see text).

The accuracy of predicting the clinical subtypes. For the 3 datasets with available information regarding the status of all 4 markers, the
Survival analysis
Perhaps the most useful aspect of the intrinsic subtypes is their prognostic value, with LumA, LumB, Normal, and Her2/Basal having respectively good, intermediate, intermediate, and poor prognosis. 1 To investigate if subtypes assigned using MPAM50 preserve the distinction between survival probabilities of different subtypes, we performed survival analyses for the 7 datasets that have reported survival data (Table 2). Survival analysis was performed for each of the 7 datasets separately; that is, because of the large differences in median follow-up times (ranging from 29 to 87 months) and the significant imbalance in the numbers of samples, we did not pool the data. These 7 datasets contain overall survival (OS) or relapse-free survival (RFS) data, with 2 (GSE182229 and GSE22226) having both types of data available (Table 2). For these 2 datasets survival analyses were performed for both OS and RFS data. For comparison, survival analyses were also performed using the reported intrinsic subtypes assigned by PAM50.
The ability of MPAM50 to preserve the prognostic value of the subtypes was assessed in 2 different ways. First, for each subtype and each dataset, we investigated if there was any statistically significant difference between the survival curves obtained using the 2 methods (MPAM50 and PAM50). We found
As a second way of verifying the prognostic capacity of MPAM50 subtypes, we compared the survival probabilities of the 5 MPAM50-assigned subtypes for each dataset and found the corresponding p-value. These comparisons were also made for PAM50-assigned subtypes. For datasets with more than 200 samples (Table 2), the survival curves (and the corresponding p-values) are shown in Figure 6A to D (PAM50), and E-H (MPAM50). The remaining survival curves are depicted in Supplemental Figures S2 to S6. Figure 6A to H demonstrate significant differences (

Survival analyses. For different datasets survival probabilities are plotted as functions of time for subtypes obtained using PAM50 (A–D) and using MPAM50 (E–H).
For datasets with fewer than 200 samples, Supplemental Figures S2 to S6 indicate comparable
Of note, the survival curves plotted in Supplemental Figures S2 to S6 do not clearly show the previously mentioned expected survival probability patterns. For example, in Supplemental Figure S2 (GSE22226, OS data) the survival curve of Her2 (obtained by either method) is not clearly lower than that of LumA or LumB. What is important here is the comparison between the curves produced by the 2 methods. We have already mentioned that for each subtype and each dataset there was no statistically significant difference between the survival probabilities (except for the Normal subtype in the case of GSE18229 (OS) where the difference was barely significant
Performance comparison
In this section the performance of MPAM50 is compared with those of AIMS 6 and MiniABS, 7 which were specifically developed for robust classification of the intrinsic subtypes using unnormalized data. Additionally, performance comparisons are made between MPAM50 and 3 alternative modified PAM50 approaches, including the one suggested by Patil et al 3 that is available as a part of the genefu package. In this approach the samples are classified the same way as they are in PAM50, but no reference subtraction is performed. We henceforth call this method PAM50N. The second alternative modified PAM50 method, referred to as PAM50NP, works just like PAM50N but uses Pearson correlation for scoring the samples (same centroids as PAM50, no reference subtraction, and Pearson instead of rank correlation). The third modified version, called MPAM50S, works similarly to MPAM50 but scores the samples using the Spearman rank correlation. Note that, to the best of our knowledge, PAM50NP and MPAM50S have not been used by other investigators. We included these 2 alternative methods in our comparisons only to see how each of the 2 main modifications to PAM50 (using a different set of centroids and using Pearson instead of Spearman correlations) affects the results.
For subtyping using AIMS and MiniABS we employed the R packages provided by the authors of these 2 studies. In the case of AIMS, as suggested by the authors, the unnormalized data were not log-transformed. In all other cases log-transformed unnormalized data were used. The PAM50 centroids (needed for subtyping with PAM50N and PAM50NP) were obtained from the genefu package. Each of the 19 datasets were subtyped using each of the methods mentioned in the previous paragraph, and the

Performance comparison. For MPAM50, MPAM50S, PAM50N, PAM50NP, MiniABS, and AIMS the
Figure 7 demonstrates that MPAM50 outperforms the other methods in terms of
The P-values assessing the statistical significance of the differences shown in Figure 7.
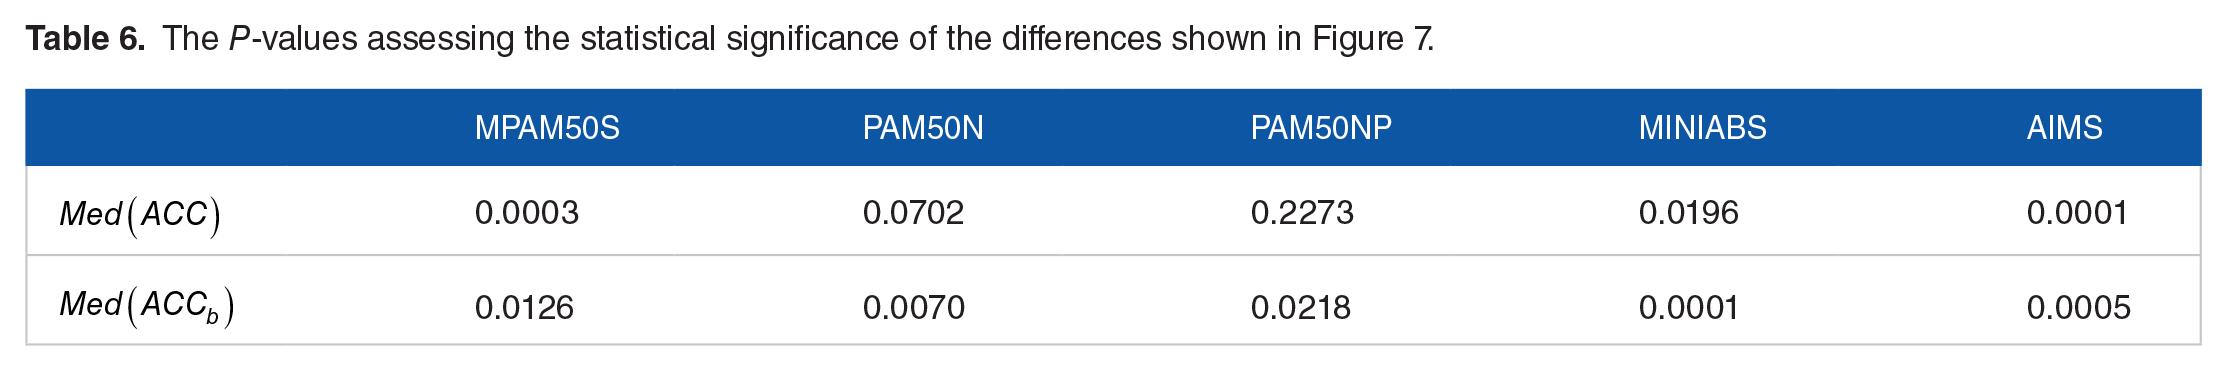
Of note, MiniABS has the benefit of using only 11 genes to classify the samples. However, we believe that the primary goal of a classification method should be achieving a higher accuracy and that the number of genes used for classification should be regarded as a secondary factor in choosing the best approach. In other words, if 2 methods have comparable accuracies, then the method using the lower number of genes can be regarded as superior. But when one classification approach clearly outperforms the other (as is the case here) the number of genes should not be a factor in deciding which approach is better.
Discussion
PAM50 is the most widely-used signature/method for intrinsic subtyping of breast cancer. However, several publications3-5 have reported robustness issues with this method, showing significant dependence of the results on the number and composition of the samples included in the dataset to be classified. This is due to the fact that PAM50 uses all samples in a dataset to calculate the reference to be subtracted from each sample before the samples are scored. A robust single-sample intrinsic subtype classifier is thus desirable. In this paper we introduce MPAM50, a modified version of PAM50 that classifies each sample independently, thereby avoiding the robustness issue.
MPAM50 is able to classify each sample independently because it does not subtract a reference from the samples and uses unnormalized gene expression. Like PAM50, MPAM50 uses the nearest centroid approach for classification, but the centroids are obtained by simply averaging the (weighted) unnormalized samples in the training data and the similarity to each centroid is measured by Pearson correlation rather than Spearman rank correlation. Both of these modifications (using different centroids and different similarity measure) contribute to the success of MPAM50 as a singles-sample classifier. This can be deduced from the fact that MPAM50 outperforms the 3 alternative modified PAM50 methods (PAM50N, MPAM50S, and PAM50NP) that lack one or both of these modifications. The fact that a simple nearest centroid method, which combines averaged centroids and Pearson correlation, can perform well across many datasets/platforms has been already demonstrated in other contexts10,11 (although in these cases the averaging is done over unweighted normalized expression values). In this paper we confirm that such a simple method also performs well in the context of robust intrinsic subtyping of breast cancer. Specifically, we show that MPAM50 outperforms AIMS 6 and MiniABS, 7 2 previously published platform-independent robust classifiers. (We did not compare MPAM50 with the robust subtyping method of Cascianelli et al 4 as it is platform-specific and is meant for subtyping only RNA-Seq samples.)
We have also shown that MPAM50 and PAM50 predict the clinical subtypes with similar accuracy: that is the intrinsic subtypes assigned by the 2 methods agree with the clinical subtypes at a comparable level. As also reported by other studies (see Kim et al
21
and references therein), the agreement is suboptimal, especially in the case of LumB-like subtype. However, the point here is that PAM50 and MPAM50 perform comparably in this regard. Note that in some studies (including Kim et al
21
) LumA-like and LumB-like clinical subtypes have been defined differently (in terms of the status of the relevant biomarkers), and so for these 2 subtypes quantitative comparisons between such studies and ours should be avoided. For each of the remaining clinical subtypes (HER2+ and triple negative), the prediction accuracy of MPAM50 reported here is comparable with that of PAM50 reported by Kim et al
21
(MPAM50:
Another important feature of MPAM50 is preserving the prognostic value of the intrinsic subtypes. We have demonstrated this by performing survival analyses and showing that MPAM50 and PAM50 predict survival probability curves that do not significantly differ. Of note, we have not compared MPAM50 with methods that aim to improve prognostication (see, eg, Pu et al 23 ), because our goal is to propose a method that, while performing comparably to PAM50 in terms of prognostication, results in robust classification.
Our results indicate that, by independently subtyping individual samples, MPAM50 achieves our stated goal of robust subtyping. However, in some cases lack of robustness may be due to reasons other than preprocessing (subtracting a reference profile from) the samples, and thus may not be eliminated by single-sample subtyping. Specifically, a patient may be assigned 2 different subtypes even by a single-sample classifier depending on the sample preparation approach 24 or expression profiling method 25 used to obtain the expression profiles (because these factors affect the unnormalized expression values). Hence, one may wonder how MPAM50 compares to PAM50 in terms of the concordance between 2 sets of subtypes assigned using 2 sets of samples obtained from the same group of patients. Unfortunately, due to insufficient data, we were unable to directly test the performance of MPAM50 in this regard. For the only dataset (GSE54275) in our testing set that includes samples from the same patients obtained using 2 platforms, we found comparable concordances for the 2 methods (0.81 and 0.85 for MPAM50 and PAM50 respectively). This result and the overall good agreement between MPAM50- and PAM50-assigned subtypes suggest comparable performance by both methods, although more datasets are needed for drawing a definitive conclusion.
A limitation of MPAM50 is that it does not propose a gene selection algorithm (it uses the PAM50 genes). This may limit its applicability to other subtyping problems. However, the goal of this paper is not to propose a general-purpose classification algorithm. The aim is rather to propose a simple and easy-to-use method specifically for robust and accurate intrinsic subtyping of breast cancer. Our results suggest that MPAM50 is successful in achieving this goal, and thus can be helpful to breast cancer researchers.
Supplemental Material
sj-docx-1-cix-10.1177_11769351231159893 – Supplemental material for A Simple Method for Robust and Accurate Intrinsic Subtyping of Breast Cancer
Supplemental material, sj-docx-1-cix-10.1177_11769351231159893 for A Simple Method for Robust and Accurate Intrinsic Subtyping of Breast Cancer by Mehdi Hamaneh and Yi-Kuo Yu in Cancer Informatics
Footnotes
Acknowledgements
This study utilized the computational resources of the Biowulf system at the National Institutes of Health, Bethesda, MD (http://biowulf.nih.gov). The results published here are in part based upon data generated by the TCGA Research Network: ![]() .
.
Funding:
The author(s) disclosed receipt of the following financial support for the research, authorship, and/or publication of this article: This work was supported by the Intramural Research Program of the National Library of Medicine at the National Institutes of Health [grant number: ZIA LM092404].
Declaration Of Conflicting Interests:
The author(s) declared no potential conflicts of interest with respect to the research, authorship, and/or publication of this article.
Author contributions
MH and YKY designed research; MH performed research; MH and YKY analyzed the data and wrote the paper.
Supplemental material
Supplemental material for this article is available online.
References
Supplementary Material
Please find the following supplemental material available below.
For Open Access articles published under a Creative Commons License, all supplemental material carries the same license as the article it is associated with.
For non-Open Access articles published, all supplemental material carries a non-exclusive license, and permission requests for re-use of supplemental material or any part of supplemental material shall be sent directly to the copyright owner as specified in the copyright notice associated with the article.