
Abstract
Laryngeal squamous cell carcinoma (LSCC) is one of the most common types of head and neck squamous cell carcinomas (HNSCC) and is the second most prevalent malignancy occurring in the head and neck or respiratory tract, with a high incidence and mortality rate. Survival is limited for patients with LSCC. To identify more biomarkers associated with the prognosis of patients with LSCC, using bioinformatics analysis, this study used The Cancer Genome Atlas (TCGA) LSCC dataset and gene expression profiles of GSE59102 from the Gene Expression Omnibus (GEO). Eighty-one differentially co-expressed genes were identified by weighted gene co-expression network analysis (WGCNA). Next, 10 hub genes (PPL, KRT78, CRNN, PTK7, SCEL, AGRN, SPINK5, AIF1L, EMP1, and PPP1R3C) were screened from a protein-protein interaction (PPI) network. Based on survival analysis, SPINK5 was significantly correlated with survival time in LSCC patients. After verification in the TCGA and HPA databases, SPINK5 was selected as a prognostic biomarker. Finally, the GSEA results showed that downregulation of SPINK5 gene expression may promote tumorigenesis and the development of cancers by the “BASAL CELL CARCINOMA” pathway, and it has been implicated in disrupting DNA damage and repair pathways. Collectively, SPINK5 may serve as a potential prognostic biomarker in LSCC.
Keywords
Introduction
Laryngeal squamous cell carcinoma (LSCC) is one of the most common types of head and neck squamous cell carcinoma (HNSCC) in the world and arises in the larynx. 1 LSCC is the histologic subtype in greater than 90% of laryngeal cancers 2 and is the second most prevalent malignancy in the head and neck as well as the respiratory tract, with both a high incidence and mortality rate.3-5 Based on the published global cancer statistics report, more than 17 950 new cases and 3640 deaths are estimated to be confirmed in the United States in 2020. 5 Poor living habits, such as tobacco use and alcohol consumption, and human papillomavirus (HPV) infection are the primary risk factors contributing to the incidence of LSCC.6,7 HVP is by far the most widely used and studied biomarker in laryngeal papillomatosis, but maybe not in LSCC, the primary mechanisms of the pathogenesis of this cancer are still unclear.8,9 Early stage LSCC is primary treated either with surgical treatment or with radiotherapy, can often be curative, the survival advantage for patients with LSCC is limited. 10
With the rapid development of genomic technologies, it is becoming increasingly common to study the molecular and cellular mechanisms underlying the pathogenesis of diseases and to identify disease-specific biomarkers in gene expression profiles using bioinformatics. 11 Weighted Gene Co-expression Network Analysis (WGCNA) is an effective method for predicting gene functions and gene associations from genome-wide expression. 12 WGCNA can be applied to identify co-expression modules of highly correlated genes and modules of interest associated with clinical traits, 13 which provides insights for predicting the function of co-expresses genes and discovering genes that play a significant role in human disease.14,15 In addition, differential gene expression analysis is another powerful method within transcriptomics that can also provide methods for understanding molecular mechanisms in genome regulation and identifying quantitative changes in gene expression levels between experimental and control groups. 16 Such differences in gene expression can help identify potential biomarkers for a particular disease. Thus, the results of WGCNA and differential gene expression analysis were combined in 2 ways to improve the identification of highly relevant genes that could be used as candidate biomarkers.
In this study, mRNA expression data of LSCC from the TCGA and GEO databases were analyzed by WGCNA and differential gene expression analysis to identify differential co-expression genes. Through WGCNA and differential gene expression analysis, we further probed the development of LSCC by gene functional enrichment analysis and protein-protein interaction (PPI) analysis combined with survival analysis. We attempted to identify a precise gene that may serve as a novel biomarker for LSCC.
Materials and Methods
The flow diagram of the analysis hub gene extraction curation pipeline is shown in Figure 1. We elaborate on each step in the following subsections.

Flow diagram of the study.
Datasets From TCGA and GEO Database
The gene expression profiles of LSCC were downloaded from TCGA (https://portal.gdc.cancer.gov/) and GEO (https://www.ncbi.nlm.nih.gov/gds). Using the official TCGA website, we entered the Genomic Data Commons (GDC) Data Portal and selected “Larynx” as the Primary Site and “TCGA-HNSC” as the Project. Gene transcriptome data were obtained, comprising data on 111 LSCC and 12 noncancerous samples. We got the RNA-seq count data on 19 600 genes. Clinical information was also obtained from TCGA database. The Gene transcriptome data were cogenerated using the Illumina HiSeq 2000 platform and annotated into a collection of reference transcripts of the Human HG38 gene standard track. As the Edger package tutorial suggests, 17 low read count genes are usually not worthy of further analysis. Therefore, in this study, we retained genes with a cpm (count per million) ⩾1. After filtering using the RPKM function in the Edger package, the gene count was calculated by dividing the gene length, and a total of 14 556 genes with RPKM values were further analyzed.
In addition, the gene expression dataset GSE59102 was downloaded from GEO. GSE59102 consists of 4 tumor samples and 4 paired normal tissues from patients with LSCC and was researched using the GPL6480 Agilent-014850 Whole Human Genome Microarray 4x44K G4112F. According to the annotation file provided by the manufacturer, the probes were converted into human gene symbols. Duplicate probes of the same gene were removed by determining the median expression value of all corresponding probes. Ultimately, a total of 17 539 genes were selected for the next series of analyses.
Inference of Key Co-expression Gene Network Modules Using the R Package WGCNA
Network-based gene screening methods promoted by Co-expression networks can be used to identify new candidate biomarkers and candidate gene targets for therapy. In this study, we constructed the gene expression profiles of TCGA-LSCC and GSE59102 using the R software WGCNA package and built a gene co-expression network. 11 WGCNA was used to mine the highly correlated gene modules between samples and construct the modules related to the traits of external samples. To build a scale-free network, soft power β = 3 and 20 was selected using the function SoftThreshold. Next, the adjacency matrix was created using the following formula: aij =|Sij|β (aij: adjacency matrix between gene i and gene j, Sij: similarity matrix which is done by Pearson correlation of all gene pairs, b: softpower value) and was transformed into a topological overlap matrix (TOM) as well as the corresponding dissimilarity (1-TOM). Next, a hierarchical clustering tree diagram of the 1-TOM matrix was constructed to divide similar gene expression patterns into different gene co-expression modules. To further survey the functional modules in the co-expression network, we calculated the module-trait association between the modules and analyzed the modules with clinical trait information.
Identification of DEGs and Their Interaction With Modules of Interest
An integrated solution for RNA sequencing and differential expression analysis of microarray data was provided using the R package limma (linear models for microarray data). 18 To explore the differentially expressed genes (DEGs) between LSCC and normal tissues, we applied limma to TCGA-LSCC and GSE59102 datasets to screen for differentially expressed genes (DEGs). The P-values were then adjusted for FDR using the BH method. Genes with |logFC| ⩾ 1.0 and adj. P < .05 were identified as DEGs. The DEGs of the TCGA-LSCC and GSE59102 datasets are presented as volcano plots, which were generated using the ggplot2 package in R x64 v4.0.2. 19 Subsequently, overlapping genes between DEGs and co-expression genes extracted from the co-expression network were used to identify potential prognostic genes and are shown in a Venn diagram using the R package VennDiagrams. 20
Functional Annotation and Enrichment Analysis for Genes of Interest
To determine the Gene Ontology (GO) function of the selected genes, GO enrichment analysis was performed on genes of interest using the R package cluster Profiler, 21 with a P-value-adjusted (Padj) <.05. The GO annotation system was classified into 3 categories: biological process (BP), cellular component (CC), and molecular function (MF), which can identify the biological characteristics of genes and gene sets. 22
PPI Network and Identification of Hub Genes
In this study, to construct a PPI network of selected genes, protein-protein interactions (PPIs) were assessed using the STRING tool. 23 The STRING database was used to select genes with scores ⩾0.150 to construct the network model visualized using Cytoscape (v3.9.0). 24 The maximum cluster centrality (MCC) algorithm is considered the most effective method for identifying hub nodes in a co-expression network. 24 We utilized CytoHubba, a plugin software of Cytoscape, to calculate the maximal clique centrality (MCC) in every protein node. 25 In this study, the top 10 genes with MCC values were considered pivotal genes.
Survival Analysis
Clinical information on patients with LSCC was also obtained from TCGA. After excluding patients with no overall survival (OS) data and the DEGs expression profiles of the noncancerous samples, 111 LSCC patients were included for survival analysis. Univariate Cox proportional hazards regression analysis and multivariate Cox proportional hazards regression analysis were applied to identify candidate genes that were strongly correlated with survival from the 10 hub genes. The survival-related candidate genes with log-rank P-values <.05 were considered statistically significant.
Verification of the Expression Patterns, the Prognostic Values and Protein Expression of Prognosis-Related Genes
To support the reliability of the prognosis-related genes that were identified, mRNA expression of the prognosis-related genes in tumors and normal tissues was compared in the TCGA dataset. Next, box plots were generated to compare prognosis-related gene expression levels between tumor and nontumor tissues. Based on the data from the TCGA database, Kaplan–Meyer analysis and the log–rank test, the optimal cut-off of SPINK5 was performed to explore the relationship between OS and prognosis-related genes in patients. LSCC belongs to HNSCC, therefore, the immunohistochemical (IHC) of HNSCC in the Human Protein Atlas database (HPA, https://www.proteinatlas.org/) was used to detect the protein expression of survival-related genes between LSCC and normal tissues. The HPA database provides researchers with a large amount of transcriptome and proteomics data on specific human tissues and cells. 26 In addition, IHC-based protein expression profiles are the most commonly used immunostaining method for detecting the relative position and abundance of proteins. 27
GSEA Identifies Signaling Pathways of Prognosis-Related Genes in LSCC
To explore the cancer-related pathways associated with the prognosis-related gene expression levels in LSCC, 111 patients with LSCC, whose data were downloaded from TCGA, were divided into high and low prognosis-related gene expression groups according to the median expression value of the prognosis-related genes. GSEA was used to examine the highest-ranked gene-enrichment pathways in both groups. 28 For each analysis, the number of permutations in the gene collection was set to 1000. Nominal (NOM) P-values, false discovery rate (FDR), and normalized enrichment score (NES) were used to identify enrichment pathways in each phenotype.
Results
Characteristics of the study population
The TCGA database contained a total of 123 laryngeal samples, including 12 noncancerous samples and 111 LSCC samples with clinical and gene expression data. The clinical characteristics of 111 LSCC patients, including patients’ age, gender, and race as well as histological type, histologic grade, clinical stage, TNM classification, therapy were shown in Table 1.
The clinical characteristics of 111 LSCC patients from the TCGA database.

Abbreviations: LSCC, laryngeal squamous cell carcinoma; Other, American Indian or Alaska native/Asian.
Construction of weighted gene co-expression network modules
In this study, 16 modules were identified by the TCGA-LSCC (Figure 2A) consensus, and 21 modules were identified by the GSE59102 (Figure 3A) consensus using the WGCNA package, each color represents a module. Next, module-trait relationship heat maps were drawn to assess the association between each module and 2 clinical features (cancer and normal). The results of the module-trait relationships are shown in Figures 2B and 3B, demonstrating that the blue module in TCGA-LSCC and the red module in GSE59102 had the highest association with normal tissues (blue module: r = .8, P = 4e−29; red module: r = .6, P = 3e−05), while the cyan module in TCGA-LSCC and the blue module in GSE59102 had the highest association with tumor tissues (cyan module: r = .39, P = 1e−05; blue module: r = .88, P = 2e−14).
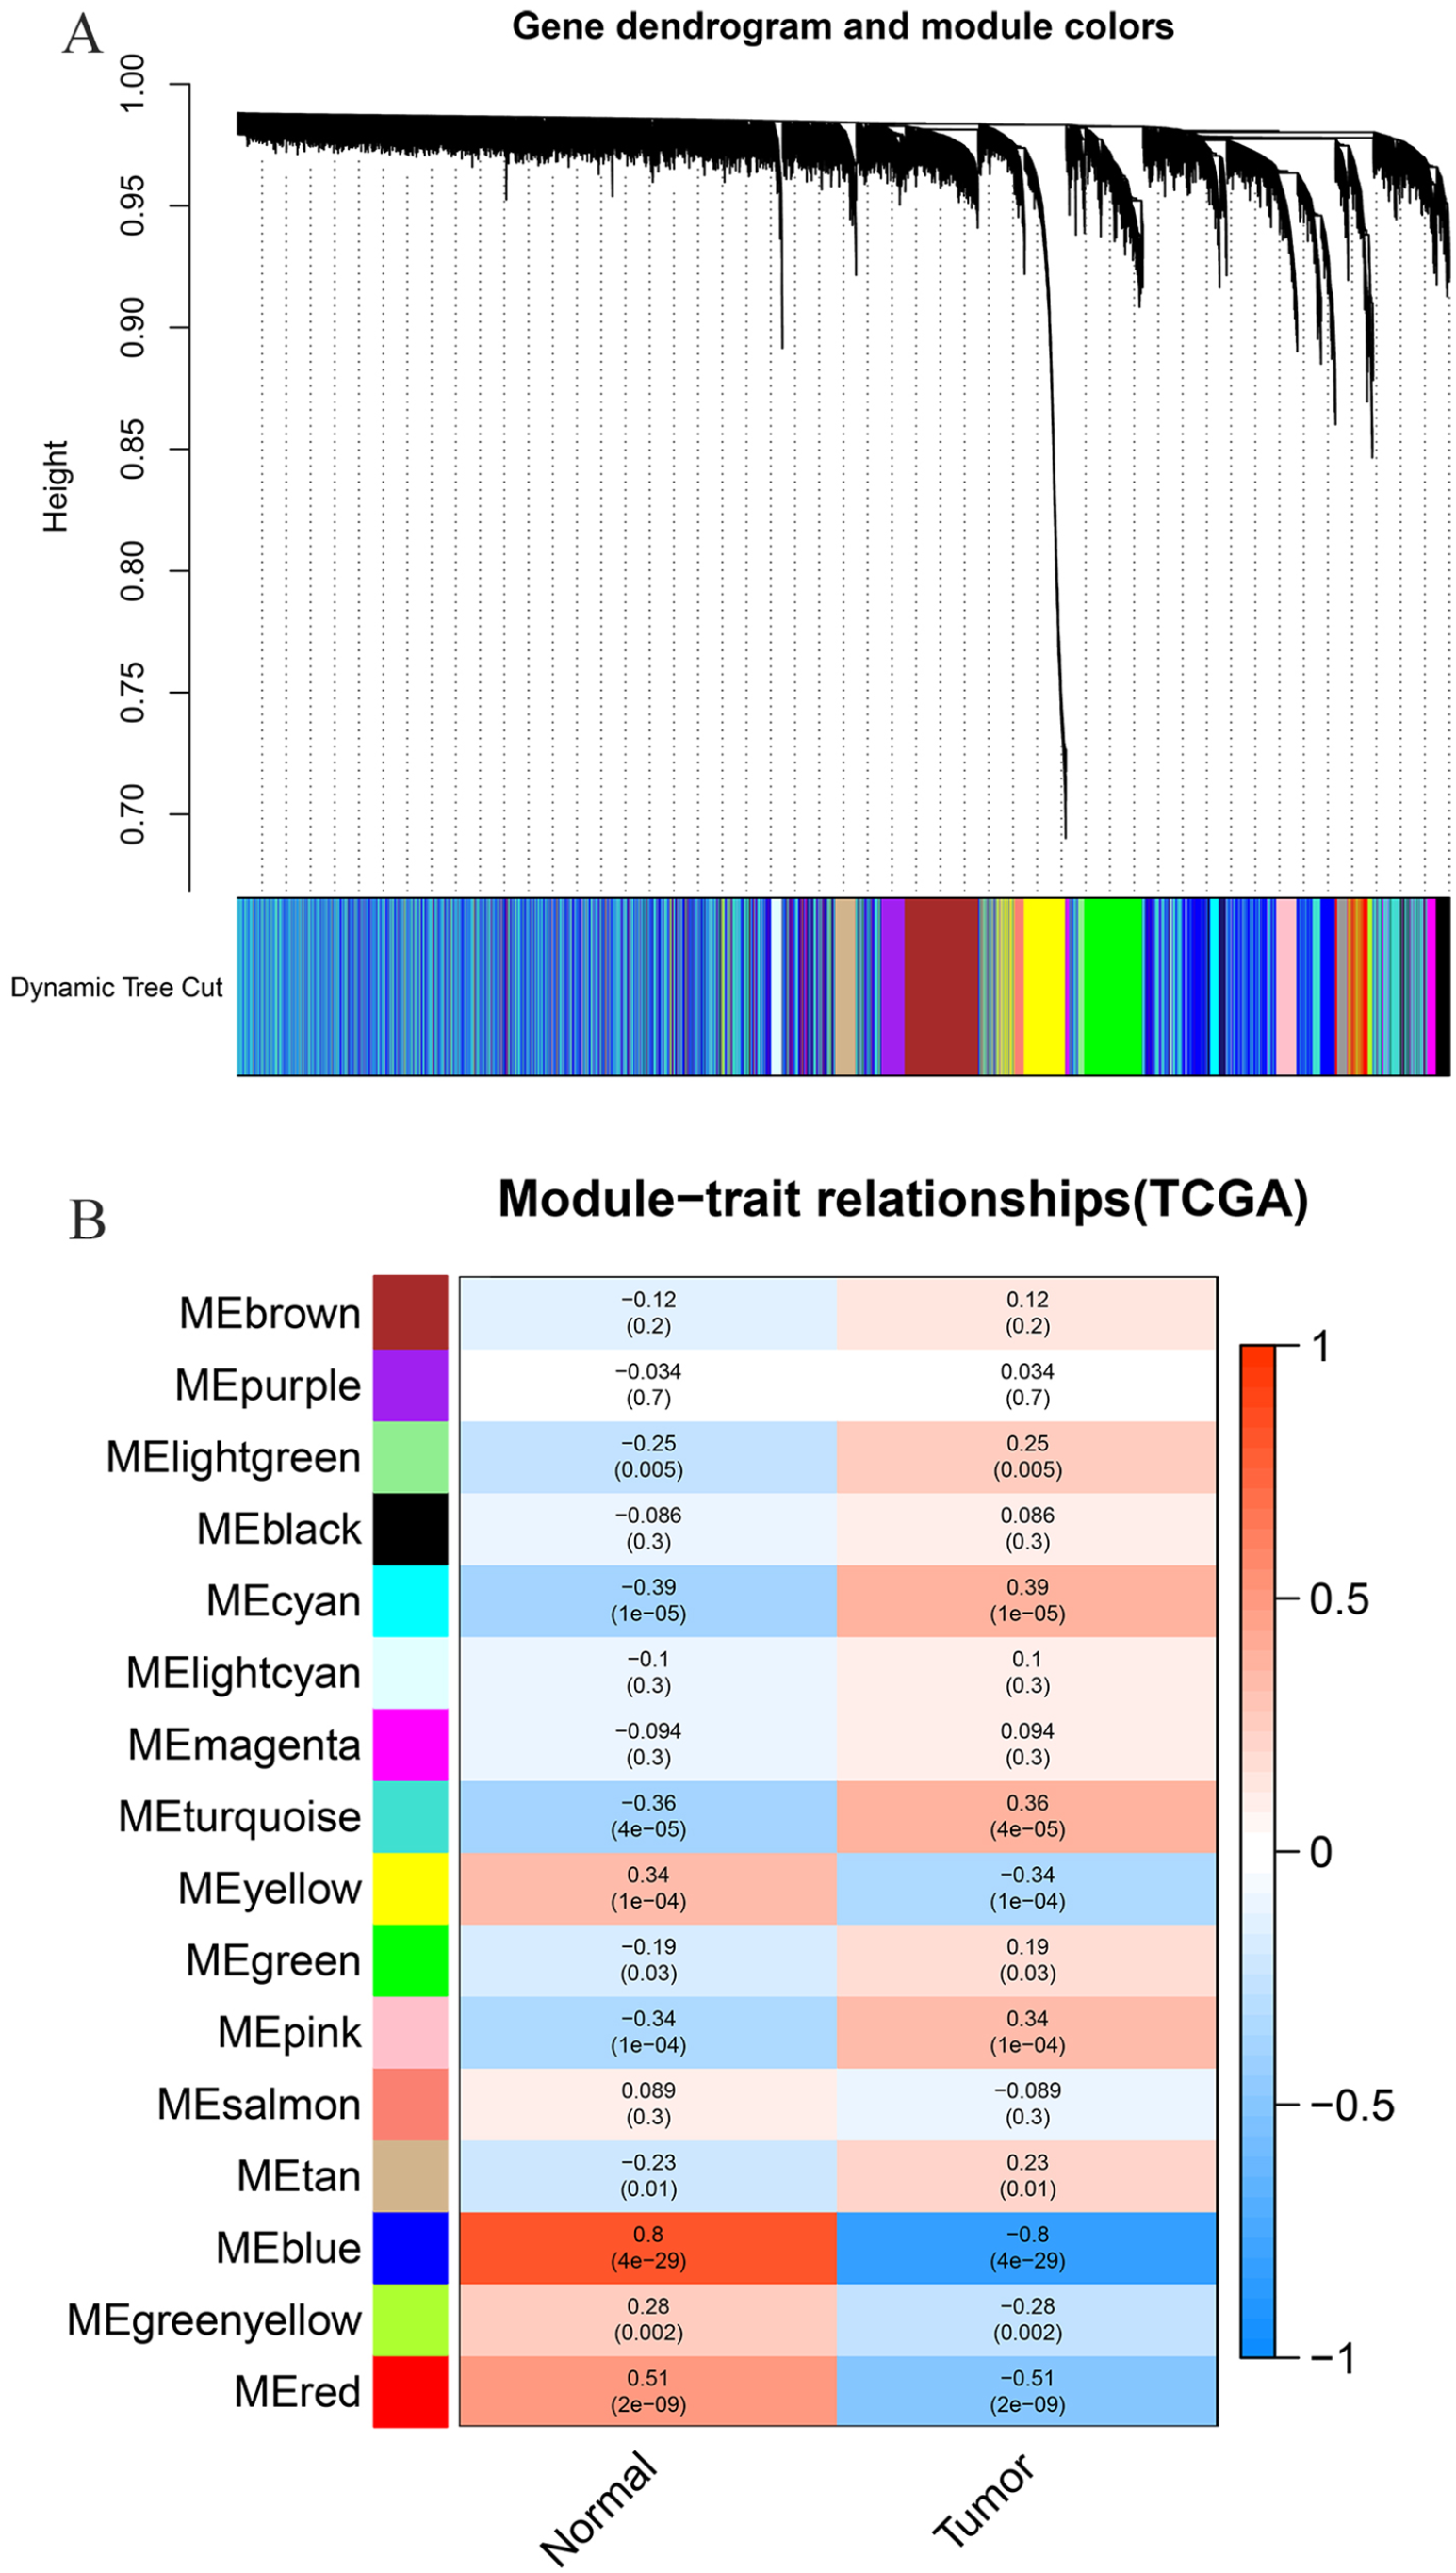
Co-expression analysis for the clinical information in the TCGA-LSCC database: (A) differentially expressed genes were clustered into different colors modules and (B) correlation between modules and clinical trait according to Pearson correlation.
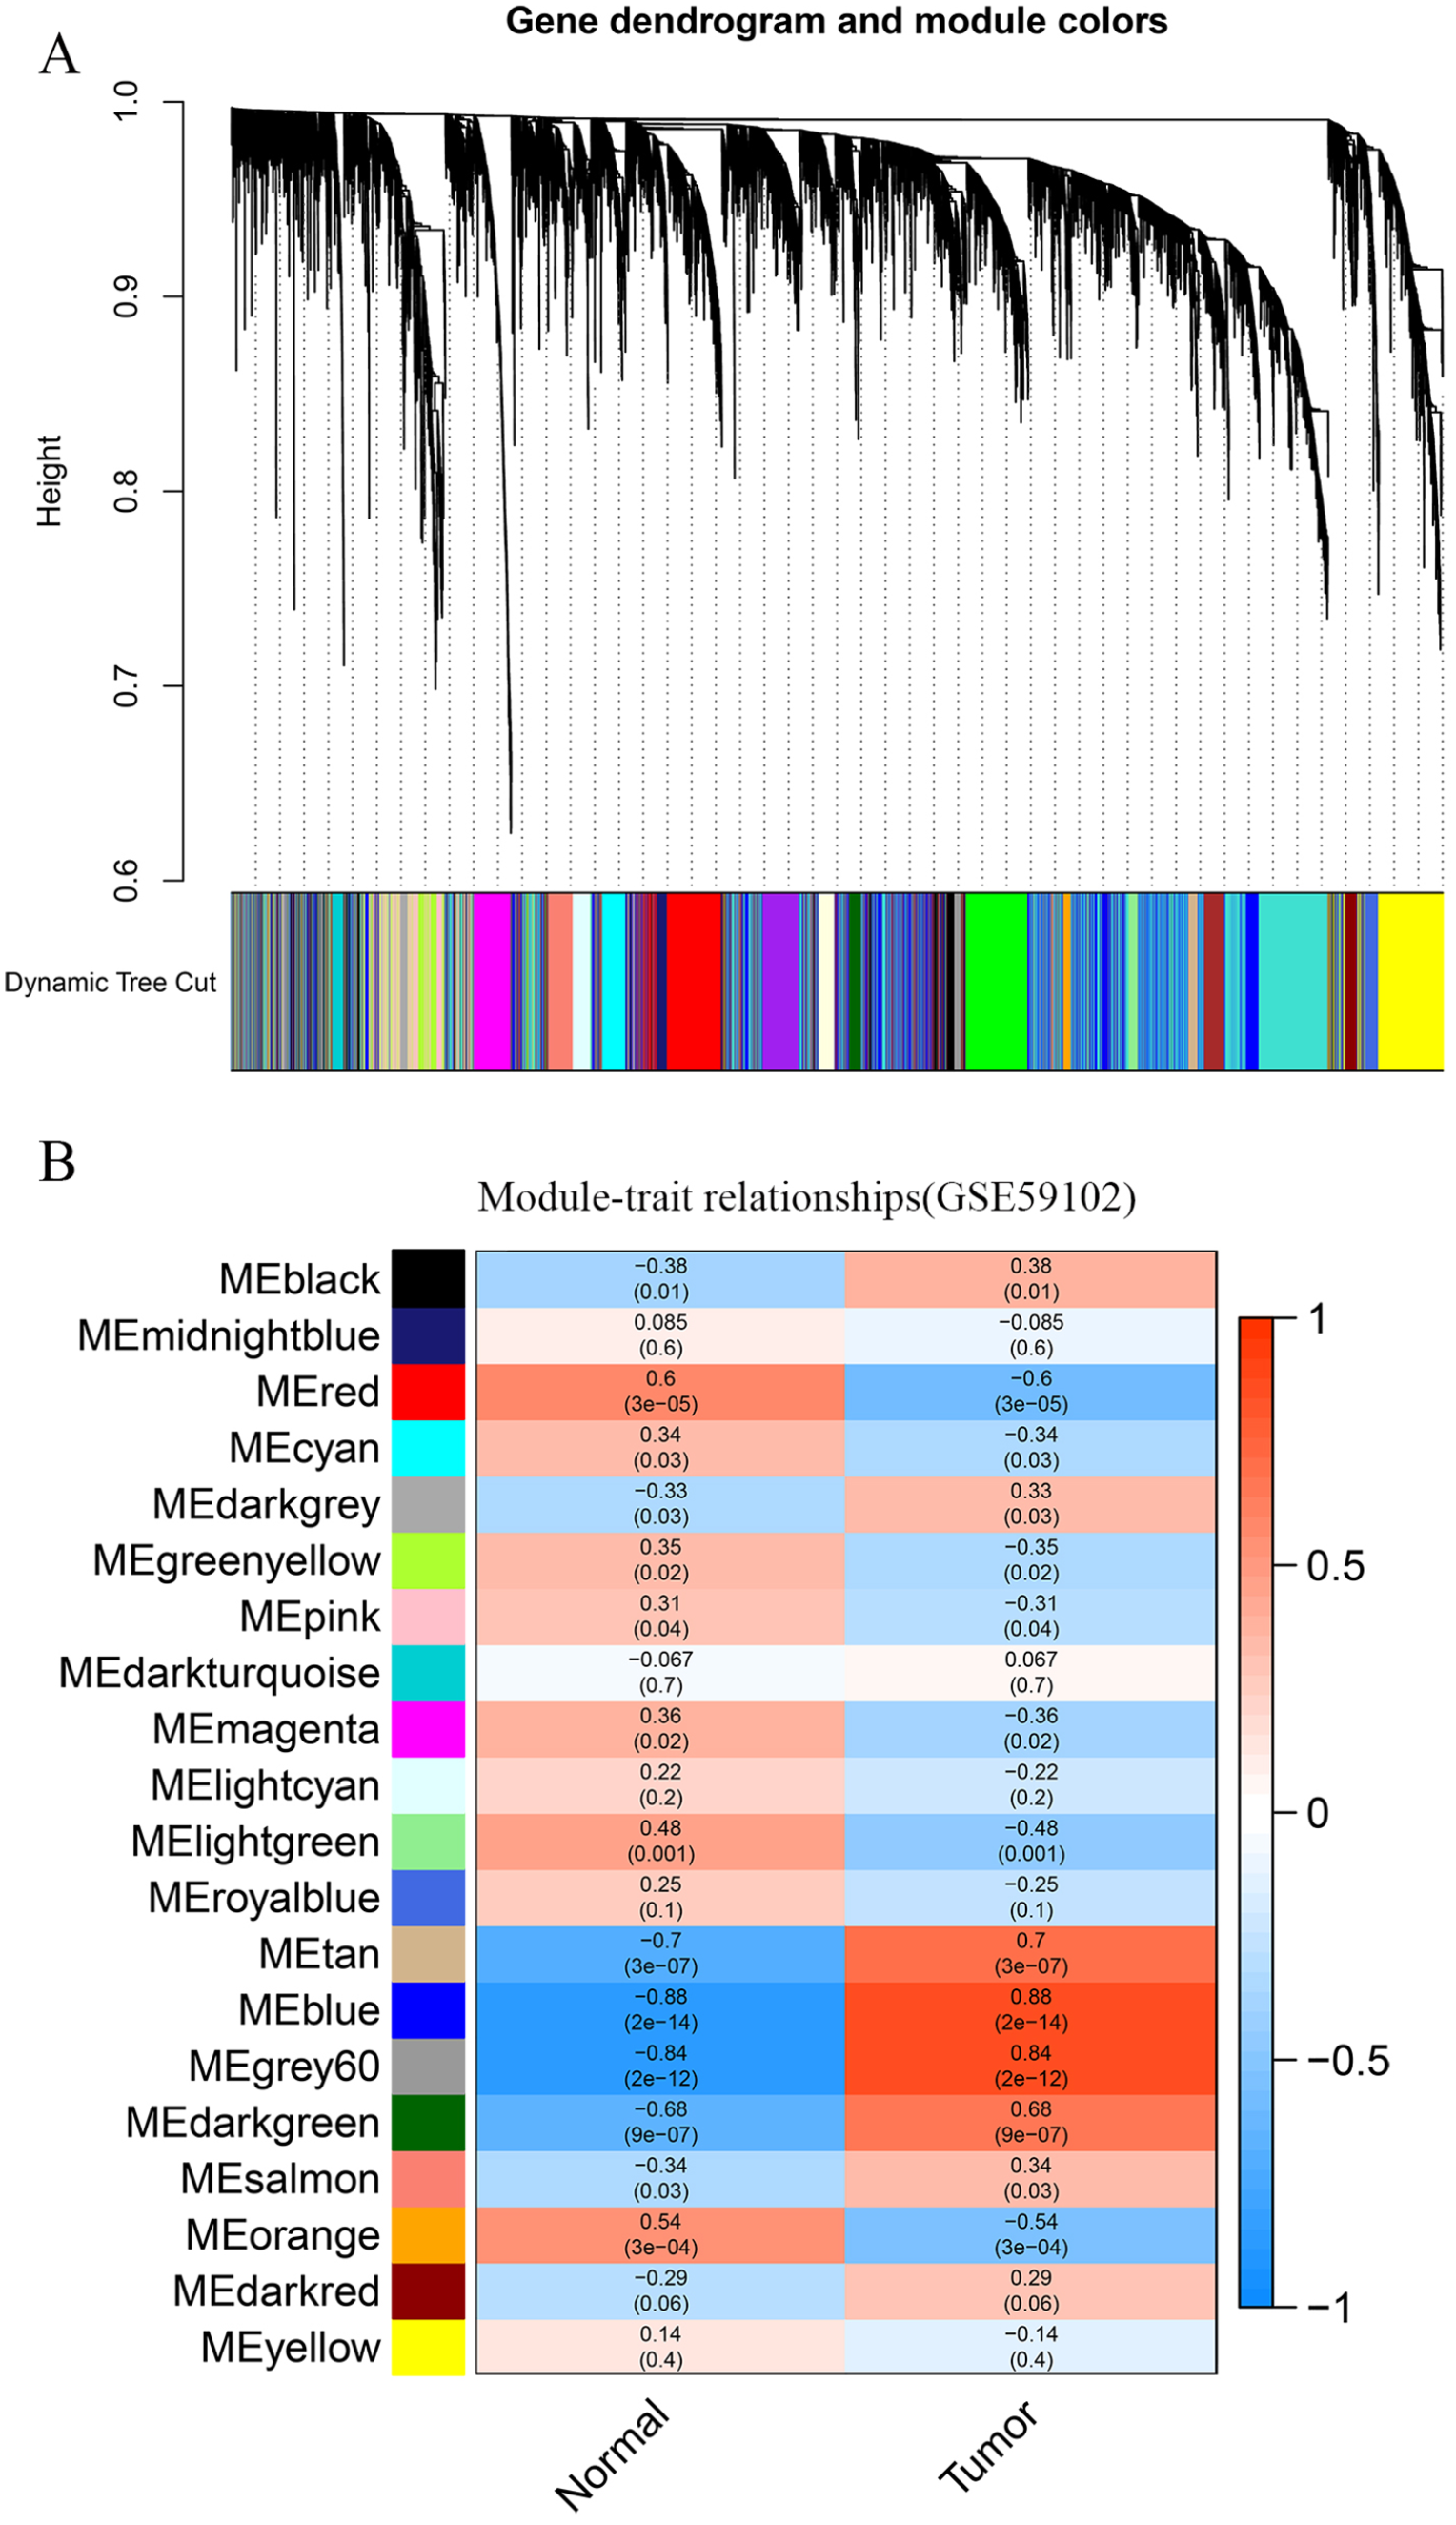
Co-expression analysis for the clinical information in the GSE59102 dataset: (A) differentially expressed genes were clustered into different colors modules and (B) correlation between modules and clinical trait according to Pearson correlation.
Identification of genes in the DEG lists and co-expression modules
Based on the cut-off criteria of |logFC| ⩾1.0 and adj. P < .05, there were 2774 DEGs in the TCGA dataset (Figure 4A) and 2759 DEGs in the GSE59102 dataset (Figure 4B) that were abnormally regulated according to limma encapsulation in tumor tissues. As shown in Figure 4C, 3910 and 666 negatively correlated co-expression genes were observed in the blue module of TCGA dataset and the red module of GSE59102, and 73 overlapping genes were extracted to verify the genes of the negatively correlated co-expression modules (Figure 4C). As shown in Figure 4D, 258 and 4536 positively correlated co-expression genes were identified in the cyan module of TCGA data set and the blue module of GSE59102, respectively. Eight overlapping genes were extracted to verify the genes of positively correlated co-expression modules (Figure 4D). A total of 81 genes were extracted to verify genes of the co-expression module.

Identification of DEGs among the TCGA and GSE59102 database of LSCC: (A) the volcano plot of DEGs in the TCGA database, (B) the volcano plot of DEGs in the GSE59102 dataset, (C) the Venn diagram of genes among DEGs lists and the negatively correlated co-expression module. In total, 73 overlapping genes in the intersection of DEGs lists and negatively correlated co-expression modules. (D) The Venn diagram of genes among DEGs lists and the positively correlated co-expression module. In total, 8 overlapping genes in the intersection of DEGs lists and positively correlated co-expression modules.
Functional annotation and enrichment analysis for the 81 genes
To better understand the potential function of 81 genes that overlap with the DEG list and these co-expression modules, gene ontology (GO) enrichment analysis was performed using the software package ClusterProfiler. After GO enrichment analysis and screening, the enriched gene sets are indicated in Figure 5. The biological processes (BPs) of 81 genes were primarily enriched during epidermal development and eicosane metabolism. The results of cell component (CC) studies showed that these genes were primarily involved in extracellular components, focal adhesion, and cell-substrate junctions. In addition, molecular function (MF) analysis showed that these 81 genes were related to peptidase regulatory activity and phosphatidylserine binding.

Functional Annotation and Enrichment analysis for the 81 Genes. The color represents the adjusted P-values (BH), and the size of the spots represents the gene number.
PPI network construction and identification of hub genes
The STRING database was used to establish the PPI network among overlapping genes, with a total of 74 nodes and 157 edges (Figure 6A). The hub genes in the PPI network chosen based on the MCC algorithm using the cytoHubba app are shown in Figure 6B. According to the MCC sores, the top 10 highest-scoring genes, including Keratin 78 (KRT78), Sciellin (SCEL), Cornulin (CRNN), Serine peptidase inhibitor Kazal type 5 (SPINK5), Periplakin (PPL), Serpin family B member 13 (SERPINB13), Alpha-2-macroglobulin like 1 (A2ML1), Protein tyrosine kinase 7 (PTK7), Agrin (AGRN), and Allograft inflammatory factor 1 like (AIF1L), were selected as hub genes.

Protein-protein interaction (PPI) network and the candidate hub genes: (A) PPI network of the relevant genes and (B) identification of the hub genes from the PPI network.
Survival analysis
Findings for univariate and multivariate Cox regression analysis of pivotal genes for the OS in LSCC patients in the TCGA cohort are presented in Table 2. We found that SPINK5 was significantly correlated with survival time in LSCC patients (P < .05). Among these 10 genes, SPINK5 with HR < 1 was identified as a protective prognostic gene, so SPINK5 may represent a prognostic biomarker in LSCC.
Prognostic value of the 10 genes in the LSCC patients of the TCGA cohort.

Verification of the expression patterns, the prognostic values and protein expression of prognosis-related genes
We assessed the expression levels of prognosis-related genes based on the TCGA database and found that the SPINK5 gene was significantly downregulated in LSCC compared to normal tissues, as shown in Figure 7A and B. In addition, Kaplan–Meyer analysis and the log–rank test, the optimal cut-off of SPINK5 showed the lower expression level of SPINK5 was significantly associated with worse OS of the LSCC patients (P < .05), as shown in Figure 7C. Taking a further step, protein expression of the SPINK5 gene between HNSCC and normal tissues was determined to indirectly verify the protein expression between LSCC and normal tissues. According to the HPA database, the protein levels of the SPINK5 gene were significantly lower in tumor tissues than in normal tissues, as shown in Figure 8A and B. The above observations all confirmed that downregulation of SPINK5 expression is associated with poor prognosis and reduced OS in LSCC patients.
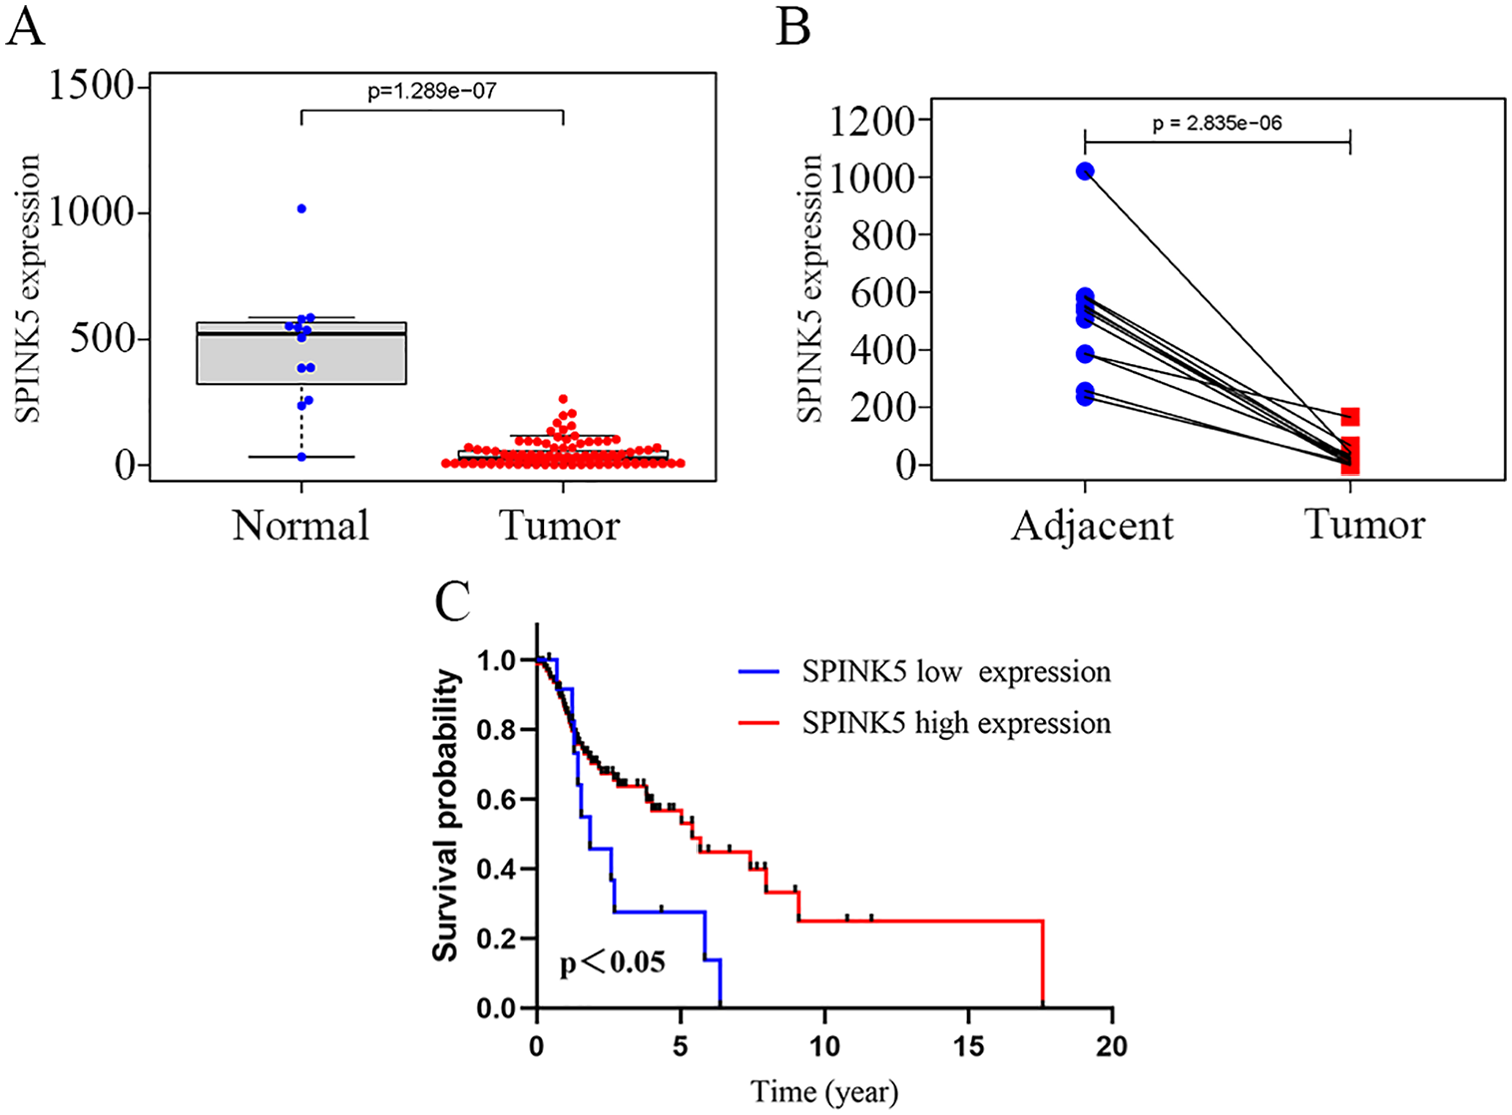
The expression level of SPINK5 is downregulated in Laryngeal squamous cell carcinoma (LSCC): (A) SPINK5 mRNA levels in LSCC tissues and normal larynx tissues in TCGA, (B) SPINK5 mRNA levels in LSCC tissues and matched normal tissues in the TCGA, and (C) Kaplan-Meier curves for LSCC according to the optimal cut-off of SPINK5 (P < .05).

Immunohistochemistry of the SPINK5 gene in HNSCC and normal tissues from the human protein atlas (HPA) database: (A) protein levels of SPINK5 in HNSCC tissues and (B) protein levels of SPINK5 in normal oral mucosa tissues.
GSEA identifies signaling pathways of prognosis-related genes in LSCC
To explore the potential molecular function of SPINK5 in laryngeal squamous cell carcinoma, we conducted GSEA between samples with low and high SPINK5 expression to predict SPINK5-related signaling pathways. A total of 108 out of 178 signaling pathways were upregulated, and 4 signaling pathways were significantly enriched at NOM P < .05 and FDR < 0.1 (Table 3). The significantly upregulated term enriched in the low SPINK5 group involved in tumorigenesis was “BASAL CELL CARCINOMA,” whereas the associated terms involved in DNA damage and repair included “DNA replication,” “mismatch repair,” and “homologous recombination.” A summary of the enrichment results is shown in Figure 9.
GSEA pathways upregulated due to low expression of SPINK5.

Abbreviations: FDR, false discovery rate; NES, normalized enrichment score; NOM, nominal.
Gene sets with NOM P-value <.05 and FDR q-value <.1 are considered as significant.

GSEA pathways enriched in samples with low SPINK5 expression: (A) homologous recombination, (B) DNA replication, (C) mismatch repair, and (D) BASAL CELL CARCINOMA.
Discussion
In the past 20 years, with the emergence of individualized precision therapy, including radical resection, radiotherapy and chemotherapy, alone or in combination, the prognosis of LSCC patients has improved; however, LSCC has not shown an increase in the overall or long-term survival rates and is among the most frequent malignant tumors in the world.29,30 Effective diagnostic and prognostic biomarkers for identifying early-stage LSCC patients are urgently needed to develop valid treatments and improve the poor prognosis.
In this study, GSE59102 was selected from the GEO database, and the gene expression profile of LSCC was downloaded from TCGA. By integrating bioinformatics analysis, we identified 81 significant genes with the same expression trend in both TCGA and GSE59102 databases. We also analyzed GO functions using the software package ClusterProfiler, and these genes were primarily concentrated in epidermal development and eicosane metabolism. Furthermore, we screened the top 10 LSCC-related genes according to MCC scores from the CytoHubba plugin in Cytoscape. They are keratin 78 (KRT78), sciellin (SCEL), cornulin (CRNN), serine peptidase inhibitor Kazal type 5 (SPINK5), periplakin (PPL), serpin family B member 13 (SERPINB13), alpha-2-macroglobulin like 1 (A2ML1), protein tyrosine kinase 7 (PTK7), agrin (AGRN), and allograft inflammatory factor 1 like (AIF1L). Next, the survival analysis based on TCGA databases revealed that SPINK5 was significantly correlated with survival time in LSCC patients, lower SPINK5 expression is associated with poor prognosis. and they acted as protective prognostic genes. Finally, the expression patterns and immunohistochemical analysis of SPINK5 were examined. These results suggest that SPINK5 may serve as a protective factor or tumor suppressor and inhibit LSCC carcinogenesis.
The serine protease inhibitor Kazal type (SPINK) family is a branch of the serine protease inhibitor family. 31 SPINK5, serine peptidase inhibitor Kazal type 5, also known as lympho-epithelial Kazal-type-related inhibitor, is a member of the serine protease inhibitor Kazal type family, is located in the 5q32 region of the chromosome and contains 15 potential inhibitory domains. 32 Previous research has shown that SPINK5 is related to Netherton syndrome (NS) and may have an active biological role in blood coagulation.33,34 Later research began to focus on the relationship between SPINK5 and the biological behavior of tumors. It was reported earlier that, SPINK5 was downregulated by 9.7-fold in 22 head and neck squamous cell carcinoma tissues compared to the paired adjacent normal tissues, 35 Subsequent study by the same team demonstrated the downregulated SPINK5 promoted HNSCC cells proliferation, colony formation and invasion. 36 In addition, LEKTI, a large protein encoded by SPINK5 gene, was revealed to be reduced in oral squamous cell carcinoma, with increased KLK5/SPINK5 mRNA ratio being related to a shorter OS. 37 Subsequently, several lines of reports focused on its relationship with other types of tumors derived from other anatomical sites. Wang et al, 38 revealed that SPINK5 was downregulated in esophageal cancer compared to adjacent control tissues, and SPINK5 may be involved in the development of esophageal cancer as a tumor suppressor gene. However, there are no relevant reports about the relationship between SPINK5 and LSCC, the potential role of SPINK5 in LSCC. In our research, we found that SPINK5 was downregulated in tumor tissues compared to normal tissues, showing a significant correlation with LSCC, and these findings should be investigated in-depth in LSCC in the future.
The occurrence and development of malignant tumors is strongly associated with activation of tumor suppressor pathways and/or suppression of oncogenic pathways. 39 During the process of tumor development, activation of the Wnt/β-catenin signaling pathway involves the degradation of β-catenin and the transcription of target genes, such as c-myc and cyclin D1, which regulate cell proliferation, survival, and cell migration. 40 There is experimental evidence that SPINK5 inhibits the Wnt/β-catenin signaling pathway to inhibit the proliferation, migration, invasion and metastasis of esophageal cancer cells in cell cultures as well as in laboratory animals. 38 According to the experimental results of Wang et al, it was found that higher SPINK5 expression could repress EMT and cisplatin resistance in nasopharyngeal carcinoma cells. 41 However, only SPINK5 has been assessed thus far, and little is known about which pathways primarily control tumor cell invasion in LSCC. To explore the underlying molecular functions and mechanisms of SPINK5 in laryngeal squamous cell carcinoma, we performed GSEA in LSCC for SPINK5. The results showed that SPINK5 is correlated with the tumorigenesis pathways “BASAL CELL CARCINOMA” and the DNA damage and repair pathways. In our study, low expression of SPINK5 predicted worse outcomes and poor survival in LSCC patients. It is possible that SPINK5 plays a role in LSCC by affecting these signaling pathways, contributing to a poor prognosis in LSCC patients. Although there were notable discoveries in this study, we recognize that our work also has several limitations. First, although we found that protein expression of the SPINK5 gene was lowly expressed in in tumor tissue in the HPA database in which most patients in the United States were White, Hispanic or Black, we did not include Asian in our analysis, so the expression of the SPINK5 gene between LSCC and normal tissues in Asian populations could be a future direction for a subsequent study. Second, although we found a candidate gene, SPINK5 using bioinformatics analyses, the knockdown or overexpression system to model the functional impact of SPINK5 in cell and animal experiments have not yet been implemented. Thus, the base-added experiment to elucidate the biological functions and pathological importance of SPINK5 in LSCC is the main focuses of our future work.
Conclusion
In summary, based on the results of a series of bioinformatics analyses, our study demonstrated that SPINK5 may represent a very useful biomarker that has potential for prognosis prediction in LSCC. Patients with downregulated SPINK5 expression levels had a poor prognosis with respect to OS. The underlying molecular mechanisms may affect malignant transformation and tumorigenesis. Our study provides a valuable basis for future detection of the role of SPINK5 in LSCC.
Footnotes
Acknowledgements
We want to thank TCGA, GEO, and HPA for free access of their database.
Funding:
The author(s) disclosed receipt of the following financial support for the research, authorship, and/or publication of this article: This work was supported by the Discipline Lead Training Program of Health Commission, Qingpu District, Shanghai, P. R. China [WD2019-13].
Declaration Of Conflicting Interests:
The author(s) declared no potential conflicts of interest with respect to the research, authorship, and/or publication of this article.
Authors’ Contributions
Conception and design: Jian Liu and Jing Zhao. Administrative support: Guangping Bai and Zhiqiang Guo. Provision of study materials: Qing Sun and Xuemei Qin. Collection and assembly of data: Jiaran Xu and Guohui Chen. Data analysis and interpretation: Tianle Gao. Manuscript writing: All authors. Final approval of manuscript: All authors.
Availability of Data and Materials
The dataset analyzed in this study is available in GEO database with accession number of GSE59102 and TCGA database.