
Abstract
Protein-protein interactions (PPIs) in plants are essential for understanding the regulation of biological processes. Although high-throughput technologies have been widely used to identify PPIs, they are usually laborious, expensive, and suffer from high false-positive rates. Therefore, it is imperative to develop novel computational approaches as a supplement tool to detect PPIs in plants. In this work, we presented a method, namely DST-RoF, to identify PPIs in plants by combining an ensemble learning classifier-Rotation Forest (RoF) with discrete sine transformation (DST). Specifically, plant protein sequence is firstly converted into Position-Specific Scoring Matrix (PSSM). Then, the discrete sine transformation was employed to extract effective features for obtaining the evolutionary information of proteins. Finally, these optimal features were fed into the RoF classifier for training and prediction. When performed on the plant datasets Arabidopsis, Rice, and Maize, DST-RoF yielded high prediction accuracy of 82.95%, 88.82%, and 93.70%, respectively. To further evaluate the prediction ability of our approach, we compared it with 4 state-of-the-art classifiers and 3 different feature extraction methods. Comprehensive experimental results anticipated that our method is feasible and robust for predicting potential plant-protein interacted pairs.
Keywords
Introduction
Protein-protein interactions (PPIs) in plants are an important aspect of systems biology. 1 It is very important for the investigation of biological processes, including signal transduction, 2 homeostasis control, 3 stress responses, 4 and plant defense. 5 Many traditional biological methods have been presented for exploring the functions and relationships between plant genes and proteins, such as yeast 2-hybrid system,6,7 PPIs mapping, 8 tandem affinity purification (TAP), 9 and regulatory interaction. 10 However, these experimental approaches are time-consuming and cost a lot, and the plant PPI pairs collected from experiments only cover a small part of the Genome-wide protein interaction data. Due to this limitation, it is now believed that the problem of identifying unknown PPIs on a large scale is difficult to be solved entirely by traditional experimental methods.11-13
In recent years, various computational approaches have been developed to detect protein-protein interactions in plants.14-17 These approaches can broadly fall into several categories: methods based on protein structure, protein domain, genomic information, evolutionary relationships, and protein primary sequence. Generally, the first 4 methods have a higher prediction accuracy. However, these approaches always require the structural details of proteins, such as 3D structural details. When the prior knowledge is not available, their drawbacks will be exposed. Theoretically, the amino acid sequence of proteins contains all the necessary information for identifying PPIs. In addition, with the development of sequencing technologies, more sequences information has been discovered. Therefore, sequence-based methods have attracted extensive attention. 18
To date, numerous computational studies have been reported to predict PPIs from amino acid sequences. For example, Chen et al 19 developed a predictive framework named StackPPI. It is a stacked ensemble classifier constructed by extremely randomized trees, random forest, and logistic regression algorithms. Li et al 20 proposed an approach to predict PPIs only using sequence information. They converted sequences into Position Weight Matrix (PWM) and used Scale-Invariant Feature Transform (SIFT) method to extract features. Then PCA algorithm is employed to reduce the dimensionality of features. Finally, using the Weighted Extreme Learning Machine (WELM) classifier to detect PPIs. Khorsand et al 21 extracted several features from protein sequences and combined them with the human PPI network (HPPIN) to detect PPIs between Alphainfluenzavirus proteins and human proteins (HI-PPIs). Hashemifar et al 22 introduced a new framework called DPPI. It utilized a deep, Siamese-like convolutional neural network combined with data augmentation and random projection to identify PPIs from sequence information. Zhang et al 23 present a neural network-based method named EnsDNN, which used local descriptor, autocovariance descriptor, discontinuous local descriptor, and multi-scale continuous to represent amino acid sequence and detect PPIs. Kulmanov et al 24 presented an approach named DeepGO, which employed a deep ontology-aware classifier to predict protein functions and interactions from protein sequence. Sun et al 25 used stacked autoencoder (SAE) to predict PPIs. Ding et al 26 employed a new multivariate mutual information (MMI) feature representation scheme and combined it with normalized Moreau-Broto Autocorrelation to extract features from protein sequence. Lastly, these features will be fed to Random Forest for training and predicting. Hu and Chan 27 present a novel coevolutionary feature extraction method, called CoFex, to predict PPIs. The coevolutionary features detect by this method are the covariations found at coevolving positions. Despite these achievements, there remains significant room for further improvement in terms of accuracy.
In this article, we present a novel computational model, called DST-RoF, to predict PPIs in plants that only adopting protein sequences information. It combined discrete sine transformation (DST), position-specific scoring matrix (PSSM), and rotation forest (RoF) classifier. More specifically, we first converted the protein primary sequences into PSSM to obtain the biological information. Then, the discrete sine transformation (DST) was performed on PSSM to extract primary features of different dimensions. Finally, these feature vectors were trained by the RoF classifier for prediction. When performed DST-RoF on the Arabidopsis, Rice, and Maize PPIs datasets, it yielded promising results of average accuracy of 82.95%, 88.82%, and 93.70%, respectively. To further verify the prediction performance of our approach, we compared DST with some popular feature extraction methods. We also compared RoF with k-nearest neighbor (KNN), support vector machine (SVM), deep neural network (DNN), and LightGBM classifier by using the same DST descriptors. The comprehensive results indicated that DST-RoF is effective and reliable for predicting potential PPIs in plants.
Materials and Methods
Data source
To evaluate the predictive ability of our method, we applied our method on 3 plant PPIs datasets. The first dataset is Arabidopsis. We collected it from public PPIs databases TAIR, 28 BioGRID, 29 and IntAct. 30 After removing redundant datasets, we selected the remaining 28 110 protein pairs as the positive dataset, which contained 7437 Arabidopsis proteins. 31 For the construction of the negative dataset, we used a bipartite graph to formulate a network of plant PPIs, 32 where the nodes denote the plants’ proteins, and the links represent the interactions between them. Here, we set the Arabidopsis dataset as an example. The whole interactions of their connections are 55 308 969 (7437 × 7437) in the corresponding bipartite. However, only 28 110 protein pairs had been indicated to have the associations. Thus, the possible number of negative pairs is 55 280 859 (55 308 969-28 110), which is significantly more than the positive samples. To deal with this bias problem, we randomly collectedly 28 110 non-interacting PPIs pairs as the negative samples. Although in theory, these negative samples may contain a small count of positive pairs. However, given the size of whole PPIs dataset, the probability of this situation is very small. In this way, the whole Arabidopsis dataset is made up of 56 220 protein pairs.
Rice and maize are the 2 most important foods in the world. 33 To further validate the generality of the proposed approach, we also performed DST-RoF on the Rice and Maize dataset. We collected the 4800 Rice protein pairs from the rice protein reference database PRIN 34 and agriGO. 35 Similarly, we assumed that the proteins in different subcellular work compartments have no interactions, and finally yielded 4800 non-interacting protein pairs. Lastly, the Rice dataset consists of 9600 rice protein pairs. The Maize dataset was gathered from PPIM. 36 The whole Maize dataset consists of 29 600 maize protein pairs (14 800 positive protein pairs and 14 800 negative protein pairs).
Representation of plant protein sequence
The position-specific scoring matrix (PSSM)
37
was developed for detecting distantly related proteins. In this work, we employed PSSM to encode the plant protein sequences. Let

where
In our experiment, we used the PSI-BLAST
38
to convert the Arabidopsis, Rice, and Maize sequence as a matrix. The PSI-BLAST is an accurate tool, which was against the database of SwissProt to generate the PSSM. To obtain a highly and widely homologous sequence, we select 3 iterations and assigned the e-value of PSI-BLAST to be 0.001. Finally, each plant protein sequence can be represented as a
Feature extraction method
Discrete Sine Transformation (DST)
39
is a kind of sinusoidal unitary and separable Transform. It plays a key role in the field of signal and image processing, not only because of its transforming coding capabilities but also for some other applications, including adaptive beamforming, signal interpolation, and image resizing.
40
As it is a separable transform, the 2D-DST can be constructed by two 1D-DST. The first 1D-DST is applied column-wise and the obtaining results will be adopted as the input for the second 1D-DST, which is then calculated by row-wise. The most common DST definitions for 1D sequence of length

for

for

Thus, the 2D-DST can be described as:

for
Rotation Forest classifier
Rotation Forest (RoF) 41 is a popular ensemble classification method, which uses the concept of feature transformation to improve the diversity and accuracy of the classifier in the ensemble system. 42 It applies the Principal component analysis (PCA) 43 algorithm to construct a rotational matrix and transforms initial variables into new variables. In this way, RoF can build independent decision trees. At the same time, the PCA algorithm maintains the integrity of the information contained in the data while ensuring the diversity of the classifiers. The framework of the Rotation Forest can be described as follows.
Let a training set
(1) The feature set
(2) Let
(3) Build a sparse rotation matrix

The columns
During the prediction process, given a test sample
Experimental and Results
Evaluation metrics
In this work, we used the following 4 metrics to access the performance of the prediction method, including accuracy (ACC.), precision (PR.), sensitivity (Sen.), and Matthews Correlation Coefficient (MCC). They can be calculated as:


where TP is a true positive, standing for the count of true samples that identified correctly; FP represents false positive, indicating the number of true non-interacting pairs that correctly predicted; TN denotes the true negative, standing for the number of negative samples that are determined has no interactions; FN is the false negative, indicating the number of true samples predicted to be non-interacting pairs incorrectly. Moreover, the receiver operating characteristic (ROC) 44 curve is employed as a measure, and the area under the ROC curve (AUC) 45 is also calculated to visually demonstrate the predictive capacity of the proposed model.
Selecting the best dimensions
In order to obtain the best prediction results, we tested the accuracy of the proposed method in different dimensions. From Table 1, it can clearly see that the best dimensions for Arabidopsis and Rice are 80 and 120, and the best dimension of Maize is 140. We also implemented a series of experiments to optimize the parameters of the RoF classifier. As a result, on the Arabidopsis dataset, the parameters L and K are set to be 35 and 22; on the Rice dataset, the parameters L and K are set to be 2 and 3, the parameters L and K for the Maize dataset were set to be 17 and 15, respectively. Here, L represents the number of decision trees and the count of feature subsets is denoted by K.
Prediction results of different dimensions on 3 plants dataset.

Prediction performance of proposed method
To avoid overfitting of the proposed method, 5-fold cross-validation (CV) 46 was applied to verify the predictive ability of DST-RoF on the Arabidopsis, Rice, and Maize datasets. Specifically, the whole dataset was randomly split into 5 equal subsets, where 4 of them were used as training sets and the remaining 1 for testing, so we can conduct 5 experiments in 1 dataset. The prediction results obtained from the proposed approach on the Arabidopsis, Rice, and Maize datasets are shown in Tables 2 to 4.
The 5-fold CV results yielded from the Arabidopsis dataset by the DST-RoF.

The 5-fold CV results yielded from the Rice dataset by the DST-RoF.

The 5-fold CV results yielded from the Maize dataset by the DST-RoF.

When applying DST-RoF to the Arabidopsis dataset, we achieved high average prediction accuracy (ACC.), precision (PR.), sensitivity (Sen.), and MCC of 82.95%, 88.21%,76.06%, and 71.44%, with the standard deviation of 0.13%, 0.36%, 0.34%, and 0.19%, respectively. The ROC curves achieved by the proposed approach on the Arabidopsis dataset are shown in Figure 1, with the average AUC value and standard deviation of 0.8897 and 0.0028, respectively. On the Rice dataset, DST-RoF obtained average ACC., PR., Sen. and MCC of 88.82%, 92.91%, 84.08%, and 80.05%, with standard deviation of 0.58%, 0.78%, 1.41%, and 0.92%, respectively. The ROC curves obtained by DST-RoF on the Rice dataset are shown in Figure 2, with the average value of AUC and its standard deviation are 0.9194 and 0.0035, respectively. When applying DST-RoF on the Maize dataset, the average ACC., PR., Sen., and MCC were 93.70%, 96.09%, 91.11%, and 88.18%, with the standard deviation of 0.43%,0.31%,0.79%, and 0.75%, respectively. The ROC curves yielded by DST-RoF on the Maize dataset are shown in Figure 3, with the average value of AUC and standard deviation are 0.9666 and 0.0039, respectively.

The ROC curves achieved by DST-RoF on Arabidopsis dataset.

The ROC curves achieved by DST-RoF on Rice dataset.

The ROC curves achieved by DST-RoF on Maize dataset.
Comparison with previous studies on the maize dataset
Various kinds of computational approaches have been developed for predicting PPIs in plants. To further verify the predictive power of DST-RoF, we compared it with some existing methods on the Maize dataset. Table 5 lists the prediction results of the other 4 different methods. It can be observed that DST-ROF obtained the best results in accuracy, MCC, and AUC values. Although the precision and sensitivity were lower than some previous methods, it still attained promising results of 96.09% and 91.11%. The ACC values yielded by these methods are between 79.58% and 89.9%, lower than 93.7%, which was achieved by the proposed method. In terms of MCC and AUC values, the average increase of our method over the best results of the 4 existing methods is 7.59% and 0.26%, respectively. These comparison results indicated that DST-RoF can improve predictive ability. This improvement may attribute to the novel feature extraction method and the use of the Rotation Forest algorithm which has been indicated to be powerful and effective for PPIs prediction.
Comparing DST-RoF with other approaches on the Maize dataset.

Abbreviation: N/A, not applicable.
Comparison with different feature descriptors on the rice dataset
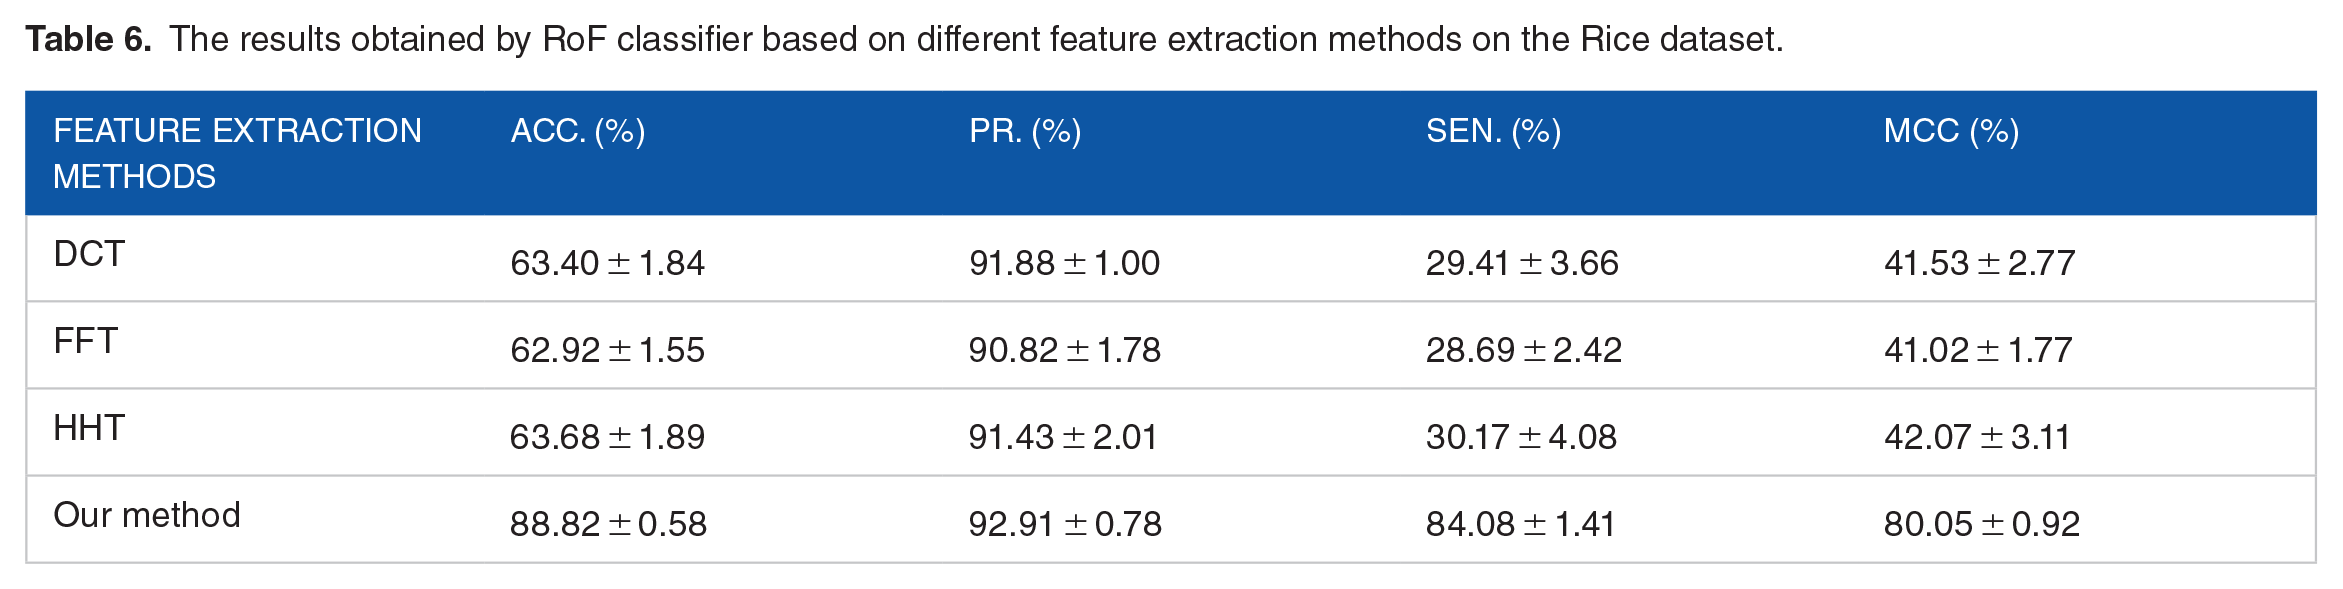
In order to verify the superiority of the DST feature extraction method, we compared it with different feature extraction methods in the same RoF classifier. In this part, we employed DCT (Discrete Cosine Transform), 49 FFT (Fast Fourier Transform), 50 and HHT (Hilbert-Huang transform) 51 to further evaluate the prediction performance of DST-RoF. DCT is a linear and invertible transformation using in image transformation. FFT has been widely performed in digital signal processing. HHT is a signal decomposition method that employed empirical mode decomposition (EMD) to decompose a real-world signal into pseudo monochromatic waves. The comparison results of different feature extraction methods on the Rice dataset are summarized in Table 6. We can indicate that DST descriptor is better than the other 3 feature extraction methods. The detailed 5-fold CV results performed by DCT, FFT, and HHT algorithm on the Rice dataset are summarized in Supplemental Tables S1 to S3.
The results obtained by RoF classifier based on different feature extraction methods on the Rice dataset.
Comparison with the KNN, SVM, DNN, and LightGBM-based method
There are many machine learning algorithms that have been to used detect PPIs. In order to further evaluate the prediction performance of DST-RoF, we combined the same DST feature descriptors with k-nearest neighbor (KNN), 52 support vector machine (SVM), 53 deep neural network (DNN),54,55 and LightGBM56,57 classifier. k-nearest neighbor (KNN) is a supervised machine learning method and it is simple and effective for classification tasks. The main idea of SVM classifier is to find a high-dimensional decision plane to solve the classification prediction problems. DNN is a deep-learning-based method, which is composed of an input layer, multiple hidden layers, and an output layer. Recently, it has been widely applied to predict PPIs.58-60 LightGBM was introduced by Ke et al 57 that combined the exclusive feature bundling (EFB) and gradient-based 1-side sampling (GOSS) algorithm.
In this part, we employed the LIBSVM 61 tool to train the SVM model. In addition, 2 parameters need to be optimized when applying the SVM classifier (the penalty c of the model and the gamma g of the kernel function). In the experiments of Arabidopsis and Rice datasets, we set c = 17, g = 5 and c = 11, g = 0.09, respectively. For the Maize dataset, we set c = 7, g = 0.4. The KNN classifier needs to choose the number of neighbors k and distance measuring function. Here, we set k to 1 and the distance measuring function is set to be L1 for the 3 datasets. The DNN classifier that used in this paper consists of 2 hidden layers with 48 and 30 neurons. Table 7 list the experimental results of KNN, SVM, DNN, LightGBM, and RoF classifiers on 3 plant PPIs datasets.
Comparing results of RoF with 4 different classifiers on 3 PPIs dataset.

It can be seen from Table 7 that when DST-RoF is used to predict the Arabidopsis dataset, high accuracy (82.95%) is obtained, which is 8.18%, 7.86%, 18.06%, and 3% higher than those of KNN, SVM, DNN, and LightGBM, respectively. On the Rice dataset, the accuracy of DST-RoF is 88.82%, which is much better than that of the other 4 methods. The accuracy of KNN, SVM, DNN, and LightGBM on the Rice dataset is 9.71%, 11.36%, 16.27%, and 4.48% lower than that of the proposed method, respectively. When DST-RoF is applied to identify the Maize dataset, the accuracy of the proposed approach is 93.70%, which is 7.63%, 9.46%, 11.7%, and 8.14% higher than our approach, respectively. When employing DST-RoF on the Arabidopsis dataset, its AUC value is 0.8891, which is 14.32%, 6.39%, 9.9%, and 1.66% higher than KNN, SVM, DNN, and LightGBM, respectively. On the Rice dataset, the AUC value of RoF is 0.9194, which is better than the other 4 algorithms. The AUC values of KNN, SVM, DNN, and LightGBM classifier on the Rice dataset are 14.81%, 6.37%, 4.99%, and 2.59% lower than our method. When performed DST-RoF on the Maize dataset, its AUC value is 0.9641, which is 10.36%, 5.05%, 2.88%, and 5.36% higher than the other 4 classifiers. In addition, the higher accuracies and low standard deviations further indicated that the combination of RoF classifier and DST descriptors can significantly improve the performance in plant PPIs prediction. Figure 4a to d reports the results yielded by the 5 classifiers on the 3 plant PPIs datasets.

Performance comparisons of 4 validation metrics of the 5 classifiers: (a) accuracy, (b) precision, (c) sensitivity, and (d) AUC.
Conclusions
In this paper, we present a novel sequence-based approach called DST-RoF, to predict protein-protein interactions (PPIs) in plants by combining discrete sine transformation (DST) with Rotation Forest (RoF). For obtaining rich evolutionary information, we first convert the plant protein sequence into Position-Specific Scoring Matrix (PSSM) and then extract feature vectors using the DST algorithm. Finally, these features are fed into the RoF classifier to determine whether there is an interaction between these protein pairs. When performed on 3 benchmark datasets (Arabidopsis, Rice, and Maize), DST-RoF obtained high average accuracies of 82.95%, 88.82%, and 93.70%, respectively. In order to verify the predictive ability of rotation forest, we compared it to state-of-the-art KNN, SVM, DNN, and LightGBM classifiers. In addition, we also compared DST with some popular feature descriptors. These results demonstrated that the presented approach is feasible and accurate for predicting potential PPIs in plants. In future work, we aim to find more efficient feature descriptors and develop a better model to explore the functions of plant proteins.
Supplemental Material
sj-pdf-1-evb-10.1177_11769343211050067 – Supplemental material for Sequence-Based Prediction of Plant Protein-Protein Interactions by Combining Discrete Sine Transformation With Rotation Forest
Supplemental material, sj-pdf-1-evb-10.1177_11769343211050067 for Sequence-Based Prediction of Plant Protein-Protein Interactions by Combining Discrete Sine Transformation With Rotation Forest by Jie Pan, Li-Ping Li, Chang-Qing Yu, Zhu-Hong You, Yong-Jian Guan and Zhong-Hao Ren in Evolutionary Bioinformatics
Footnotes
Declaration of Conflicting Interests:
The author(s) declared no potential conflicts of interest with respect to the research, authorship, and/or publication of this article.
Funding:
The author(s) disclosed receipt of the following financial support for the research, authorship, and/or publication of this article: This research is funded by the National Natural Science Foundation of China, under Grant 61722212 and 62002297.
Supplemental Material
Supplemental material for this article is available online.
References
Supplementary Material
Please find the following supplemental material available below.
For Open Access articles published under a Creative Commons License, all supplemental material carries the same license as the article it is associated with.
For non-Open Access articles published, all supplemental material carries a non-exclusive license, and permission requests for re-use of supplemental material or any part of supplemental material shall be sent directly to the copyright owner as specified in the copyright notice associated with the article.