
Abstract
We aimed to discover prognostic factors of muscle-invasive bladder cancer (MIBC) and investigate their relationship with immune therapies. Online data of MIBC were obtained from The Cancer Genome Atlas (TCGA) and Gene Expression Omnibus database (GEO) database. Weighted gene co-expression network analysis (WGCNA) and univariate Cox analysis were applied to classify genes into different groups. Venn diagram was used to find the intersection of genes, and prognostic efficacy was proved by Kaplan-Meier analysis. Heatmap was utilized for differential analysis. Riskscore (RS) was calculated according to multivariate Cox analysis and evaluated by receiver operating characteristic curve (ROC). MIBC samples from TCGA and GEO were analyzed by WGCNA and univariate Cox analysis and intersected at 4 genes, CLK4, DEDD2, ENO1, and SYTL1. Higher SYTL1 and DEDD2 expressions were significantly correlated with high tumor grades. Riskscore based on genes showed great prognostic efficiency in predicting overall survival (OS), disease-specific survival (DSS), and progression-free interval (PFI) in TCGA dataset (P < .001). The area under the ROC curve (AUC) of RS reached 0.671 in predicting 1-year survival and 0.653 in 3-year survival. KEGG pathways enrichment filtered 5 enriched pathways. xCell analysis showed increased T cell CD4+ Th2 cell, macrophage, macrophage M1, and macrophage M2 infiltration in high RS samples (P < .001). In immune checkpoints analysis, PD-L1 expression was significantly higher in patients with high RS. We have, therefore, constructed RS as a convincing prognostic index for MIBC patients and found potential targeted pathways.
Keywords
Introduction
Urothelial bladder cancer (BCa) is the 10th most commonly diagnosed cancer worldwide with first manifestation as unpainful hematuria. The worldwide age-standardized incidence rate is 9.0 and 2.2 per 100 000 person/years for men and women, respectively. 1 Approximately 75% of patients with BC present with a disease confined to the mucosa (stage Ta, CIS) or submucosa (stage T1); in younger patients (<40) this percentage is even higher. 2 It is one of the epithelial malignancies that present generally as a protrusion confined to the bladder mucosa or lamina propria. 3 The deaths caused by BCa reach approximately 150 000 cases each year. 4 Bladder cancer is classically classified as muscle-invasive bladder cancer (MIBC) and non-muscle invasive bladder cancer (NMIBC). NMIBC includes different kinds of lesions, including Tis, Ta, and T1 according to Tumor, Node, Metastasis (TNM) classification system. Papillary tumors confined to the mucosa and invading the lamina propria are classified as stage Ta and T1, respectively. Flat, high-grade tumors confined to the mucosa are classified as Tis. Approximately 75% of the BCa patients are found to be NMIBC at initial diagnosis. All of the patients with NMIBC can be treated by transurethral resection of the bladder (TURB) in combination with Intravesical chemotherapy. However, there are still part of the NMIBC respond poorly to without any anticipation. Therefore, the latest EAU guideline has emphasized the importance of reliable molecular markers for improving the predictive accuracy of BCa prognosis. 5 Although most of the patients are found to be in an early stage, there are still about 25% of patients present as MIBC or metastatic at the time of initial diagnosis, which tend to have poor prognosis. 6 MIBC remains the toughest problem up till now in urothelial bladder cancer. Radical surgery and urinary diversion would be recommended for MIBC patients. Besides, patients suffering from MIBC are vulnerable to disease recurrence and progression, which means a high-cost and miserable lifespan.
The staging system is an effective way to evaluate the prognosis of BCa patients, especially for MIBC patients. The American Joint Committee on Cancer (AJCC) TNM staging system is a classical system that has been validated and used widely to predict the risk of disease progression and help with treatment options. WHO 2004/2016 classifications are the most commonly used systems in daily routine derived from WHO 1973 grading system and classify BCa into high and low grades tumors. However, the WHO 2004/2016 classifications still show interobserver differences and less significance in predicting 5-year progression-free survival (PFS). The precise evaluation of MIBC patients’ prognosis could largely affect treatment selection. 7 There are emerging biomarkers including molecular markers, taxonomy, and gene signatures proved to be partly effective in predicting recurrence and tumor progression. As MIBC being the crux of overall survival of BCa patients, we intended to focus on MIBC prognosis prediction.
Neoadjuvant cisplatin-based chemotherapy (NAC) is the standard treatment for MIBC patients with stage T2-T4a, cN0 M0 lesions prior to radical cystectomy. However, only approximately 40% of patients could benefit from NAC with a major response, including absence of muscle-invasive disease and lymph node metastasis (<pT2 and pN0). 8 Several convincing studies have shown efficacy of immune checkpoint therapy in MIBC treatment. MIBC is proved to be susceptible to PD-L1 therapy. According to the latest ESMO, PD-L1 inhibitors were listed as first-line choice for NAC refractory MIBC patients. 9 Although PD-L1 expression level is theoretically demanded before PD-L1 inhibition therapy, PD-L1 expression is found to be not consistent enough with therapy effectiveness. 10 So it is urgent to find more precise prognostic factors to predict therapeutic reaction for immune checkpoint therapy.
Weighted gene co-expression network analysis (WGCNA) can act as a useful tool to find out differentiated genes by constructing gene networks to find connections between gene pairs and clinical characteristics. 11 WGCNA has been widely used for processing gene expression levels and studying network changes with phenotype. WGCNA can be used to delineate network topologies and modules, with topological overlap dissimilarity used as a measure of the distance between genes. Overall, the genes with the most differential expression could be included for subsequent WGCNA analyses. Thus, we made use of bioinformatics tools including WGCNA to analyze public MIBC gene datasets in an attempt to find a prognostic biomarker that can help with treatment selection.
Materials and Methods
Data collection
The study workflow is presented in Figure 1. The MIBC microarray data of TCGA cohort was obtained from Xena (https://xena.ucsc.edu/) and GSE13507 was obtained from Gene Expression Omnibus database (GEO, http://www.ncbi.nlm.nih.gov/geo) respectively. The clinical characteristics including cancer type, status, topography, lymph node, and metastasis (TNM) based on American Joint Committee on Cancer (AJCC), pathological stage were extracted, in which NMIBC BCa tumor samples were excluded. FPKM standardized data and survival outcomes of GDC TCGA Bladder Cancer cohort were extracted from Xena and processed with log2(fpkm + 1). 12 TCGA database provided 412 primary tumors in which 399 samples were identified as MIBC and GSE13507 provided 61 MIBC patients. Both of the datasets were set as discovery cohorts. All process was handled on the platform of R software (version 4.0.2; https://www.r-project.org/).

Workflow of bioinformatics analysis.
Weighted gene co-expression network analysis (WGCNA) and univariate Cox regression
WGCNA is one of the most common ways in bioinformatics to explore the relationship between tremendous genes and clinical traits. 11 A topological overlapping matrices (TOM) network was constructed for dissimilarity measurements between genes in the form of average linkage hierarchical clustering. Genes were grouped as different modules parametrized according to correlation strength with clinical parameters. In the process of WGCNA analysis, unsigned network and Pearson correlation were used. The overall survival over 3 years and less than 1 year of MIBC patients were set as clinical parameters, as well as tumor stage and grade. R2 = .9 was selected to ensure a scale-free network. Then we set the threshold as 0.4 to merge similar modules. Finally, the correlation between MIBC OS and modules was quantified and key modules were located for further analysis. Univariate Cox analysis of overall survival (OS) was performed to screen prognosis-related genes with whole transcriptome profiles. Venn diagram was utilized to find out the intersection of gene groups from WGCNA modules and univariate Cox analysis. 13
Pathway analysis and Gene-set enrichment analysis (GSEA)
Information regarding the biological pathways was obtained from the Kyoto Encyclopedia of Genes and Genomes (KEGG, http://www.genome.jp/kegg/pathway.html) pathway database. GSEA was performed according to the Kyoto Encyclopedia of Genes and Genomes (KEGG) gene set (c2.cp.kegg) in the molecular signatures database (MSigDB). 14 MIBC samples were grouped according to median risk scores as high and low. Cutoff of P < .05 was set as statistically significant.
Survival analysis and prognostic model
The univariate Cox analysis was used to filter the prognosis-related genes according to gene expressions as continuous data. The multivariate Cox analysis was conducted to assess the prognostic effects of the key genes for the construction of RS. The correlation coefficient was obtained according to the weight of genes. The RS was designed as β1 × gene1 expression + β2 × gene2 expression + . . . + βn × gene expression, where β represented the correlation coefficient. In our study, the RS formula was designed as,

The expression levels of genes and RS values were classified as high and low groups based on the corresponding median value. Kaplan-Meier analysis with Log-rank regression was selected to validate the prognostic role of genes and risk score in MIBC patients. The median value of risk score was used as cutoff value. The predictive ability of RS was evaluated by ROC curves and AUC.
Statistical analysis
Chi-square test, Fisher’s exact analysis, or Cochran-Mantel-Haenszel test were performed for categorical variables, and Student’s t-test or Wilcoxon signed ranks test were utilized for continuous variables. Spearman’s test was performed to analyze the correlation between gene expressions and RS. For all statistical analyses, a two-tailed P value < .05 was considered statistically significant.
Results
Filtration of genes with prognostic potential
WGCNA and univariate Cox regression were performed respectively to TCGA cohort and GSE13507 cohort (Figure 2). Dendrogram and corresponding clinical traits were analyzed to allow samples for further network analysis. The clinical cutoff object for WGCNA was OS and classified as less than 1 year and more than 3 years. In the TCGA cohort, 78 patients obtained OS less than 1 year and 83 patients outlived 3 years, while in the GSE13507 cohort, 20 patients failed to live more than 1 year and 16 patients lived more than 3 years. Gene co-expression network was constructed and 30 modules were identified in the TCGA cohort (Figure 2C and D), while 37 modules were obtained in the GSE13507 cohort (Figure 2J). Four groups including 3648 genes from TCGA Cox analysis, 5022 genes from TCGA WGCNA analysis, 640 genes from GSE13507 cohort Cox analysis, and 3111 genes from GSE13507 WGCNA analysis were identified (Figure 4A). In TCGA group, 3 modules from WGCNA including MEivory (P = .02), MElightcyan (P = .04), and MEbrown (P = .03) were selected, all of which showed a protective effect on OS (Figure 2D). In the GSE13507 cohort, 2 groups with the best significance, as known as MEivory (P = .01) and MEturquoise (P = .02) modules were chosen for further analysis. Univariate Cox analysis of OS filtered 3648 genes from the TCGA database and 640 genes from the GSE13507 database. A Venn diagram shows the intersection of these 4 groups (Figure 3A). Four genes were selected, including CLK4, DEDD2, ENO1, and SYTL1 (Figure 4A). The expressions of DEDD2 and SYTL1 both showed prognostic significance in differentiating early stage (T2) and later stage (T3 and T4, Figure 2B). Besides, DEDD2 (P = 0.031) and SYTL1 (P = 1.9e−10) were found to be negatively related to MIBC grade, which was consistent with the result in T stages, while higher expression of ENO1 was correlated with more possibility of high grade of MIBC (P = .009, Figure 3C). The prognostic value of genes was validated in TCGA cohort alone due to its bigger dataset. According to K-M analysis, DEDD2 showed the best prognostic efficiency in both overall survival (OS) and disease-specific survival (DSS) in TCGA cohort (P < .001, Figure 3D and E). CLK4, ENO1, and SYTL1 were able to predict the prognosis in the first 7 years and failed to predict long term OS and DSS.

Identification of prognostic gene modules in TCGA cohort and GEO dataset. (A and G) Sample dendrogram and trait heatmap of TCGA cohort. The dendrogram branches represented the clustered samples. (B and H) Soft-thresholding power analysis of the scale-free topology model fit index (upper) and mean connectivity (below). (C and I) Cluster dendrogram illustrating clustering of genes and assignment of modules. Modules were shown in different colors. (D and J) Correlation between module eigengenes and OS, tumor stage, and T stage. Close relationship was represented by red color. (E and K) Interaction between different modules. Lighter color represented higher connectivity. (F and L) The dendrogram shows the relation of modules with OS and the heatmap shows the eigengene adjacency.

Identification of key prognostic genes associated with MIBC prognosis. (A) Venn diagram of the intersection of TCGA-WGCNA-ivory-light cyan-brown, GEO-WGCNA-ivory-turquoise, TCGA-Cox analysis, and GEO-Cox analysis. (B and C) Correlationship between CLK4, DEDD2, ENO1 and SYTL1 expressions, and MIBC tumor stage and grades. P values, t-test. (D) Overall survival of MIBC patients according to CLK4, DEDD2, ENO1, and SYTL1 expressions in TCGA cohort, high and low expression were defined by medium. P values, log-rank analysis. (E) Disease-specific survival of MIBC patients according to CLK4, DEDD2, ENO1, and SYTL1 expressions in TCGA cohort. P values, log-rank analysis.

Construction of the risk score (RS) associated with MIBC prognosis. (A) Construction of RS. The formula was based on the coefficients and expression of CLK4, DEDD2, ENO1, and SYTL1 expressions as RS = (−0.36493 × CLK4 − 0.5611 × DEDD2 + 0.18251 × ENO1 − 0.09349 × SYTL1). (B) Correlationship between RS and MIBC T stages and grades. P values, t-test. (C) OS, DSS, and PFI of MIBC patients according to RS in TCGA cohort. (D) Multivariate Cox analysis showing multivariate analyses of parameters associated with MIBC OS. (E) Prognostic value of RS predicting 1-year OS. ROC curve indicated superior predictive accuracy in survival outcomes. (F) Prognostic value of RS predicting 3-year OS. (AUC = 0.653). (G) Correlation between RS and OS in T2, T3, and T4 stages of MIBC cases. (H) Correlation between RS and PFI in T2 stage of MIBC cases.
Construction and prognostic efficiency of RS in MIBC
Riskscore (RS) prognostic model was constructed based on multivariate Cox analysis. The coefficients and expression levels of the genes were integrated. A final formula was generated as RS = (−0.36493 × CLK4 − 0.5611 × DEDD2 + 0.18251 × ENO1 − 0.09349 × SYTL1) (Figure 4A). The efficacy of RS in correlating with MIBC T stage and tumor grade was validated and found that RS showed a significant relationship with MIBC grades but less with T stages (Figure 4B). Validation of OS in OS, DSS, and progression-free interval (PFI) prognosis was performed and all showed significance (P < .001, Figure 4C). The multivariate Cox analysis delineated factors closely related to prognosis (Figure 4D). Classical factors were shown to have negative effects on MIBC patients prognosis, including T3 stage (HR 1.60, CI [1.07-2.4], P = .021), T4 stage (HR 2.58, CI [1.59-4.2], P < .001). As a novel prognostic factor, RS showed similar competence with T4 stage with a hazard ratio (HR) of 2.31 (CI [1.55-3.4], P < .001, Figure 4D). Besides, Predictive effectiveness was illustrated by area under the curve (AUC). Compared with single gene expressions, RS showed outstanding prognostic ability with an AUC of 0.671 in 1-year (Figure 4E) and 0.653 in 3-year MIBC survival (Figure 4F). Stratification was made among T stages and found that RS could better predict the OS (P = .016, Figure 4G) and PFI (P = .008, Figure 4H) outcomes in patients with T2 stage, other than T3, and T4 stage.
Identification of key pathways in subgroup with high RS
Gene-set enrichment analysis (GSEA) was performed in KEGG database for further exploration of differentiated pathway enrichments. Five pathways were identified, including pathways of cell cycle, chemokine signaling pathway, ECM receptor interaction, focal adhesion, and mismatch repair (Figure 5C).
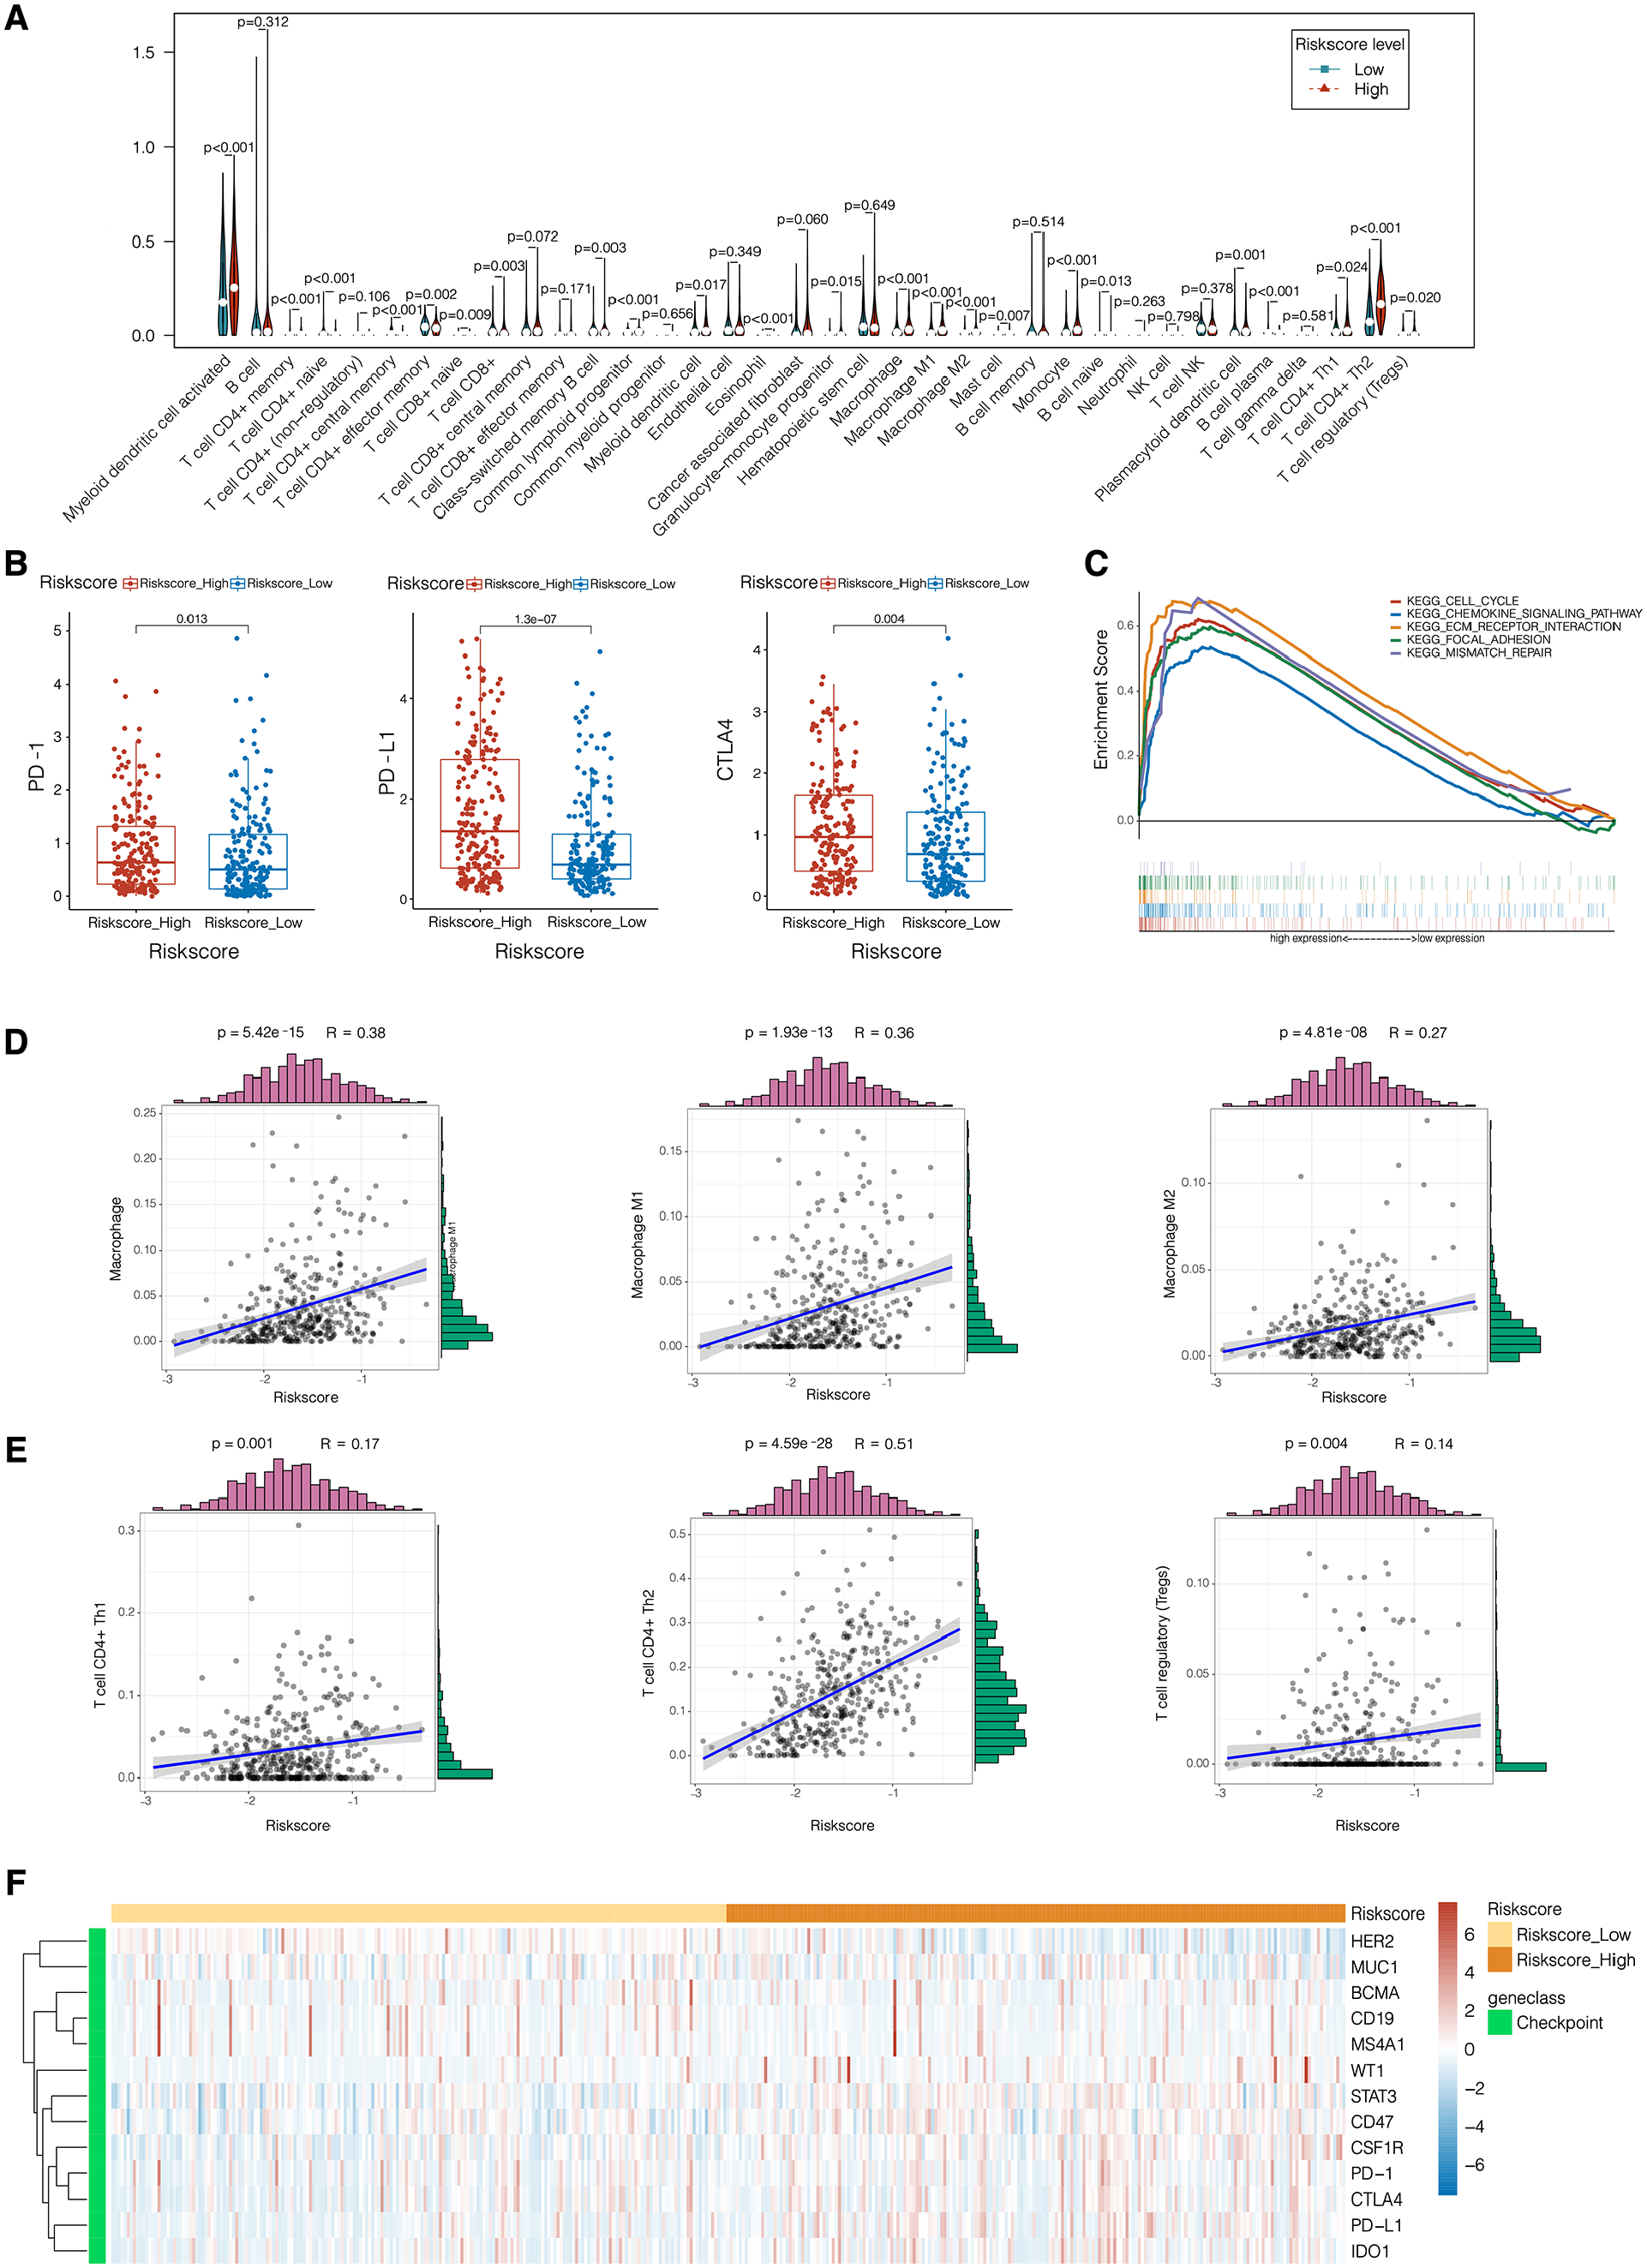
Identification of key pathways, cell infiltration, and immune checkpoint expressions associated with MIBC prognosis. (A) xCell application to MIBC samples. Vioplot was constructed to show infiltration of different immune cells in MIBC samples according to different RS. (B) Correlation between RS and PD-1, PD-L1, and CTLA4 expression levels. (C) Enrichment of Kyoto Encyclopedia of Genes and Genomes (KEGG) pathways in samples with high and low RS cases. (D and E) Correlation between the RS and Macrophage, Macrophage M1, Macrophage M2, T cell CD4+ Th1, T cell CD4+ Th2, and T cell regulatory (Treg). R and P values, Spearman’s correlation test. (F) Heatmap of checkpoint expressions correlated with risk score levels.
Immune cell infiltration in RS subgroups
xCell is a platform that allows online enrichment analysis from gene expression data for 64 immune and stroma cell types. 15 A vioplot was generated based on MIBC dataset to show infiltration of different types of cells infiltration (Figure 5A). We found that T cell CD4+ Th2, macrophage, macrophage M1, and macrophage M2 infiltrated differently in samples with high and low RS scores, proved by Spearman’s test with positive correlation with RS (Figure 5D, P < .001).
Predictive role of RS in immune checkpoint inhibitor (ICI) therapy
Considering the exploration of ICI therapy’s therapeutic impact on MIBC patients, we explored immune checkpoint expressions in MIBC samples. Heatmap was constructed to filter significant immune checkpoint genes and found that PD-1, CTLA4, and PD-L1 were related to RS score (Figure 5F). Compared with PD-1 (P = .013) and CTLA4 (P = .004), PD-L1 expression level showed significantly stronger connection with RS score (P < .001, Figure 5B).
Discussion
Bladder cancer is a common type of malignancy in urinary tumors with high rate of recurrence and mortality. The unstoppable hematuria and repeated bladder outlet obstruction caused by blood clots in the final stage could overwhelm MIBC patients and their families with great pain. For NMIBC patients, ideally, TURBT followed by immediate postoperative mitomycin C application remains the first choice. However, for patients with metastatic MIBC, chemotherapy was the limited choice left with an unsatisfying response rate. With the application of ICI as first-line therapy to cisplatin-ineligible patients or as second-line therapy for patients with metastatic MIBC, OS is expected to be prolonged to longer than 15 months.16,17 According to existing clinical trial, only about 50% of MIBC patients with positive PD-L1 can respond to Durvalumab, which gives a hint that PD-L1 expression level is not able enough to predict ICI therapy response. Therefore, we had a shot at exploring a biomarker that can both reflect the prognostic value and ICI treatment selection and found that the RS system we built can be competent in both aspects.
The RS prognostic system was constructed from TCGA and GEO database with aid of bioinformatics tools. Five genes were filtered and found to be correlated with MIBC tumor grade and OS, in which DEDD2 and SYTL1 showed the tightest relationship (Figure 3). DEDD2, also known as Death Effector Domain Containing 2, is a DEDD homolog that contains an NH2-terminal region with the DED domain, and a COOH-terminal region homologous to some DNA-binding proteins such as histones. 18 Alcivar et al 18 proved DEDD2, together with DEDD, to be a strong inducer to death receptor-induced apoptosis by facilitating translocation of caspase-8 to the nucleus during CD95-mediated apoptosis. While according to Lee et al, 19 DEDD2 can help DEDD with regulating the degradation of intermediate filaments during apoptosis. In terms of the tumor, although the role of DEDD2 in MIBC has not been explored yet, it has been proved to take part in several malignancies. DEDD2 was found to be involved in prostate cancer. 20 High miR-301 expression was significantly close to the poor outcome of PCa patients. Increased DEDD2 expression could downregulate miR-301 to help luteolin with the inhibition of PCa cell proliferation and induction of apoptosis. Besides, DEDD2 was also found to take part in the apoptosis of non-small cell lung cancer and triple-negative breast cancer cells through CARP-1 functional mimetics (CFMs). 21 Considering the important role of apoptosis in tumor cell proliferation and progression, the role of DEDD2 in bladder cancer cell biological behavior deserves further exploration.
Another major component of RS was SYTL1, also called synaptotagmin-like 1 gene with the alias JFC1 and SLP1. According to Catz et al, 22 JFC1 was found to be important to prostate cancer cell lines. JFC1 can be activated by TNFα/NF-κB pathway in vivo, and the mitogenic factors secreted from prostate carcinoma cells could regulate the autocrine effects by overexpression of JFC1. Besides, JFC1 also plays a crucial role in immune systems by facilitating MST-1 in vesicle trafficking and extravasation of neutrophils, in an attempt to regulate neutrophil transmigration through vascular basement membrane. 23 In blood malignancies, SYTL1 is also targeted by MEIS1 to promote leukemogenesis and support leukemic cell homing and engraftment, facilitating interactions between leukemic cells and bone marrow stroma. 24 There is an initial report about the role of SYTL1 in bladder cancer without much evidence and practice. 25 So it can always give us a crux hint when it comes to questioning the reason why ICI therapy fails in some MIBC patients and how MIBC cells migrate and proliferate.
Our study also has some limitations. First, the sample size of MIBC from 2 datasets are not balanced, and the small amount of low grade MIBC patients can lead to selection bias. Second, our study was primarily based on transcriptomic analysis. Further large and external validation of RS in clinical practices is needed.
Conclusions
In the study, a bioinformatics analysis identified 5 key prognostic genes of MIBC, based on which RS was constructed and validated in the prediction of OS and potential ICI therapy choice. However, the results still need further perspective, external validations.
Footnotes
Funding:
The author(s) disclosed receipt of the following financial support for the research, authorship, and/or publication of this article: This study was funded by grants from National Natural Science Foundation of China (81902898, 81700660) and Shanghai Sailing Program (19YF1407900). All these study sponsors have no roles in the study design, in the collection, analysis, and in the interpretation of data.
Declaration of Conflicting Interests:
The author(s) declared no potential conflicts of interest with respect to the research, authorship, and/or publication of this article.
Author Contributions
Xianglai Xu, Yanjun Zhu, and Jiajun Wang conceived and designed the study. Xianglai Xu, Yelin Wang, and Sihong Zhang contributed to the acquisition, analysis, and interpretation of data. Xianglai Xu, Yelin Wang, and Sihong Zhang performed the statistical analysis. Sihong Zhang wrote the paper. Yanjun Zhu and Jiajun Wang reviewed the manuscript. Xianglai Xu provided technical and material support., Xianglai Xu and Jiajun Wang contributed to funding obtaining. Yanjun Zhu and Jiajun Wang contributed to study supervision. All authors read and approved the manuscript.