
Abstract
Computational prediction of gene-gene associations is one of the productive directions in the study of bioinformatics. Many tools are developed to infer the relation between genes using different biological data sources. The association of a pair of genes deduced from the analysis of biological data becomes meaningful when it reflects the directionality and the type of reaction between genes. In this work, we follow another method to construct a causal gene co-expression network while identifying transcription factors in each pair of genes using microarray expression data. We adopt a machine learning technique based on a logistic regression model to tackle the sparsity of the network and to improve the quality of the prediction accuracy. The proposed system classifies each pair of genes into either connected or nonconnected class using the data of the correlation between these genes in the whole Saccharomyces cerevisiae genome. The accuracy of the classification model in predicting related genes was evaluated using several data sets for the yeast regulatory network. Our system achieves high performance in terms of several statistical measures.
Introduction
Gene expression profiling is a crucial step in identifying regulatory genes, which are genes in control of the functional product of other genes. It is also a step toward the categorization of genes or proteins based on their functionality. Data analysis technologies such as microarray and RNA-Seq are typically used in producing gene expression data. Such techniques infer gene-gene associations deduced from constructed gene networks such as co-expression networks and gene regulatory networks. These networks, in return, extend the use of gene expression data to other utilities such as protein function prediction and Gene Ontology terms cluster analysis.1-3 Observing co-expressed genes or regulatory genes is fundamental to deepen the understanding of how genes interact to create different proteins in various organisms. 4 Usually, related genes are inferred based on similar expression profiling across multiple samples with different experimental conditions. One notable limitation with expression data analysis technologies is the drop of the co-expression inference accuracy when it is not deduced from enough experimental conditions, leading to increased noise levels in the data. Several approaches have been proposed to use the co-expression data and improve co-expression inference accuracy by increasing the size of data and the number of experimental conditions.5-7
Unlike co-expression networks, identifying causal relations based on expression data is a difficult problem, and no reliable, general methods are known. Most approaches are either using Directed Acyclic Graphs 8 (limited to very small networks only), or using methods derived from Grainger Causation analysis 9 (requiring time-course data sets), or 3-gene interactions. 10 For a review of most important previous attempts to develop a method for inferring causation, see, for example, Glymour et al 11 and Pearl. 12 Causation has also been inferred using joint distribution of variables in some special cases. 13 Higher moments have been successfully used for describing joint probability distribution of variables with dependencies with applications in physics.14,15
These approaches provide a rationale that a more general criterion for causal interactions may be formulated, and that such criterion will be conveniently expressed in terms of the moments of the joint distribution of normalized expression,
In this article, we detect regulatory associations for pairs of genes using microarray expression data obtained from a wide range of experimental conditions. Our method aims to construct causal co-expression network for the whole Saccharomyces cerevisiae genome. We create a multidimensional space of values to represent each pair of genes and categorize them into either connected or nonconnected class. We use a rare-event algorithm for the classification approach that represents the sparsity of data that reflects all possible pairs of genes. Connected genes were evaluated using repositories for yeast regulatory association network. Our system performs well in terms of high degree accuracy and recall. The rest of the article is structured as follows. In the “Methods” section, we give a general description of our proposed method. We discuss the experimental results in the section “Experimental Results and Discussion.” Finally, we provide conclusions in the last part of the article.
Methods
We use co-expression microarray data and gene regulatory networks to train a rare-event classification model and categorize each pair of genes into either connected (positive) or nonconnected (negative) class. The pair-wise relations between pairs of genes are measured by calculating the moments of the joint probability distribution of each pair,
The positive group in this framework denotes pairs of genes with a regulatory association (ie, either gene in the pair is a transcription factor [TF]). The process of the predictive classification model consists of data preparation, training, and testing. Below are the methods and details for each step.
Data preparation
The Gene Expression Omnibus (GEO) was used to obtain the yeast microarray expression data. The GEO is an online public database that holds various genomics data. It provides tools and downloadable content of selected gene expression profiles and several sets of genomic experiments.
20
We downloaded the microarray data sets for the Affymetrix Yeast Genome S98 Array. The S98 array complies with 9335 probe sets for all known 6400 yeast genes in the complete Saccharomyces Genome Database (SGD). Specifically, we use the provided probe set data by the GPL90 platform file that is represented by different experimentation conditions (series) and a total of 1496 samples (the list of GEO accession numbers is provided in the Supplementary Table S1). In many cases, the different probe sets correspond to expression of alternative isoforms, or splicing variants of a gene. Different isoforms may be regulated differently and may have different impact on downstream regulatory pathways; therefore, we find it justified to consider them separately. We use these data to create a multidimensional space of values for all pairs of the 9335 probes by first normalizing the data samples by dividing by the sample mean on a linear scale. Second, we calculate the moments

We apply the principal component analysis (PCA) concept to reduce and control the vast resulted multidimensional space of moments. The PCA is a linear feature conversion technique for reducing data dimensionality without compromising the nature of the information. It uses an orthogonal model to transform variables into principal components. 21 The principal components of the moments created new elements in the MV for each pair of probes and reduced them from 49 to 36 moments. That is still quite a large number of moments; however, we show in Figure 1 how the number of moments affects the training accuracy. Next, we analyze the data of pairs, each represented by a vector of variables by feeding the data into a rare-event logistic regression (LR) model.

The training accuracy increases as the moments represented by each pair of probes increase.
Training
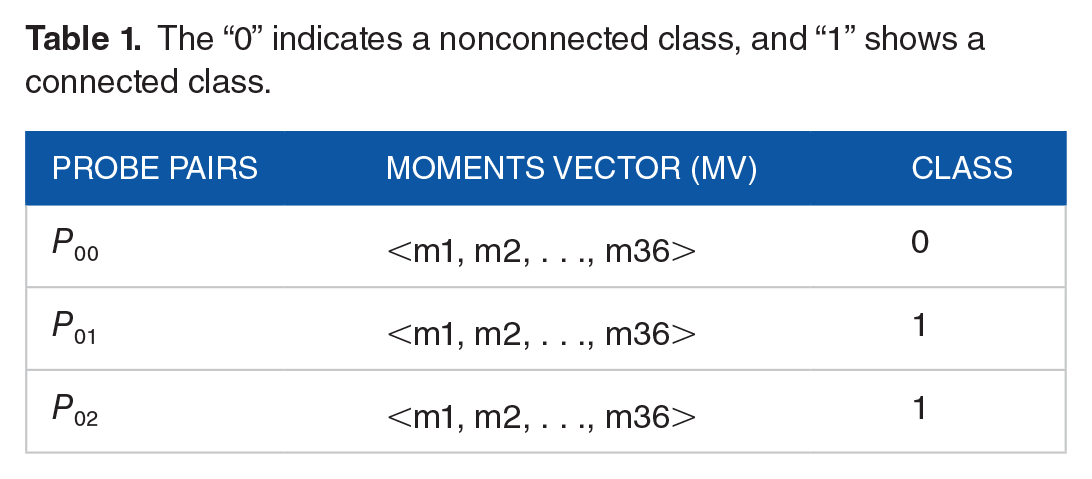
To prepare the training data, we first classify the pairs to either connected or nonconnected pairs, based on regulatory association data sets. There are several sources for yeast regulatory networks and TFs such as YEASTRACT, 22 YTRP, 23 RegulatorDB, 24 and Harbison data. 25 In this work, we use a curated database for Yeast Transcriptional Regulatory Pathway (YTRP) to train the pairs of probes. 23 Yeast Transcriptional Regulatory Pathway repository identifies target genes (TG) by employing different TFs’ alteration experiments. The training and testing data were selected from pairs of probes that correspond to different genes. The data in the repository are publicly available for downloading as flat files of regulatory pairs (TF-TG). We downloaded to a local SQL database a total of 213 806 pairs from the YTRP TF-gene direct regulatory network file. Table 1 shows an example of the first 3 pairs in the data fed to the classification algorithm.
The “0” indicates a nonconnected class, and “1” shows a connected class.
Standardization of gene names
To maintain data consistency throughout the system processes, we used an annotation resource to get standard gene names for both the probes’ genes and YTRP genes. There are many resources, such as UniProt Knowledgebase (UniProtKB), 26 GeneCards, 27 and GeneMania. 28 In this work, we use UniProtKB due to the easy access of downloadable material and details of all yeast genes’ names that are organized by primary name (official gene symbol), synonyms (all other names), and ordered locus names. We have converted the probes’ gene names and all YTRP genes to the primary name of genes, according to UniProtKB. This process made it innovative and more efficient to match the probe pairs to the YTRP data and classify them to either class (connected) or (nonconnected).
The zero challenge
As stated, we use YTRP to classify the probe pairs to either class (0 or 1). It is very straightforward to assign a pair to class “1” as long as it is part of the YTRP data. However, it is a nondeterministic approach to assign a pair of probes to class “0” if it is not found in the YTRP data. It is also very challenging to assign pairs to class “0” as the pair could hold a regulatory association, but not yet updated in the association databases. The framework of our system, that is particularly important as the choice of nonconnected pairs that are used for the training, will have a significant effect on testing and determining the prediction parameters later on. One way to tackle this is to follow a heuristic method that decides on whether a pair belongs to class “0.” An example is to look for pairs in multiple databases of regulatory associations, and if it appears to be missing from many databases, then it could be classified to the nonconnected class. Another way is to look for pairs that are certain to be not connected according to the literature. In this work, we assign a probe pair to class “0” if the pair is among the top least correlated pairs. The correlation of each pair is calculated using the moments of joint probability distribution values. In general, there is a research gap regarding this challenge that limits the ability for nonconnection decision-making.
Rare-event LR
The data of MVs and class classification indicator (0 or 1), similar to Table 1, are fed into a RE-WKLR. The RE-WKLR is a rare-event classifier that best characterizes the nature of data in this work.
17
Rare-event classification considers the sparsity of data as the connected pairs of probes are rare compared with the total number of pairs for all 9335 probes. The RE-WKLR is a weighted (W) kernel (K) version of LR, where the weight indicates the proportion of the connected and nonconnected pairs in the data. The kernel reflects the nonlinear alternative of LR and represents the data in a higher dimensional space allowing for a better understanding of the data behavior. The performance of this algorithm was compared with other classification models such as support vector machine in previous work.17-19 The Gaussian radial basis function kernel is used in this study (see equation (2)). The data set of 12 000 pairs, each represented by 36 moments, is fed to the classification algorithm. The data set is denoted by the kernel matrix k=k(xi,xj), and ki is the


The training data for each pair consist of a feature vector and output class. The elements of the feature vector are calculated from the top 36 PCA components of the moments of joint probability distribution of expression levels. The class assigned to each pair is based on yeast regulatory network database (YTRP). The 6000 pairs with confirmed YTRP connections were selected randomly to represent class “1.” An additional 6000 pairs with no confirmed YTRP connections and with lowest possible expression correlations were selected to represent class “0.” Both
As part of the training phase, we also plot the learning curve of RE-WKLR to show how the training size affects the testing prediction accuracy. As can be seen from Figure 2, the predictive model RE-WKLR improves the prediction of connected instances as the training size increases.

As the number of training examples increases, the percent of correct predicted instances increases.
Validation testing
The optimal parameters obtained from data training are used to predict a data set of microarray probe pairs by providing the best fit vector

We test random data of pairs using YTRP as the yeast regulatory network source for evaluation. We conducted a test consisting of 10 000 new random pairs. The accuracy (ACC) is measured by observing the true positives (TP), false positives (FP), true negatives (TN), and false negatives (FN). A description of each measure is explained below:
TP is the total of correctly predicted connected pairs (found in YTRP);
FP is the total of negative instances predicted as connected pairs pairs that are not found in YTRP);
TN is the number of correctly predicted nonconnected pairs (not found in YTRP and belongs to the 6000 zeros used for training);
FN corresponds to the number of incorrectly predicted negative pairs (not found in YTRP and not part of the 6000 zeros used for training).
The value of each measure is indicated in Table 2. We also measure the positive predictive value (PPV) and negative predictive value (NPV) to diagnose the performance of testing:

Justification = centering, margin = 0.6 cm
A confusion matrix for the accuracy measures used for the testing data.
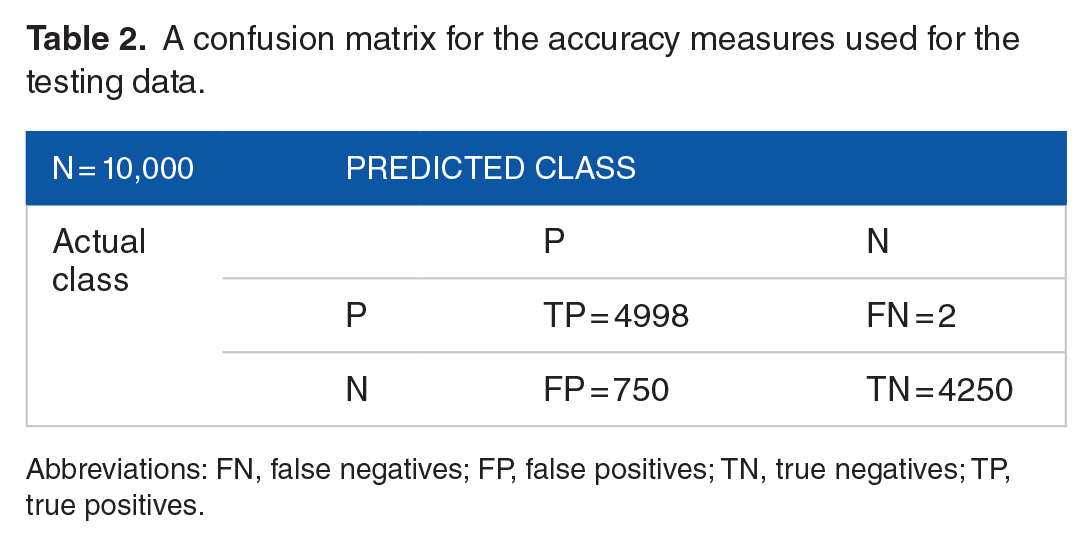
Abbreviations: FN, false negatives; FP, false positives; TN, true negatives; TP, true positives.
Results
We implemented a system that analyzes a multidimensional data of microarray yeast probes and their joint probability distribution moments to identify connected genes and to construct a yeast co-expression network while detecting TFs. This system was executed in C# and Java running on Intel(R) Core i7 processor, with a CPU of 3.4 GHz and 16 GB RAM. The classification model was performed using MATLAB version 2018b. We identified the total number of unique probe pairs using
The accuracy of identifying related probes was evaluated using different repositories for gene regulatory networks. We used databases that target the S cerevisiae genome. The evaluation criteria are essentially based on the observation of true positives and false negatives to estimate the sensitivity (recall) of data using equation (5). The computation of the precision of data in this work is omitted because of the fact that computing precision depends on false positives. As stated previously in the zero challenge section and the testing section, a true nonconnected pair is hard to confirm, and hence it is not practical to identify false positives:

We conduct mainly 2 main experimental tests: (1) using regulatory network databases and (2) using the TFs database.
Using regulatory network databases:
a. YEASTRACT 22 : We use a curated repository called the Yeast Search for Transcriptional Regulators And Consensus Tracking (YEASTRACT) to identify connected pairs of probes. The YEASTRACT holds more than 160 000 yeast regulatory associations between transcription regulators (factors) and TG. The information of genes in YEASTRACT is systematically updated from sources such as the SGD, 29 Gene Ontology (GO) consortium, 30 and Regulatory Sequence Analysis (RSA) Tools. 31
b. Biochemical pathways 29 : We used the pathway data from the SGD to test for the prediction of our data. The SGD provides different download categories of topics, data, and format. We used the yeast biochemical pathway files from the customized search tool to differentiate the genes responsible for catalyzing the biochemical reaction. We also used the interaction data available to construct the genes pairs. The database holds about 339 405 interactions in pathways.
c. YTRP 23 : We also evaluate the prediction of YTRP pairs that were not used in either training or testing. Similar to the training and testing phase, we first converted all the genes names in the databases to one standard name using UniProtKB. 26 For each of the benchmarks above, we conducted several tests, each with a sample of at least 2000 pairs, and calculated the recall. The results shown in Figure 3 are the overall average accuracy for all tests with each benchmark.
Using TFs database:
a. YeTFaSCo 32 : The Yeast Transcription Factor Specificity Compendium is a database of yeast TFs. It holds around 1887 yeast TFs and TF specificities in 2 main formats (ie, position frequency matrix and position weight matrix). The website includes several ways to browse, analyze, and download the data. The available data are all motifs, expert-curated sets, expert-selected motifs, GB tracks, and microarray data. We used YeTFaSCo to evaluate the recall of TFs identified by our system. We compute the number of TFs according to YeTFaSCo that appear in random test samples of connected pairs. We report this recall of TFs also in Figure 3.

The recall accuracy calculated for different regulatory network databases and using a transcription factors repository (YeTFaSCo). YeTFaSCo indicates Yeast Transcription Factor Specificity Compendium.
Conclusions
In this article, we have presented an approach to detect yeast genes regulatory associations using microarray expression data acquired using samples with many and diverse experimental conditions. The classification algorithm followed in this work is based on a Weighted and Kernel version of Logistic Regression (RE-WKLR). It has been shown that this classifier presents the rarity nature of connected genes and the abundance of nonconnected genes. Each pair of genes was defined as a vector of 36 features, which are the moments of the joint probability distribution of expression levels of the 2 genes. The prediction accuracy for the connected genes was assessed using different benchmarks holding information of yeast regulatory association network. Our system performed well in terms of high degree accuracy and recall. Also, the system identifies well-known TFs using YeTFaSCo as a source of TFs. The prediction of the connected class was evaluated and found to score more than 95% in most of the yeast regulatory association repositories. We plan to extend our work by including the directionality of the regulatory network using multiclass classification. Also, we will use our proposed method in the future on RNA-Seq data.
Footnotes
Acknowledgements
The authors would like to acknowledge the support provided by the Office of Research Support at Khalifa University.
Funding:
The author(s) disclosed receipt of the following financial support for the research, authorship, and/or publication of this article: This publication is based on work supported by the Khalifa University of Science and Technology under “Award No. RC2 DSO.”
Declaration of Conflicting Interests:
The author(s) declared no potential conflicts of interest with respect to the research, authorship, and/or publication of this article.
Author Contributions
DH and AK conceived of the presented idea. AA, KT, and DH developed the theory and performed the computations. MM provided the classification algorithms. All authors discussed the results and contributed to the final manuscript.