
Abstract
Computing similarity between 2 nucleotide sequences is one of the fundamental problems in bioinformatics. Current methods are based mainly on 2 major approaches: (1) sequence alignment, which is computationally expensive, and (2) faster, but less accurate, alignment-free methods based on various statistical summaries, for example, short word counts. We propose a new distance measure based on mathematical transforms from the domain of signal processing. To tolerate large-scale rearrangements in the sequences, the transform is computed across sliding windows. We compare our method on several data sets with current state-of-art alignment-free methods. Our method compares favorably in terms of accuracy and outperforms other methods in running time and memory requirements. In addition, it is massively scalable up to dozens of processing units without the loss of performance due to communication overhead. Source files and sample data are available at https://bitbucket.org/fiitstubioinfo/swspm/src
Introduction
Computing similarities or distances between 2 nucleotide sequences is one of the basic steps in many areas of bioinformatics. One of its possible applications is constructing phylogenetic trees that represent evolution of a group of species. For large data sets, such trees are often constructed by distance-based methods, such as Neighbor Joining,
1
UPGMA,
2
or SLINK.
3
These methods apply variants of hierarchical clustering to a distance matrix, which expresses dissimilarity between each pair of species. The distance matrix is typically computed by comparing nucleotide or protein sequences, which represent individual species. It is therefore important to develop efficient methods that can evaluate pairwise similarity or distance between pairs of sequences to provide data for phylogenetic tree reconstruction.
4
However differences between individual sequences acquired during evolution can have many forms, including substitutions of individual nu
Related Work
Sequence comparison methods in bioinformatics can be divided into 2 major groups: (1) alignment methods, which create local pairwise alignments of sequences and evaluate the number of substitutions in such alignments, and (2) alignment-free methods,4,6–8 which are heuristics based mainly on statistical characteristics of data.
Established alignment-free methods include, for instance, Word Frequencies Method
8
(WFM) that counts the number of occurrences for all possible sequences of fixed length (words or k-mers) across the genome and then compares the resulting frequency vectors using some similarity metrics. Based on WFM, Spaced Word Frequencies Method
9
(SWFM) uses a different frequency vector computation. In this case, the word is not a short contiguous sequence, but a sequence of characters with fixed preset distances in the original genome. The word frequency vectors can be compared by various statistical approaches.
10
For example, the
Another well-known group of methods searches for the longest common substring
14
or common substring with fixed
Another group of methods to be mentioned here is based on Locality-Sensitive Hashing (LSH). Locality-Sensitive Hashing is a type of hashing, which unlike general hash functions, aims to map similar keys to the same hash values, thus aiding in finding similar objects. Algorithms based on LSH
18
usually compute a set of hashes for each sequence and search for similarities. Recently, approaches based on MinHash technique became popular,
19
where each word of length
The methods mentioned so far concentrate on the presence or absence of various substrings, but do not consider positions of such substrings in a sequence. The natural vector method encodes each input sequence as a vector encompassing both the frequency and positional distribution of individual nucleotides, 20 amino acids 21 or even k-mers. 22 The method can be further extended to consider covariances of occurrence positions. 23
A group of emerging alignment-free methods proposed recently24,25 uses spectral transforms instead of simple statistical quantities. Application of spectral transforms, mainly the fast Fourier transform 26 (FFT), to DNA sequences is not a new technique. Well-established multiple-sequence alignment method MAFFT 27 uses the Fourier transform and convolution principle for finding local matches. The process is applied to every pair of sequences, which is quite slow. Since 2014, Yin et al 24 have been using spectral transforms to relax strict dependency on positional information contained in sequences. Their methods compare raw signal spectra acquired from original sequences or compute numerical characteristics out of raw signal spectra, referred as (Yin) Signal Moments Method 25 (YSMM). Spectra can be also computed from hydrophobicity profiles of protein sequences 28 or further transformed by computing prefix sums. 29
The Yin Signal Moments Method 25 is claimed to be very accurate, but it can produce misleading results when applied to sequences with varying lengths. Namely the spectral coefficients used in this method are not normalized by the input sequence length. According to Parseval theorem, the computed coefficients depend on the sum of input sequence indicators, and therefore without a proper normalization, its results reflect predominantly the input sequence length (see Figure 3 in the “Evaluation and Results” section).
Our method differs from YSMM 25 in several important aspects. First, we use a different encoding of an input DNA sequence into a vector of complex numbers, as proposed by Cheever et al. 30 As we will show, our encoding is more efficient, in some cases more accurate and has attractive theoretical properties. Second, we compute the transform in sliding windows, rather than on the whole sequence, which allows us to compare sequences that underwent rearrangements. Third, we summarize each DNA sequence into a vector of the same length as the sliding window, rather than a short vector of size 12, as in Yin method. Finally, we normalize the resulting vector by the input sequence length, which allows us to compare sequences of unequal lengths. Note that closely related sequences may differ in their lengths due to large-scale evolutionary changes (deletions, duplications, transposon insertions), but also due to incompleteness of one of the sequences. Before describing our method in more detail, we review basic principles of spectral transforms.
Background
Spectral transforms
A spectral transform is a transformation of an input numerical series of the length
The discrete Fourier transform (DFT) is a well-known spectral transform defined as follows

In this formula,

The transform approximates the input signal using a series of sine and cosine functions with periods in interval
Similarly, the Walsh-Hadamard transform (WHT) 31 approximates the input signal by rectangular basic functions and therefore can be computed by less computationally expensive addition and subtraction operations. A version optimized for sliding windows was also developed, 31 which may further reduce computational requirements. We have investigated WHT as a faster replacement for FFT in our experiments, but it has a lower accuracy.
Spectral transforms in discovering motifs in sequences
A DNA sequence is a nonperiodic signal with some periodic repetitive parts.
32
Because spectral transforms are intended to transform periodic signals, transforming nonperiodic signals into signal spectra may resemble hashing one representation to another without understanding its internal structure. The intuition is that the transform helps to find variations in the density of particular characters inside a sequence. Every spectral coefficient reflects differences considering a period related to its index
A typical spectral transform is typically used for periodic signals, and therefore, a single signal spectrum is computed for the whole input data. Spectral coefficients are computed using a series of successive basis function periods; see Figure 1 showing 3½ such periods of the length
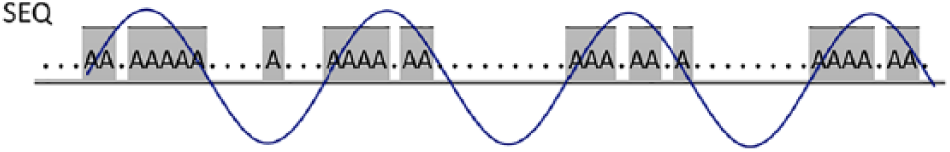
Visualization of a single spectral coefficient calculation from a signal sequence. In this case, the spectral coefficient for the period of 16 characters
Method Design
In this section, we propose a novel method designed to estimate similarity of DNA sequences, which is able to handle input data with varying characteristics, such as identity levels, sequence length, and the presence of rearrangements. We have also investigated several related spectral-based methods. Some of them have achieved superior accuracy on some data sets, however, with no general applicability. Therefore, the following sections are dedicated to the most robust method, Sliding window spectral projection method (SWSPM).
Linear-time architecture as a key to performance gains
Let us consider comparing sequences of
Computing a full dynamic programming alignment for each pair of sequences results in
Sliding window spectral projection method
Sliding Window Spectral Projection Method (SWSPM) is a transformation of a nucleotide sequence to a representative numerical vector of a reduced dimensionality. We start by an algorithm outline and explain individual steps in more detail in the following.
The DNA sequence Length - Step w
s
defining the number of positions the sliding window is shifted in each iteration
Step 1: Vector
Step 2: Repeat steps 3 to 5 for each window
Step 3: The alphabetical window
Step 4: FFT, compute spectral transform
Step 5:
Step 6: all iterations, each element of the resulting vector
We now explain the nontrivial steps of the algorithm in more detail.
Window creation (Step 2)
Given a sequence
Numerical representation (Step 3)
Spectral transforms can be computed from vectors containing real or complex numbers; therefore, a conversion from alphabetical sequence to a numerical vector is needed. Yin et al use Binary Sequence Indicators (BSI), creating
Cheever et al
30
represent each nucleotide by a different complex root of unity, and we use the same method and we denote it as
Spectral transform (Step 4)
Each window is processed separately by the selected spectral transform. The method is designed so that it works with any spectral transform; however, FFT proposed by Yin et al has performed better than both WHT and Wavelet transform with various wavelet functions.
Final processing (Steps 5 and 6)
Vectors containing power spectra, one per window, are summed to a single resulting vector of length
To avoid problems caused by different sequence lengths, the output vectors are normalized by the number of windows processed:
Pairwise comparison
To produce the final distance matrix, we compare each 2 resulting vectors (spectral projections) using one of the generic distance functions. 8 Our implementation allows both Euclidean and Cosine distances, which have almost identical accuracy. Our preliminary experiments with other distance functions reduced the accuracy.
Figure 2 shows the outline of the SWSPM process, excluding the pairwise comparison step. For better readability, the sliding windows are displayed without overlaps. In practice, better results are achieved using overlaps up to
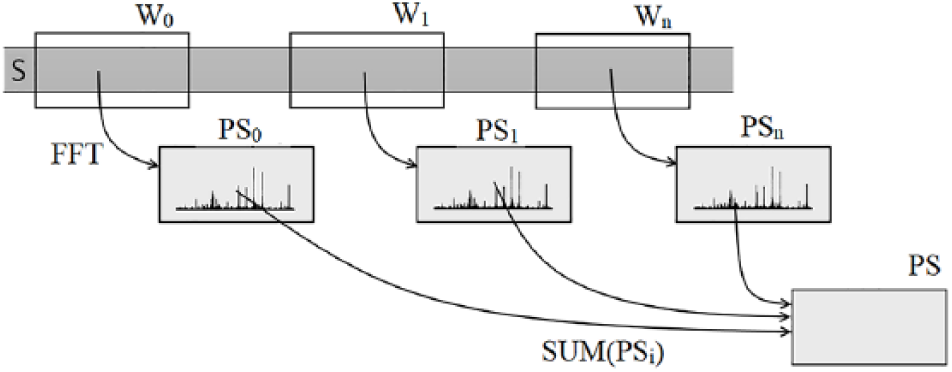
Sliding window spectral projection process illustrated by 3 nonoverlapping windows
Theoretical properties of SWSPM
In the next section, we will demonstrate the performance of our method on both simulated and real data. Here, we make some theoretical observations on our method.
The sliding window approach uses the sum of transforms computed over shorter windows. If the sequence undergoes large-scale rearrangements, most windows will only change their position in the sequence and thus will contribute equally to the sum. As a result, the distance can stay low. Nonetheless, the difference can be detected, thanks to windows containing rearrangement breakpoints.
Another important property of our method is that the distance of a sequence and its reverse complement is zero, thanks to our root of unity encoding. This is desirable, because the orientation of sequences in a dataset can be arbitrary, and longer sequences often harbor inversions of parts of the sequence.
In particular, for a single window, different sequences always have different DFT transforms, because the DFT transform is invertable. However, the same is not true for the power spectrum, which uses the magnitude of each component of the DFT. For example, if we start with sequence
In the more relevant case, when one sequence is the reverse complement of another one, we also get the same power spectrum. Reverse complement as an operation consists of reversing the order of bases and then substituting symbols
Computational complexity of our method
Let
The actual distance matrix computation requires
Evaluation and Results
The proposed algorithm has been tested and compared with several existing solutions. These include the following:
SWSPM was implemented in Java within ELKI framework.
34
For Kr and Andi, we have used published implementations. All other methods were reimplemented in the ELKI framework for fairer comparison of running times. Where original published implementations were available, we have verified that our implementation yields the same results. Trees were computed based on the distance matrices using the SLINK algorithm.
3
Unless noted otherwise, in most tests, we use SWSPM with window size
Evaluation metrics
We have evaluated the accuracy using 3 metrics described in this section.
Distance matrix difference
Distance matrix difference metric compares a reference distance matrix further referred as

where
Robinson and Foulds distance
Our next goal is to evaluate similarity between the reference phylogenetic tree and the one produced by a clustering algorithm based on the distance matrix computed using the proposed spectral transform approaches. As distance matrices are often used to create phylogenetic trees, it is important to measure the influence of the matrix on the tree reconstruction. The first of 2 tree-based metrics is the Robinson and Foulds distance as described by its original authors;
35
here denoted as
Tree traversal length metric
The Robinson and Foulds distance does not reflect branch lengths of the tree, only the topology of the tree. Our approach is therefore to compute a new pairwise matrix

Results on simulated data
Exploration of parameter settings
We have used INDELible software
37
to generate 10 inputs, each consisting of a phylogeny with 10 species with sequences of length 10 kB. The sequences were generated under the Hasegawa-Kishino-Yano (HKY) model of substitutions with
The measured error values on an artificial dataset for different parameter settings.

Lower values are better.
Abbreviations: BSI, binary sequence indicator; FSWM, filtered spaced word matches; SWFM, spaced word frequencies method; SWSPM, sliding window spectral projection method; WFM, word frequencies method; YSMM, (Yin) signal moment method.
The best results in each column are highligted in boldface.
By comparing SWSPMa-RU, SWSPMc-RU, and SWSPMd-RU, we see that for these particular inputs, increasing of
Table 1 also shows that our method with RU nucleotide encoding achieved lower
Influence of dataset properties
We have also investigated the accuracy of our method on datasets generated by varying settings in the INDELible software. We ran our method with default settings as described previously (window size
Table 2 shows results on 8 datasets, each consisting of 10 inputs. The first part of the dataset name denotes the overall tree depth, with slow using 0.02, medium 0.05, and fast 0.1. Indels is a dataset with tree depth 0.05 and insertion and deletion rate set to 10% of the substitution rate. The second part of the dataset name denotes the length of the ancestral sequence, 10 kB or 1 MB. Results are averaged over 10 inputs in each dataset.
The measured error values on several artificial datasets.

Lower values are better.
Abbreviations: SWFM, spaced word frequencies method; SWSPM, sliding window spectral projection method.
On datasets without indels, the results of our method are very similar to SWFM. On datasets with slow mutation rates, our method has a slightly higher
Overall, our method has performed well on the artificial datasets, although these are in some sense most difficult for our method, because the simulation starts from a random ancestral sequence, and as a result, does not contain nonrandom patterns and periodicities typical for real biological sequence. Therefore, even if our results on datasets with indels were not as good as for SWFM, we will see that on real datasets, which include indels, our method usually performs better.
Running time and memory
We have measured the running time and memory of various methods on artificial inputs consisting of sequences of length 1 MB with substitution frequency varying between 0.04 and 0.3 without indels and rearrangements. Tables 3 and 4 show the results for the number of species
Time (s) of compared methods to process datasets of various sizes.

Abbreviations: FSWM, filtered spaced words matches; SWFM, spaced word frequencies method; SWSPM, sliding window spectral projection method; WFM, word frequencies method; YSMM, (Yin) signal moments method.
Memory requirements (MB) of compared methods to process datasets of various sizes.

Abbreviations: FSWM, filtered spaced words matches; SWFM, spaced word frequencies method; SWSPM, sliding window spectral projection method; WFM, word frequencies method; YSMM, (Yin) signal moments method.
Implementation runs under JVM. Actual memory usage can be lower.
Some of the tested methods cannot run in parallel. To provide a fair comparison, each method was tested in a forced single-core mode. Our SWSPM is based on the sequence projection architecture and therefore is scalable up to
Results on real data
Mammalian mitochondrial genomes
This dataset contains mitochondrial genomes of 31 mammals, and it was obtained from the supplementary materials of the work by Hoang et al. 25 To meaningfully compare results with the YSMM, which is sensitive to sequence length, we have truncated all input sequences to the same length of 16 000 bp. The reference results were obtained by conventional alignment methods. In particular, we have constructed a multiple-sequence alignment using the MUSCLE algorithm 38 hosted as a Web service at the European Molecular Biology Laboratory (https://www.ebi.ac.uk/Tools/msa/muscle/) and then we have applied distmat from EMBOSS package to create a distance matrix based on the number of substitutions in the multiple-sequence alignment. The reference tree was constructed from this matrix by the S-LINK method. The results, shown in Table 5, demonstrate very low error rates of the SWSPM method.
The measured error values on Mammals dataset.

Lower values are better.
Abbreviation: FSWM, filtered spaced words matches; SWFM, spaced word frequencies method; SWSPM, sliding window spectral projection method; WFM, word frequencies method; YSMM, (Yin) signal moments method.
Figures 3 and 4 show phylogenetic trees based on the results of YSMM and SWSPM methods on a modified Mammals dataset, which was enriched by a shortened 13 kbp long human sequence. Note that other tests and accuracy comparisons on this dataset do not use this shorter human sequence. The trees clearly show the effect of missing sequence length normalization in YSMM. The YSMM tree in Figure 3 differs from the tree from the original paper 25 because in our set, the genomes were truncated to common length of 16 kbp, whereas in the original publication, uneven lengths of sequences helped to arrange the species into the expected structure. The shortened human sequence is clustered together with the longer human sequence in SWSPM tree (Figure 4), but not in the YSMM tree.

Phylogenetic tree constructed by YSMM on a modified Mammals dataset with a shortened human sequence added. YSMM indicates (Yin) signal moments method.

Phylogenetic tree constructed by SWSPM on a modified Mammals dataset with a shortened human sequence added. SWSPM indicates sliding window spectral projection method.
Fungal mitochondrial and nuclear genomes
We have considered 2 datasets consisting of sequences from fungal genomes. The first dataset contains DNA sequences of 7 genes (namely ATP6, ATP8, ATP9, COB, COX1, COX2, and COX3) from mitochondrial genomes of 10 fungal species. The species were selected from a wider dataset used in the work of Valach et al 39 to be as dissimilar as possible. In particular, we have used Aspergillus niger, Candida zemplinina, Yarrowia lipolytica, Candida subhashii, Candida albicans, Candida neerlandica, Candida frijolesensis, Candida parapsilosis, Saccharomyces pastorianus, and Saccharomyces cerevisiae. The reference phylogenetic tree was built by PhyML 40 under the JTT model from protein sequences of these species, as described by Valach et al. 39
The second dataset again uses a subset of species from Valach phylogenetic tree,
39
but each species was represented by its full nuclear genome of the length 14 to 13 Mbp. Sequences were obtained from the National Center for Biotechnology Information (NCBI) database (https://www.ncbi.nlm.nih.gov/). We have used Aspergillus niger, Debaryomyces hansenii, Candida maltosa, Candida albicans, Candida dubliniensis, Candida sojae, Candida tropicalis, Candida parapsilosis, Saccharomyces pastorianus, and Saccharomyces cerevisiae. On this dataset, we have decreased the overlap parameter to
As is shown in Tables 6 and 7 and Figure 5, our method again performs very well on these datasets. Note that these 2 datasets differ widely: while the mitochondrial data set contains only short relatively well-conserved protein-coding sequences, the nuclear dataset contains full-length genomes with a wide variety of evolutionary changes including large-scale rearrangements. Figure 5 shows the phylogenetic tree constructed on the nuclear dataset. This tree almost perfectly matches the published tree obtained by traditional alignment-based methods, with the exception of one species.
The measured error values on the fungal mitochondrial genes.

Lower values are better.
Abbreviations: FSWM, filtered spaced words matches; SWFM, spaced word frequencies method; SWSPM, sliding window spectral projection method; WFM, word frequencies method; YSMM, (Yin) signal moments method.
The measured error values on nuclear fungal genomes.

Lower values are better.
Abbreviations: FSWM, filtered spaced words matches; SWFM, spaced word frequencies method; SWSPM, sliding window spectral projection method; WFM, word frequencies method; YSMM, (Yin) signal moments method.

Phylogenetic tree constructed by SWSPM on dataset of nuclear fungal genomes. A single badly placed species is underlined. SWSPM indicates sliding window spectral projection method.
Bacterial genomes
This dataset was previously used by Domazet-Lošo and Haubold
14
from where we also get the reference phylogenetic tree. Input sequences were obtained from the NCBI database. Table 8 shows that our method achieves results similar to WFM, SWFM, and better than YSMM. Compared to our method, FSWM and Andi achieved higher accuracy; however, their running time is much higher than our method. Also note that Kr could not be run on our machine due to some input error, so we could not calculate exact
The measured error values on the bacterial dataset.

Lower values are better.
Abbreviations: FSWM, filtered spaced words matches; SWFM, spaced word frequencies method; SWSPM, sliding window spectral projection method; WFM, word frequencies method; YSMM, (Yin) signal moments method.
HIV genomes
This dataset consists of 825 HIV strains from Wu et al
41
and it was also used by Domazet-Lošo and Haubold
14
For our method. we used default parameter settings (window size
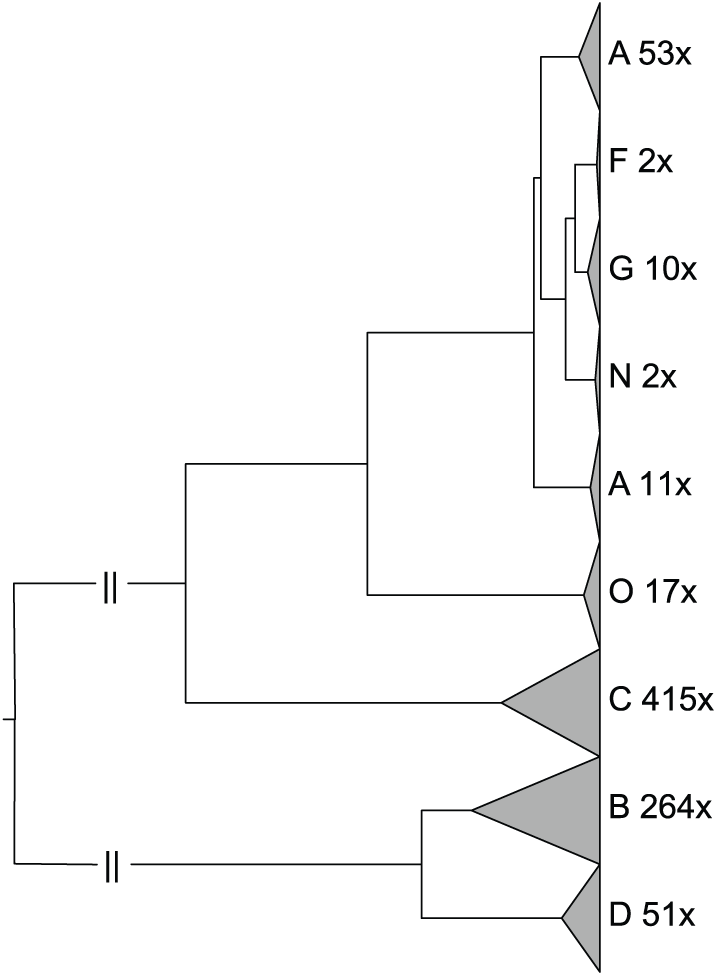
Phylogenetic tree constructed by SWSPM on 825 HIV genomes. SWSPM indicates sliding window spectral projection method.
Drosophila genomes
This dataset contains 12 different genomes of Drosophila.
43
Dataset was obtained from the download section of The UCSC Genome Browser (https://genome.ucsc.edu/index.html). The reference phylogenetic tree was taken from Haubold et al.
44
All contigs from one species were concatenated into one sequence and unknown bases were deleted. Due to high memory requirements and restricted memory of our testing machine (16 GB RAM), FSWM, YSMM, and Kr could not be run. Thus, the results of this dataset emphasize low memory requirements of our method. We could run Andi on this dataset only with usage of parameter
The measured error values on the Drosophila dataset.

Lower values are better.
Abbreviations: FSWM, filtered spaced words matches; SWFM, spaced word frequencies method; SWSPM, sliding window spectral projection method; WFM, word frequencies method; YSMM, (Yin) signal moments method.
Conclusions
We propose a novel method for evaluation of pairwise similarity of DNA sequences. The method is based on spectral transforms and proves viability of this concept by outperforming current state-of-art alignment-free methods in most scenarios, as shown in our experiments.
In the process of designing this method, we had considered numerous variants involving spectral transform type, DNA sequence representation type, window lengths, and overlap as well as completely different windowing schemes. The final combination performs well on a variety of data sets and takes into account various domain-specific data properties, such as varying sequence lengths and genome rearrangements.
Footnotes
Funding:
The author(s) disclosed receipt of the following financial support for the research, authorship, and/or publication of this article: This work was partially supported by the Scientific Grant Agency of Slovak Republic grant VEGA 1/0458/18 and the Slovak Research and Development Agency grant APVV-16-0484.
Declaration of conflicting interests:
The author(s) declared no potential conflicts of interest with respect to the research, authorship, and/or publication of this article.
Author Contributions
ML and TF have conceived the study and designed the algorithms. BB have provided her biological knowledge and experience in designing experiments. TF and JS have implemented the software and conducted the experiments. All authors have participated in manuscript preparation and design of experiments. All authors read and approved the final manuscript.