
Abstract
The patchy distribution of genes across the prokaryotes may be caused by multiple gene losses or lateral transfer. Probabilistic models of gene gain and loss are needed to distinguish between these possibilities. Existing models allow only single genes to be gained and lost, despite the empirical evidence for multi-gene events. We compare birth-death models (currently the only widely-used models, in which only one gene can be gained or lost at a time) to blocks models (allowing gain and loss of multiple genes within a family). We analyze two pairs of genomes: two E. coli strains, and the distantly-related Archaeoglobus fulgidus (archaea) and Bacillus subtilis (gram positive bacteria). Blocks models describe the data much better than birth-death models. Our models suggest that lateral transfers of multiple genes from the same family are rare (although transfers of single genes are probably common). For both pairs, the estimated median time that a gene will remain in the genome is not much greater than the time separating the common ancestors of the archaea and bacteria. Deep phylogenetic reconstruction from sequence data will therefore depend on choosing genes likely to remain in the genome for a long time. Phylogenies based on the blocks model are more biologically plausible than phylogenies based on the birth-death model.
Introduction
The need for models of gene content
Some genes are patchily distributed over the prokaryote phylogeny. This pattern can be explained either by the presence of these genes in a common ancestor, followed by multiple gene losses, or by lateral transfer (Boucher et al. 2003). Here, we develop probabilistic models for the number of genes in gene families, and use these models to estimate the rates of gene loss and lateral transfer. Knowing these rates will help us to decide whether multiple gene loss or lateral transfer is a better explanation for the observed distribution of genes.
A gene family is defined as all the genes in a genome that belong to a group of repeated sequences (Graur and Li, 2000, p. 264). These sequences ultimately derive from a common ancestor, either by duplication or by lateral transfer from another lineage. All genes in a genome may have been descended from a single ancestral sequence in the distant past, so in practice, we (either implicitly or explicitly) choose a divergence time beyond which genes are placed in different families. One might divide the data into many small families to resolve close relationships, or few large families to resolve distant relationships. Different levels of family resolution do not always give compatible trees (Hughes et al. 2005), although this may be simply due to noise. Here, we use gene families from the COG (Clusters of Orthologous Groups of proteins) database (Tatusov et al. 2003). We chose the COG database because it has been used for several other gene-content-based phylogenies, allowing us to compare our results with those from other methods. In the COG algorithm, families are identified based on three-way sets of mutual best hits (Tatusov et al. 1997). Three-way best hits do not depend on the absolute similarity between sequences, which should reduce the effects of variation in evolutionary rates on gene family identification. However, this approach cannot identify gene families that occur in fewer than three genomes.
Previous attempts to estimate the rates of gene loss and lateral transfer have usually relied on parsimony analysis of the presence and absence of gene families. For example, Kunin and Ouzounis (2003) assigned ancestral gene states to internal nodes on a phylogeny, assuming equal penalties for gain and loss of genes. If the difference between the number of gains and losses required to explain the pattern of gene content in descendants of a node was larger than an arbitrary threshold, they assigned family presence to the node. If it was less than another arbitrary threshold, they assigned family absence to the node. Ambiguous cases were resolved by assuming that the ancestral state of every family was absence, and that the appearance of new families should be delayed as long as possible, moving from the root to the leaves of the tree. There are major problems with this approach. First, the number of events will be underestimated (Hao and Golding, 2004). If a gene family has the same state in two sister taxa, Kunin and Ouzounis (2003) assume that the family had this state in the common ancestor of the taxa. Cases of inparalogy sensu Sonnhammer and Koonin (2002), in which parallel gene gains occurred in sister taxa, will not be dealt with correctly. Second, the penalties for gain and loss cannot be estimated from the data, but must be fixed in advance. This is a major problem, given that these are the events we are interested in. Other parsimony-based methods have used different criteria for deciding on gain and loss penalties. For example, Mirkin et al. (2003) and Boussau et al. (2004) chose penalties that gave plausible metabolic pathways in reconstructed ancestors. Since there is no way to determine whether one set of penalties is significantly better than another for a given data set, we cannot make a choice between penalties chosen using different external criteria. Third, the thresholds for assigning family presence and absence to nodes are arbitrary. Kunin and Ouzounis (2003) used an ad-hoc method to estimate one of these thresholds, and fixed the other without reference to any data. Fourth, different ways of resolving ambiguous internal states give different results (Boussau et al. 2004), and the choice of one resolution is arbitrary. Fifth, this method ignores uncertainty in the assignments of internal states. Unobserved data on internal nodes are treated in exactly the same way as observed data in extant taxa. In reality, the probability of correct reconstruction can be low when the rates of change between states are large (Maddison, 1995).
All of these problems can be solved by using maximum likelihood methods with an explicit model for gene gain and loss. Under a likelihood approach, multiple and parallel changes are not ignored. If two sister taxa each have 10 members of a gene family, we do not assume that their common ancestor also had 10 members. If the two taxa are closely related, it is most likely that there have been few deletions and duplications, so the genes will probably be orthologs related by speciation. On the other hand, if the two taxa are distantly related, many independent changes may have occurred and the genes may be inparalogs sensu Sonnhammer and Koonin (2002). Gain and loss parameters are estimated from the data, rather than from arbitrary criteria. We can then use statistical methods to test hypotheses about these parameters. Uncertainty in internal states is not ignored. Instead, the likelihood is summed over ancestral states weighted by their probabilities.
There have been several attempts to develop explicit models for gene gain and loss. Huson and Steel (2004) derived a maximum likelihood distance for gene presence/absence data from a simple model for the number of genes in a genome. In their model, new genes are acquired at a constant rate, and existing genes are lost at a constant rate per gene, the same for all genes. They showed that both Dollo parsimony and their maximum likelihood distance outperformed the distance measure used by Snel et al. (1999) in phylogeny estimation from simulated data. It is not easy to estimate the rate of lateral transfer from presence/absence data, because we cannot distinguish between the evolution of a new gene and the acquisition of a gene by lateral transfer. However, if we assume that the evolution of new genes is rare, then maximum likelihood can be used with presence/absence data to estimate the rate of lateral transfer and gene loss (Brian Golding and Weilong Hao, McMaster University, personal communication).
Data on the number of members of a gene family could give more information on the rates of gene gains, losses and transfers. As far as we know, all existing models of gene content that count the number of members of gene families use birth-death models (Gu, 2000; Gu and Zhang, 2004; Zhang and Gu, 2004; Arvestad et al. 2003, 2004; Karev et al. 2004; Felsenstein, 2004; Hahn et al. 2005). In these models, the number of genes in a family can increase or decrease by the deletion or duplication of one gene at a time. This is unrealistic, because there is strong empirical evidence that multi-gene events can occur. For example, duplications of blocks of three to four genes (the typical operon size) are common in prokaryotes (Gevers et al. 2004). The γ-proteobacterium Vibrio vulnificus apparently gained 495 genes in 260 duplication events, when compared to its close relative V. cholerae (Chen et al. 2003). It is almost certainly possible to transfer or delete more than one gene at a time. In E. coli, the average gene is 1kb. Among closely related strains, the average acquired segment is 8.3 kb, and the average deletion is 6.4 kb (Ochman and Jones, 2000). Similarly, detected deletions among clinical clones of Mycobacterium tuberculosis contained an average of 4 open reading frames (Kato-Maeda et al. 2001). Detected insertions (apparently acquired by lateral transfer) contained between 2 and 36 open reading frames (ORFs), and detected deletions contained between 2 and 24 ORFs (Ochman and Jones, 2000). If the fixation of laterally transferred genes in local subpopulations depends on selection, and several genes are needed to perform a particular function, a transfer of all the required genes at once would be more likely to be fixed than a transfer of only one of the genes (Boucher et al. 2003, p. 319). Here, we compare the fit of a birth-death model to real data on pairs of prokaryote genomes with that of models allowing multi-gene events (blocks models). We show that blocks models are a better description of the data for two closely-related E. coli strains, and for the distantly-related pair A. fulgidus (archaea) and B. subtilis (gram-positive bacteria).
If genes may appear (by evolution from other sequences, duplication, or lateral transfer) and disappear (by deletion) from genomes, any single gene is unlikely to have been present in a lineage for its entire history. We can think of this using the ‘rope metaphor’ for a genome (Zhaxybayeva and Gogarten, 2004): there may be no single fiber (gene) running the entire length of the rope, yet the rope itself (the organismal lineage) is continuous. If we know the rates of appearance and disappearance of genes, we can estimate the expected residence time of a gene in the genome of a lineage. This tells us how far back in time we might be able to reconstruct the history of an organism from a single gene. We calculate residence times for the E. coli strains and for A. fulgidus and B. subtilis. We then use the estimated divergence times between pairs of taxa to estimate a least-squares phylogeny for 66 sequenced genomes in the COG database.
Unobservable data
For nucleic acid or protein sequences, all states are observable in extant taxa. In contrast, a gene family that is absent from every taxon in the data set may not be observable. One way to solve this problem is to calculate likelihoods conditional on a gene family being observable (Gu, 2000). However, a gene family does not appear in the COG database unless it is present in at least three taxa. A gene family present in both members of a pair is not necessarily observable, and a gene family absent from both members of a pair is not necessarily unobservable. It is therefore difficult to use the conditioned likelihood approach when estimating pairwise maximum likelihood distances. Instead, we used a locally-weighted least-squares method to impute the numbers of unobserved gene families for each pair of taxa, as described in the methods.
General form of the models
We make two key assumptions, family independence and a finite number of states, that allow us to model the dynamics of gene family size as a finite-state continuous-time Markov chain.
A realistic model for genome evolution would allow multigene events to affect members of more than one family, whenever genes from two or more families were adjacent on the genome (Felsenstein, 2004, page 515). Such a model would have to specify which genes are adjacent to each other, and would not treat each family independently. Functional relationships could also introduce dependencies, whether genes were adjacent or not. Both processes result in dependence across the entire genome. Thus, the number of possible states would be the number of different ordered genomes. When calculating the likelihood, we would have to sum over all possible states at the root (Equation 1, below). This becomes unfeasible as the number of possible states gets very large. Probabilistic models of gene order exist (Miklós, 2003) but are too complicated to use for phylogenetic inference. Adding changes in gene content will make this worse, as well as requiring more parameters and assumptions. Treating families as independent seems necessary if unrealistic. As far as we know, all existing probabilistic models for gene content make this assumption (Gu, 2000; Gu and Zhang, 2004; Arvestad et al. 2003, 2004). Fortunately, the consequences of assuming family independence are unlikely to be severe. Our models describe the dynamics of a single gene family. The parameter estimates therefore depend on the marginal distribution of gene family size within a family, not the joint distribution across gene families. This marginal distribution is unaffected by dependencies among families. We can think of dependencies among gene families as reducing the number of independent observations. Asymptotically, this will affect the variances but not the means of the parameter estimates. Since we have large numbers of data, the small-sample bias introduced by the incorrect variance is unlikely to be large. An analogous situation occurs in RNA evolution. Base pairing introduces strong dependence between sites, but treating sites as independent does not significantly reduce the accuracy of phylogeny estimation by likelihood (Tillier and Collins, 1995).
In principle, the number of genes in a family can take any non-negative integer value. Nevertheless, most gene families have only a few representatives in a given genome (Huynen and van Nimwegen, 1998). To simplify the calculation of likelihoods, we will use k + 1 states, corresponding to [0,1,2,3,… k – 1,≥ k] genes. We will make k large enough that the k th state is rarely reached, so the errors due to truncation will be small. Over the whole COG database, there were 83675 cases where a gene family was present in a species. Of these, only 320 (0.4%) were cases of families with more than 20 members. We therefore choose k = 20. We also did preliminary experiments using k = 10, with similar results.
Given these two assumptions, our models can be based on a matrix


In Equation 1, the summation is over all possible ancestral states i. This allows us to deal correctly with inparalogy. Figure 1 illustrates this for a single gene family in a hypothetical case (using the blocks model described below, with parameters other than edge lengths from Table 3). Two sister taxa, each with 10 genes in the family, are connected to a common ancestor by edges of length t. The conditional probability of an ancestral state h is Conditional probabilities of each possible ancestral state, given 10 members of a gene family in two taxa, each separated from a common ancestor by an edge of length 0.01 (a) or 1 (b) expected changes. Calculated under the blocks model with parameters (other than edge lengths) from Table 3.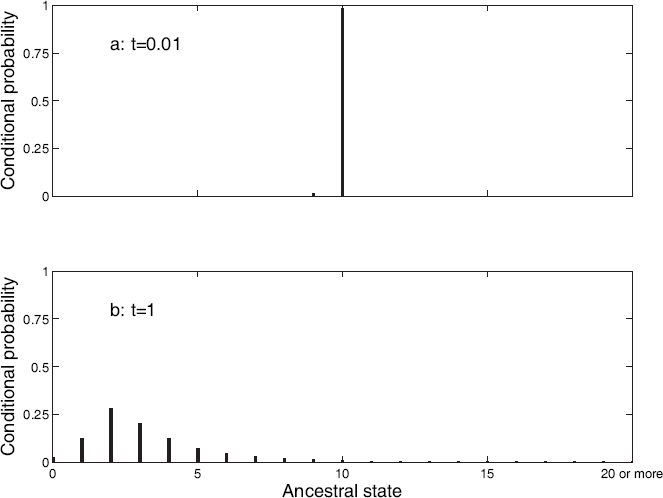
The processes by which gene content may change are deletion, duplication, lateral transfer, and innovation (the evolution of a new member of a gene family from an existing sequence). Since the set of taxa under study is much smaller than the set that could have given rise to transfers, we assume that lateral transfers always come from a taxon other than the pair of taxa we are analyzing. We now consider some specific models.
Birth-death models
In a birth-death model, we assume that one gene can be duplicated or deleted at a time. In the standard form of this model (Kendall, 1948), we assume that each gene has independent and equal probabilities of deletion (f) and duplication (g). Thus

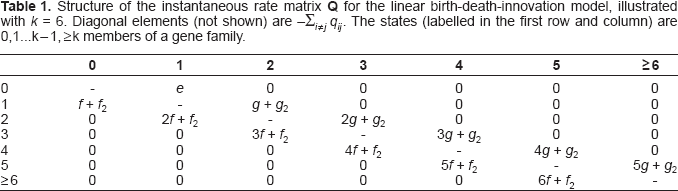
Structure of the instantaneous rate matrix Q for the linear birth-death-innovation model, illustrated with k = 6. Diagonal elements (not shown) are
Blocks models
In a blocks model, we divide the
Structure of the instantaneous rate matrix Q for the blocks model, illustrated with k = 6. Diagonal elements (not shown) are

For the blocks model, d provides a direct estimate of the rate of acquisition of more than one member of a family by lateral transfer, when we are acquiring more genes than could be added by duplication or innovation.
Model comparison
The blocks model has 13 parameters. The birth-death model has only five, and can be obtained from the blocks model by setting a, b, b2, c, c2 and d to zero, and h to f + f2. The blocks model can never be a worse description of the data than the birth-death model. We therefore need to establish that the improved fit of the blocks model is statistically significant. To do this, we use likelihood-ratio tests (for a review of likelihood ratio tests in phylogenetics, see Huelsenbeck and Crandall, 1997).
Two models are nested when the simpler model is a special case of the more complex one (as in our situation). If the simpler model is the true model, the extra parameters in the more complex model are unnecessary and will give only a small improvement in fit. In most such cases, twice the log likelihood ratio has a distribution approaching
The number of parameters we are estimating is not large, given that we have 4873 gene families, each with 21 possible states. For comparison, the General Time-Reversible model of nucleotide substitution has 8 parameters plus edge lengths, but these must be estimated from data with only four states. Amino acid substitution matrices typically require 189 parameters to model 20 possible states, and require very large databases for reliable estimation. It is often the case that even complex models do not fit phylogenetic data well, but this is not a major problem (Huelsenbeck and Crandall, 1997). We are interested in knowing whether a more complex model is a significantly better description of the data, even though we cannot capture all the details of the evolutionary process.
Results
E. coli data
Parameter estimates for E. coli strains K12 and 0157:H7 EDL933. Q matrix parameters are scaled so that the expected number of events per unit time is 1, and edge lengths t1 (from the root to K12) and t2 (from the root to 0157:H7 EDL933) are in expected numbers of events per gene family. Parameters that were constrained to be zero are indicated by -. In the birth-death model, h was constrained to be f + f2.


Performance of blocks and birth-death models for two E. coli strains K12 and 0157:H7 EDL933 (a: blocks model, b: birth-death model) and for Archaeoglobus fulgidus and Bacillus subtilis (c: blocks model, d: birth-death model). The data are
In the blocks model, the estimated rate of lateral transfer of more genes than could be acquired by duplication or innovation (d) was three orders of magnitude lower than the estimated rate of acquisition of new gene families (e). Setting d to zero did not significantly reduce the likelihood (–2Δ log L = 1.10, tested against
For both models, the predicted marginal distributions of gene family size in single species were quite close to the observed distributions (Figure 3a). For the E. coli data, the expected residence time of a gene was 0.60 under the blocks model. The distribution was strongly right-skewed, with a median of 0.33, a maximum of 9.06, a 95th percentile of 2.13 and a standard deviation of 0.76. 91% of simulated genes had residence times greater than the mean of t1 and t2 (0.04, the mean number of events separating one of the two strains from their common ancestor).
Marginal distributions of gene family size for single species. Symbols are the imputed counts used as data, and lines are predictions from the stationary distributions of the models, with parameters estimated from pairs of species. a: E. coli strains K12 (circles) and 0157: H7 EDL933 (squares), b: Archaeoglobus fulgidus (circles) and Bacillus subtilis (squares). In both panels, the blocks model is the solid line and the birth-death model is the dashed line. The vertical axis is on a logarithmic scale, so we use (frequency+1) to allow zero frequencies to be represented.
A. fulgidus and B. subtilis data
Parameter estimates for A. fulgidus and B. subtilis. Q matrix parameters are scaled so that the expected number of events per unit time is 1, and edge lengths t1 (from the root to A. fulgidus) and t2 (from the root to B. subtilis) are in expected numbers of events per gene family. Parameters that were constrained to be zero are indicated by -. In the birth-death model, h was constrained to be f + f2.

In the blocks model, d was seven orders of magnitude lower than e, and could be set to zero without significantly reducing the likelihood (likelihoods were the same to four decimal places). As with the E. coli data, models without any multiple gene losses (–2Δ log L = 13.71, conservative test using
For A. fulgidus and B. subtilis, the expected residence time was 0.48 under the blocks model. Again, the distribution was right-skewed (median 0.34, maximum 3.71, 95th percentile 1.44, standard deviation 0.48). 42% of simulated genes had residence times greater than the mean of t1 and t2 (0.43 for these species).
Model comparisons over all pairs of taxa
Over all 2145 pairs of taxa from the COG database, 95% had −2Δlog L ≥ 9. The median −2Δlog L was 85, and the range was 0 to 522. Thus, although the E. coli pair had the largest likelihood ratio (by chance: we did not know this in advance), the blocks model was substantially better than the birth-death model for most pairs.
Phylogenies
We found three equally good least-squares trees based on distances from the birth-death model, but the only difference between them was in the arrangement of subgroups around zero-length edges within a clade containing parasitic/endosymbiotic α – and γ - proteobacteria, chlamydiae, spirochaetes, and mycoplasmas. The tree (Figure 4) is biologically implausible, placing Methanosarcina acetivorans (Archaea) with the cyanobacteria. M. acetivorans might be misplaced because it has an unusually large genome for an archaeon, perhaps due to the presence of retrointrons transferred from bacteria (Rest and Mindell, 2003). The three eukaryotes (Encephalitozoon cuniculi, Saccharomyces cerevisiae, and Schizosaccharomyces pombe) form a clade within the bacteria, perhaps because of mitochondrial genes transferred to the nucleus. Given these obvious problems, we do not discuss the trees from the birth-death model further. In contrast, the single best least-squares tree based on distances from the blocks model (Figure 5) has each of the three kingdoms as a monophyletic group.
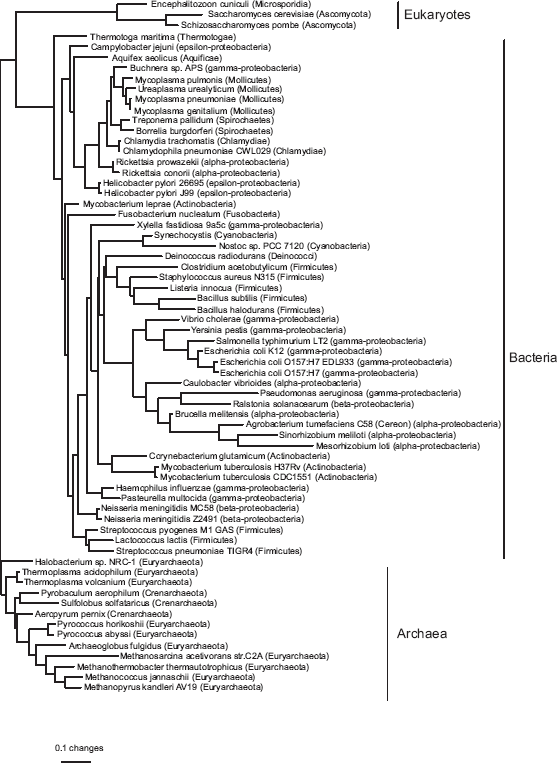
Phylogeny based on birth-death distances for all 66 genomes in the COG database, estimated by least squares with inverse square weighting (three equally good topologies were found, but they differed only in the arrangement of clades separated by zero-length edges). The tree is rooted with all the archaea except Methanosarcina acetivorans as an outgroup. Edge lengths are expected numbers of gene events per gene family. The weighted sum of squares was 830. Phylogeny based on blocks model distances for all 66 genomes in the COG database, estimated by least-squares with inverse square weighting. The tree is rooted with the archaea as an outgroup. Edge lengths are expected numbers of gene events per gene family (note the difference in scale from Figure 4). The weighted sum of squares was 157.
Two other published phylogenies have been based on subsets of the same data: Wolf et al. (2002) used pairwise Jaccard distances among the 58 genomes then available, while Gu and Zhang (2004) selected 35 genomes and calculated distances based on a birth-death model. Like our tree from the blocks model, both have a clade containing parasitic and endosymbiotic bacteria with small genomes: the parasitic α - proteobacteria Rickettsia spp., chlamydiae (Chlamydia trachomatis, Chlamydophila pneumoniae), spirochaetes (Treponema pallidum and Borrelia burgdorferi), mycoplasmas (Mycoplasma spp. and Ureaplasma urealyticum), and the endosymbiont γ- proteobacterium Buchnera. This clade is probably an artefact resulting from parallel loss of genes that are unnecessary for parasites (Wolf et al. 2001). Dealing with this artefact may require mixture models, in which different subsets of the data have different edge lengths.
Discussion
There are many fundamental improvements that can be made to models of gene content, such as including gene order (Miklós, 2003) or nucleotide substitions (Arvestad et al. 2004). Unfortunately, these are usually very difficult. Here, we have shown that large improvements in likelihood over the widely-used birth-death models can be achieved by allowing multi-gene events, a change that is both simple and biologically reasonable. Our analyses show strong evidence that duplications and deletions of multiple genes are possible. This is not surprising, since we know that rearrangements of multiple genes occur in nature (Deng et al. 2003). The physical arrangement of the E. coli genome also suggests multi-gene events have occurred. For example, E. coli 0157:H7 EDL933 has two identical copies of a 106-gene island (Perna et al. 2001), which are unlikely to have arisen by repeated single duplications. Since the birth-death model does not allow multi-gene events, it is unlikely to be the best model for the evolution of gene content. This has been suggested elsewhere (Hahn et al. 2005), but we are not aware of any other models that address the problem. We assumed that the number of units on which events can operate to produce a transition from state i to state j is
For both pairs of taxa that we studied in detail, the estimated rate of lateral transfer of more genes from a single family than could be acquired by duplication or innovation was not significantly greater than zero. There is other evidence of lateral transfers into E. coli. For example, of 108 islands larger than 1kb present in E. coli 0157:H7 EDL933 but absent in E. coli K12, at least 84% had atypical base composition, which may suggest they are recent lateral transfers (Perna et al. 2001). Nevertheless, these events might only rarely transfer multiple genes from the same family. Alternatively, our assumption of a constant rate for all numbers of transferred genes might be unrealistic. The distribution of detected additions in E. coli strains has its mode in the 5kb (approximately 5-gene) category, with much lower rates for longer sections of DNA (Ochman and Jones, 2000, their figure 2). With a single rate for all numbers of transferred genes, we might underestimate the rate of transfer of small numbers of genes. Our models do not allow us to estimate the rate of lateral transfers of single genes, because we cannot separate such events from duplications and innovations. Nevertheless, the transition rate e from state 0 to state 1 was not negligible relative to other transitions (in both cases, about 1/5 of the rate of deletion of entire gene families). This transition can only happen by innovation or lateral transfer. If we believe that innovations are rare events, then e not being negligible is consistent with the widely-held view that lateral transfers of single genes are frequent. Brian Golding and Weilong Hao (McMaster University, personal communication) analyzed presence/absence data for closely related species of bacteria using conditional maximum likelihood on a known tree. They also found that the rates of gain and loss of gene families were substantial. However, most gene family sizes do not vary greatly among strains within species (Pushker et al. 2004), so the rate of lateral gene transfer may not be so high that vertical inheritance and gene duplication are unimportant.
The estimated edge lengths for A. fulgidus and B. subtilis under the blocks models were an order of magnitude greater than for the E. coli strains. This is expected as A. fulgidus and B. subtilis are from different kingdoms. More interestingly, the sum of edge lengths increased more under the birth-death model for A. fulgidus and B. subtilis than for the E. coli strains. When only single-gene events are allowed (as in the birth-death model), a large number of events are required to explain families with multiple members in one taxon and no members in another. As a result, the sum of edge lengths was much greater for the birth-death tree for all taxa (30 expected events per gene family) than for the blocks model tree (9 expected events per gene family). For both models, the poor prediction of families present in only one of A. fulgidus and B. subtilis suggests that the evolutionary process might not be homogeneous over large time intervals. This is supported by the fact that we only found optimization problems for pairs of taxa from different kingdoms. It is difficult to construct non-homogeneous phylogenetic models. In principle, we could have different rate parameters on every edge (Galtier et al. 1999), but we would need very large numbers of data to get good estimates. If we can identify groups of taxa (such as archaea and bacteria) with different rates a priori, we could have a small number of different rate matrices. Distances based on the logdet transformation do not require the assumption of homogeneity, and have been applied to gene content data (Lake and Rivera, 2004; Rivera and Lake, 2004), but do not provide parameter estimates for rates of gene gain and loss.
For birth-death-innovation models allowing only single-gene events, the mean time required for formation of the largest observed gene families is unrealistically high compared to the time available for the evolution of life (Karev et al. 2003, 2004). These authors suggest that the minimum rather than the mean time necessary for evolution of the largest observed gene families is the relevant statistic, and that the minimum time may be realistic for some models with nonlinear relationships between rates and family sizes. Another explanation is that multigene events have been important in the formation of large gene families.
For both pairs of taxa that we studied in detail, the median residence time for a gene under the blocks model was around 0.33 gene events. The distance between the last common ancestor of the bacteria and the last common ancestor of the archaea on the blocks model tree was 0.19 gene events. Furthermore, extant taxa are typically quite far from either of these last common ancestors. For example, the maximum likelihood distance between A. fulgidus and B. subtilis under the blocks model was about 0.4 gene events. Deep phylogenetic reconstruction from sequence data therefore depends on picking genes with long residence times, rather than using a large number of randomly selected genes. Phylogeneticists already do this to some extent, because genes with short residence times are less likely to be present in every sampled taxon than genes with long residence times. Adding rate variation among gene families to the blocks models would allow more accurate residence time calculation, and would help to identify families with long residence times. It is likely that these families will include the information transfer and central metabolic genes often thought of as the core genes (Lawrence and Hendrickson, 2003). Rate variation among gene families will also be important to deal with selection for large numbers of genes in some families.
Our phylogeny based on evolutionary distances from the blocks model showed many similarities to phylogenies based on distances from a birth-death model (Gu and Zhang, 2004) and from Jaccard distances (Wolf et al. 2002). Despite not being based on an evolutionary model, the Jaccard distance tree did not appear less biologically reasonable. All three trees shared a common weakness: parasites and endosymbionts with reduced genomes tended to be grouped together. This is probably a consequence of parallel evolution. The same genes are likely to be lost in many parasites and endosymbionts, because of the similar environments they inhabit. Such patterns require models that allow evolutionary rates to vary in different ways over time as well as between gene families: the genome equivalent of heterotachy (Lopez et al. 2002). Interestingly, trees based on the distances used in the SHOT web server (Korbel et al. 2002) do not have a problem with the placement of parasites and endosymbionts. This is because the distance measure used in SHOT assumes the shared absence of a gene is uninformative (which is probably true for parasites but not for other organisms). Methods that use normalized BLASTP scores, which take sequence similarity into account, also place the parasites and endosymbionts correctly (Gophna et al. 2005; Kunin et al. 2005). The good performance of SHOT distances and normalized BLASTP scores, which are not proper measures of evolutionary distance, suggests that the phylogenetic signal in whole genome data is far from saturation. A good modelling approach might therefore be to estimate a phylogeny using one of these simple methods, then fit more complex models on this phylogeny to estimate rates of gene gain and loss.
All three gene content trees (Wolf et al. 2002; Gu and Zhang, 2004, and our tree) misplaced Halo-bacterium, an archaeal species with many genes of bacterial origin. Two of the three trees (Wolf et al. 2002, and our tree) misplaced Thermotoga, a hyperthermophilic bacterium with many archaeal genes. It has been suggested that proper models of genomic evolution will be unaffected by lateral gene transfer (Lake and Rivera, 2004). We do not think this is true, because a taxon that acquired many genes by lateral transfer from the same source will tend to share the presence of genes with close relatives of that source.
Our tree based on the birth-death model was much less plausible than the birth-death-based tree of Gu and Zhang (2004). One possible explanation is that we modelled data on the number of members of each gene family, while Gu and Zhang (2004) modelled only absence, presence of one member, or presence of more than one member. It may be that the number of members of a gene family is not usually known accurately, and that aggregating into categories reduces the effect of unreliable data (Zhang and Gu, 2004). The way in which gene families are identified can also affect our ability to infer phylogenies. Hughes et al. (2005) showed that with presence-absence data, more stringent homology criteria for gene family identification gave better resolution for closely-related taxa, but retained less information about deep divergences. They also found that trees inferred from data with different homology criteria were not compatible, although this might be due to artefacts of parsimony.
In principle, we could use the blocks model for full maximum likelihood phylogenetic inference. One major benefit from this is that we might be able to allow different rates of evolution for different gene families. Rates-across-sites models typically give large improvements in likelihood for sequence data (Yang, 1994b), but cannot be identified from pairwise data alone. The blocks model is not reversible, so we would infer a rooted phylogeny. In practice, we expect estimation of the root location to be fairly inaccurate, as is usually the case for irreversible models of nucleotide evolution (Yang, 1994a; Huelsenbeck et al. 2002). A major difficulty with phylogeny estimation from gene content is that the absence of a family from the entire data set is not observable (Gu, 2000; Lake and Rivera, 2004). We used imputed counts to overcome this difficulty. Another approach is to condition on the probability that a family was present in at least three genomes, but calculating this probability would be very time-consuming. As far as we know, full maximum likelihood methods have only been used for gene content with very small sets of taxa (Zhang and Gu, 2004), and under a simplified conditional likelihood in which a gene family from the COG database was assumed to be observable only if present in at least one genome from the four under study.
Conclusions
We have demonstrated that multi-gene events are an important component of genome evolution. Our models have the potential to reveal the relative importance of gene loss and lateral transfer, can provide estimates of the rate of turnover in genomes, and may lead to improved phylogenetic estimation from gene content data.
Footnotes
Acknowledgements
This work was funded by the Genome Atlantic/Genome Canada Prokaryotic Genome Evolution and Diversity Project. E.S. is supported by the Natural Sciences and Engineering Council of Canada. We are grateful to Peter Cordes for computational support. David Bryant, Robert Charlebois, Brian Golding, Uri Gophna, Victor Kunin, Olga Zhaxybayeva and the Dalhousie Statistical Evolutionary Bioinformatics group made many helpful suggestions. Comments from Olivier Gascuel and two anonymous referees improved the manuscript.