
Abstract
In phylogenetic, the diversity measures as UniFrac, weighted UniFrac, and normalized weighted UniFrac are used to estimate the closeness between two samples of genetic material sequences. These measures are widely used in microbiology to compare microbial communities. Furthermore, when the sample size is large enough, very good results have been obtained experimentally. However, some authors do not suggest using them when the sample size is very small. Recently, it has been mentioned that the weighted UniFrac measure can be seen as the Kantorovich-Rubinstein metric between the corresponding empirical distributions of samples of genetic material. Also, it is well known that the Kantorovich-Rubinstein metric complies the metric definition. However, one of the main reasons to establish it is that the sample size is large enough. The goal of this article is to prove that the diversity measures UniFrac are not metrics when the sample size is very small, which justifies why it must not be used in that case, but yes the Kantorovich-Rubinstein metric.
Introduction
Phylogenetic is a field of biology that studies how organisms are related during evolution. The basic principle is that the members of an organism set that descend from the same ancestor share an evolutionary history. A problem in phylogenetic analysis is to determine similarities and differences between genetic material sequences. For example, the study of the degree of difference between two samples A and B of genetic material sequences. For this, the diversity measure UniFrac, 1 weighted UniFrac and normalized weighted UniFrac 2 have been used.
The above diversity measures are used by several authors in microbiology field to compare genetic material samples. For example, Frank et al 3 said the diversity measure UniFrac is used to check whether patients with inflammatory bowel disease present samples from different microbial communities to patients without the disease. According to Costello et al, 4 the weighted UniFrac and normalized weighted UniFrac are used to better understand the structure of the microbial community in skin sites and other body habitats between different individuals and at different times, and it is suggested that these trends may reveal how changes in the microbial cause or prevent diseases. Another application of these measures is given in Charlson et al, 5 which are used to compare the population of bacteria in the lungs and their relationship with the population of bacteria of the upper respiratory tract, the former in healthy individuals. On the other hand, Ley et al 6 said the diversity measure was used to measure the difference between bacterial communities in mice intestines, in order to test the effects of kinship and genotype diversity.
Moreover, from the theoretical point of view, diversity measures UniFrac give rise to other measures, for example, Chang et al 7 proposed a new weighting scheme assuming that the sequences are randomly distributed; this scheme is called weighted UniFrac adjusted variance (VAW-UniFrac) and it is proposed as an improvement of weighted UniFrac. Furthermore, the VAW-UniFrac measure is compared to the UniFrac and weighted UniFrac measures to determine which is more efficient. Chen et al 8 gave a generalization of the UniFrac diversity measures, this generalization is more usefulness to detect a set of biologically relevant changes than the UniFrac measure.
However, despite its practical application in the microbiology field, in Schloss, 9 it is mentioned that ‘A recent simulation study concluded that UniFrac is unsuitable as a distance metric and should not be used for multivariate analysis’ that means, it is not appropriate to use diversity measures UniFrac as metrics and they should not be used in multivariate analysis.
Recently, in Evans and Matsen 10 was mentioned that the weighted UniFrac measure is the classical Kantorovich-Rubinstein metric11–14 or Earth Mover Distance 15 between the corresponding empirical distribution of samples of genetic material on a phylogenetic tree. The above, under assumption that the sample size is large enough. In this way, McClelland and Koslicki 16 propose the earth mover distance UniFrac (EMDUniFrac) and an algorithm to compute it.
In this article, we proof that the original version of diversity measures UniFrac are not metrics but they are pseudosemimetrics. They satisfy the following definition.
Definition 1
Let
If
The above justifies why UniFrac measures can behave unexpectedly for small samples in multivariate data analysis, but it is not the case when the sample size is large enough. Thus, when the sample size is very small, it is recommended to use EMDUniFrac metric.
The rest of the work is developed as follows. In section “Rooted phylogenetic trees,” the necessary concepts will be given to define diversity measures. In section “Diversity measures UniFrac,” the three versions are defined: UniFrac, weighted UniFrac, and normalized weighted UniFrac, and we will show that they are pseudo-parametric; in this way, we prove that they are not metrics and how they are susceptible to small samples. In section “EMDUniFrac,” the UniFrac measures are estimated for some examples and they are compared with EMDUniFrac metric. Finally, some conclusions will be presented in section “Conclusions.”
Rooted Phylogenetic Trees
The diversity measures are calculated on a given phylogenetic tree. In this section, the concepts related to trees will be defined. They will be useful to address diversity measures UniFrac.
Basic definitions
Warnow
17
defines a tree as a connected graph without cycles. A rooted tree
The vertex
On the other hand, in a tree
Otherwise, Warnow
17
associated the parameter
Thus, the branch length
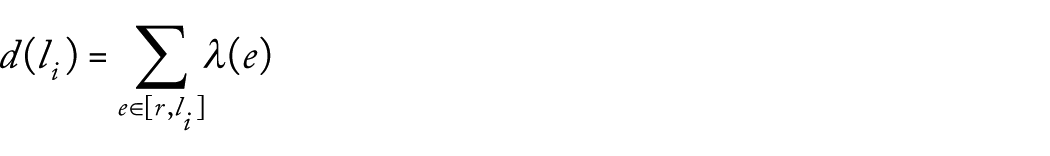
Let

We can see by the definition that
Definition 2
A matrix
Phylogenetic tree construction
To construct a binary rooted phylogenetic tree using two samples
Definition 3
A partial order is a binary relation
Transitivity:
Reflexivity:
Antisymmetry:
Two elements
Hasse diagram is a graphic scheme of a partially ordered set. To construct the Hasse diagram of a set, a vertex is created for each element of
Let
Now, we will construct the Hasse diagram by
The next theorem say that a binary rooted tree
Theorem 1
Let
In the next section, the diversity measures are addressed in their three versions, UniFrac, weighted UniFrac, and normalized weighted UniFrac. Also, we will show that they satisfy the pseudosemimetric definition and we will give examples where diversity measures do not satisfy the metric definition.
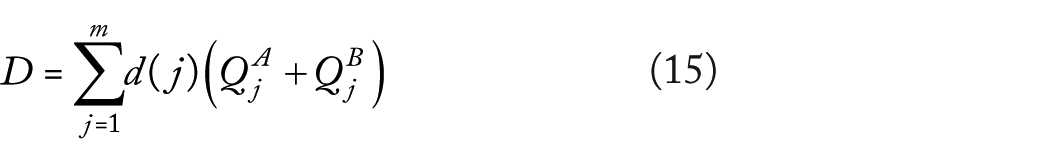
Diversity Measures UniFrac
To define the diversity measures UniFrac, it is considered a binary rooted phylogenetic tree
Let

note that they are the proportions of descendant sequences in samples
Example 1
Consider the rooted tree in Figure 1. It is constructed using samples

respectively. The second branch has the sequences

analogously, the proportions of descendant sequences in third branch are

(a) Tree for samples
In later examples, the sequences in leaf on the
UniFrac
The diversity measure UniFrac was proposed by Lozupone and Knight 1 and it is defined as

where
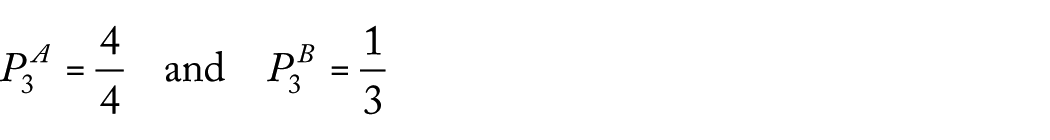
Example 2
Consider the raised tree in Example 1, with

thus,

The diversity measure UniFrac version ignores the abundant information about sequences, only consider its presence or absence in the branch.
Proposition 1
The diversity measure UniFrac is a pseudosemimetric.
Proof
We will prove that the diversity measure UniFrac satisfies Definition 1. Moreover, we will give an example where it does not satisfy the metric definition.
If

for all

therefore,

2. To prove symmetry, we consider

Then the diversity measure UniFrac satisfies Definition 1. Additionally, we will give an example that does not satisfy the metric definition.
Let

where

however, we supposed that l1 ≠ l2. So that if
2. We consider the samples

and the trees
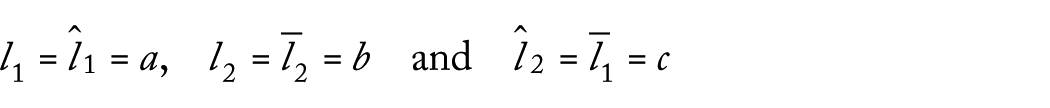
Moreover, suppose that


Tree for samples

(a) Tree for samples
If we estimate
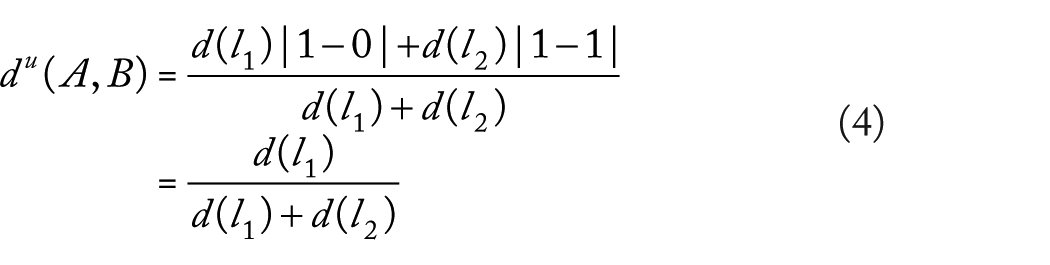

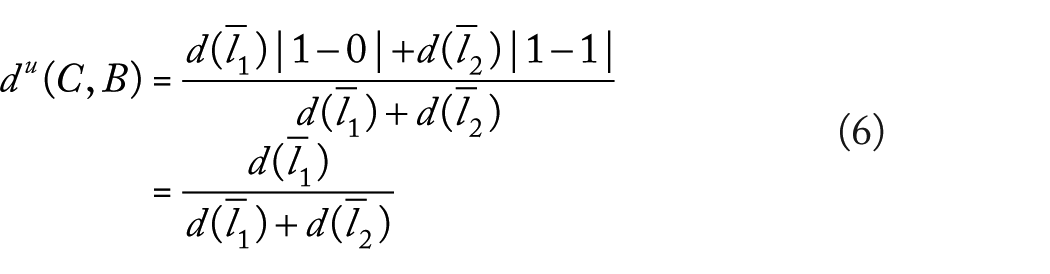
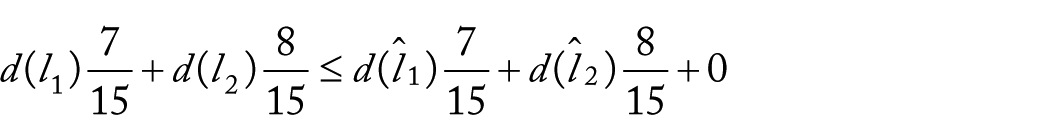
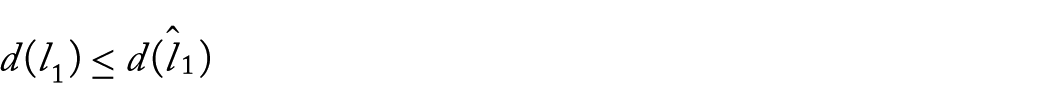
If the triangle inequality is satisfied and we considered expressions (4) to (6), we have that

where not necessary

It contradicts assumption (3). Then, triangle inequality is not satisfied.
Weighted UniFrac
The weighted UniFrac was proposed by Lozupone et al 2 and is denoted by

It uses information about the abundance of the genetic material sequences. If the branch has large length, it means a fast evolution, and it could influence more than other in
Proposition 2
The weighted UniFrac is a pseudosemimetric.
Proof
We will prove that the weighted UniFrac satisfies Definition 1.
If we suppose that

thus,

Therefore,

To prove symmetry, we consider

Then, the weighted UniFrac satisfies Definition 1, but it does not satisfy the metric definition. We show some examples
Consider the different samples

and the tree

Therefore,

with A ≠ B.
Consider the samples
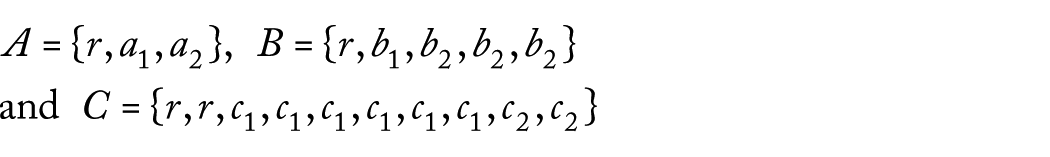
and the trees

and also, we assume


Tree for samples

(a) Tree for samples
From equations (8) and (9), we have that
If we estimate


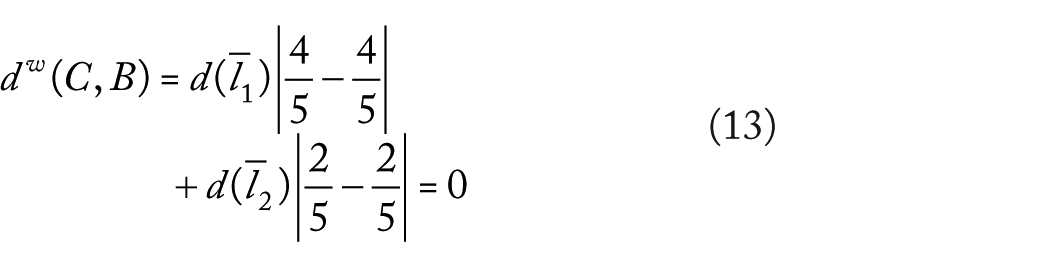
If the triangle inequality is satisfied, using equalities (11) to (13), we have
where we can get
this contradicts the supposition (10), so the weighted UniFrac does not comply with the triangle inequality.
We proved that weighted UniFrac satisfies Definition 1; however, it is not a metric.
Normalized weighted UniFrac
The normalized weighted UniFrac was proposed by Lozupone et al 2 and it is given by

where the normalizing factor is
with

where
Example 3
In Example 1,

and the sequences proportions in sample

The normalized weighted UniFrac is less sensitive to branches with a long length and is determined by branches with different proportions.
Proposition 3
The normalized weighted UniFrac is a pseudosemimetric.
Proof
We will prove that the normalized weighted diversity measure UniFrac satisfies Definition 1.
1. Analogous to 2. of Proposition 2, we have

2. To prove symmetry, we consider

Thus, the normalized weighted diversity measure UniFrac satisfies with Definition 1. Now, examples where it does not satisfy:
1. We consider the example in item (1) from Proposition 2. Therefore,

2. Consider the samples

and the trees

and additionally assume


(a) Tree by samples
Note that equations (17) and (18) imply that

Thus,


with

from we can get

it contradict the supposition (10). Therefore, the normalized weighted diversity measure UniFrac does not satisfy the triangle inequality.
We proved that normalized weighted diversity measure UniFrac is a pseudosemimetric. Next, we will give examples where we calculated the diversity measures UniFrac on a tree illustrate by McClelland and Koslicki 16 and we will compare with EMDUniFrac.
EMDUniFrac
Based on Evans and Matsen,
10
the EMDUniFrac is proposed in McClelland and Koslicki,
16
Given two samples

it represents the minimum amount of ‘work’ required to transform the distribution
Considerate the tree

Thus,

both under
It is important to mention the samples size is very small.
The weighted diversity measure UniFrac (see expression 7) on the tree

thus, can see that

Now, we obtain the normalized weighted UniFrac value as

Thus,

Therefore, the diversity measures UniFrac and EMDUniFrac are different between them. Then, we can say the diversity measures UniFrac are not equal to EMDUniFrac(P, Q) if the samples size is not large enough.
On the other hand, considerate the tree

however, samples
Conclusions
In this article, we prove that diversity measures UniFrac, weighted UniFrac, normalized weighted UniFrac satisfy the positive property, symmetry property, and the implication that if the samples are equal then the diversity measures are zero. On the other hand, examples were presented where the diversity measures mentioned do not comply the metric definition. We prove that diversity measures comply the pseudosemimetric definition.
Although measures UniFrac are used in microbiology as a tool to measure the proximity between samples of genetic material large enough and showing a good performance, as mentioned in the literature,3–7 when the sample size is small, no it is appropriate to use it in that sense. The previous thing due to the lack of the properties previously amended, as Schloss said. In section “EMDUniFrac,” we could see examples where the diversity measures UniFrac and EMDUniFrac are different between them; in this way, we can say the diversity measures UniFrac are not equivalent to EMDUniFrac if the samples size is not large enough. Furthermore, if we calculate the weighted UniFrac for two different small samples, it does not imply that weighted UniFrac is zero. Then an alternative for diversity measures UniFrac is the Kantorovich-Rubinstein metric 10 or EMDUniFrac metric.18–20
Footnotes
Acknowledgements
This article was developed under the Project PRODEP UV-PTC-779 of Mexico Government.
Funding:
The author(s) received no financial support for the research, authorship, and/or publication of this article.
Declaration of conflicting interests:
The author(s) declared no potential conflicts of interest with respect to the research, authorship, and/or publication of this article.
Author Contributions
JARA performed the analytic calculations and MLAG supervised the project. Both JARA and MLAG authors contributed to the final version of the manuscript.