
Abstract
Objectives
The aim of this study was to evaluate species-specific attitudes among veterinary professionals by comparing preferences, confidence, professional and personal experiences, and education related to cats and dogs, identifying disparities and potential contributing factors.
Methods
A 60-item survey was distributed electronically to members of an American veterinary medical college. Five key categories were assessed to compare cats with dogs: Confidence, Preference, Professional Experience, Personal Experience and Education. Responses were rated on a scale of 1–10. Data from 287 participants (faculty, staff and students) were analyzed using paired and independent sample t-tests to compare attitudes between species and potential influencing factors.
Results
Dogs were rated significantly higher than cats across all five categories. Confidence in working with cats (mean 8.17) was lower than with dogs (mean 8.76; P <0.001). Confidence with cats increased with experience, while confidence decreased with experience with dogs. Preference for cats (mean 4.80) was significantly lower than for dogs (mean 7.22; P <0.001). Personal and professional experiences, as well as education regarding cats, were also rated significantly lower (all P <0.001). Cat allergies were associated with reduced preference for cats, while dog allergies corresponded to increased confidence and experience with cats.
Conclusions and relevance
Veterinary professionals exhibit overall less favorable attitudes toward cats compared with dogs, particularly in confidence, preference and educational exposure. These disparities may negatively impact feline welfare. Professional experience with cats is correlated with increased confidence, suggesting that these opportunities should be increased in veterinary training. Allergy status may also have a role in determining attitudes and confidence with small animal species. Recognition of species-specific biases and understanding of potential contributing factors are critical for improving veterinary education and feline welfare.
Plain language summary
This study looked at how veterinary professionals feel about cats compared with dogs. Researchers wanted to understand if there are differences in confidence, preference, experience and education between the two species. They surveyed 287 people including faculty, staff, and students at a US veterinary college. Participants answered questions about five areas: how confident they feel working with cats and dogs, which they prefer, their professional and personal experiences, and how much education they had about each species. Responses were rated on a scale of 1–10. The results showed that dogs were rated more positively than cats in every category. People felt more confident working with dogs and preferred them over cats. Confidence in working with cats did improve with more hands-on experience; however, this was not the case for dogs. Preference for cats also increased with experience. More professional and personal experience was reported for dogs. This may be because cats do not receive as much veterinary care as dogs, limiting professional experience. Education regarding cats was felt to be less than that for dogs across all categories of people. Interestingly, people with cat allergies tended to prefer cats less, while those with dog allergies reported more confidence and experience with cats. This study suggests that veterinary training should include more opportunities to work directly with cats. Recognizing and addressing these biases is important for improving veterinary education and ensuring better care and welfare for cats.
Keywords
Introduction
There is a paucity of evidence regarding and comparing veterinary attitudes toward cats and dogs. Veterinary visits differ substantially between the species, with 82% of dogs visiting vets at least annually and only 40% of cats doing so.1,2 In the USA, average spending on veterinary visits in 2024 was $214 for dogs compared with $138 for cats. 3 This discrepancy has been attributed to many factors, including caretaker concerns about transport, patient stress and interference with the human–cat bond.4 –6 Feline caregivers may have a lack of awareness of feline health needs or have difficulty detecting illness owing to the subtle nature of clinical signs in cats7 –9 and experience stress caring for ill cats. 10 Other contributing factors include cost, geographic access, and the number of owned or semi-owned cats in the home.11 –13 Cat owners who perceive stress in their cats during veterinary visits may experience stress themselves. 14 Veterinary attitudes may affect this dynamic, as 14.6% of respondents in a survey reported that they changed veterinarians because they were upset by the veterinarians’ behavior toward their cats. 4 The authors hypothesized that veterinary professionals’ attitudes may be less favorable for cats compared with dogs, affecting feline care. They hypothesized that factors such as preferences, confidence, and professional and personal experiences contribute to attitudes toward these small animal species. They also hypothesized that education and experience could be influential. The authors developed this survey to evaluate and compare the attitudes of veterinary professionals toward cats and dogs and possible influencing factors.
Materials and methods
Approval from the Institutional Review Board was obtained for this human subjects research (protocol number 20-122 EX 2003).
In order to assess the hypothesis that veterinary attitudes differed between feline and canine patients, two parallel 30-item surveys were developed, resulting in an initial pool of 60 items. Questions were generated by the researchers across five key categories:
– Confidence: perceived confidence with the species, including working with pets in various emotional states, ability to accurately interpret pet body language and examination abilities.
– Preference: personal preferences to include favorite pet species, preferences for encounters and emotional responses to working with the species.
– Professional experience: clinical experiences with the species, including quantity of experience, quality of clinical encounters and outcomes, and prior work experience with the species.
– Personal experience: personal and interpersonal experiences pertaining to the species across one’s lifetime, including direct childhood experiences with pets and perceptions of pet owners.
– Education: perceived effectiveness of training, including impact of coursework, on-the-job training, mentors and professors.
Respondents were asked to rate their level of agreement with each statement from 1 (very low) to 10 (very high). The survey was distributed electronically via Qualtrics to members of an American veterinary medical college. Participation was anonymous and encouraged by an incentive gift card raffle; 287 responses were received from a broad cohort, including faculty (44 responses), staff (60 responses) and students (183 responses).
Data processing and analysis were conducted in Microsoft Excel and the Statistical Package for Social Sciences (SPSS; IBM) program. Separate confirmatory factor analyses were conducted for the feline and canine scales to examine the underlying factor structure and item performance. Based on factor loadings and measures of internal consistency, two items were removed from each scale to improve reliability, resulting in two final instruments of 28 items each (Table 1).
Surveys of attitudes toward cats and dogs

With acceptable internal reliability of each survey’s five subscales (see Tables 2 and 3 for Cronbach’s alpha and Pearson’s r coefficients), mean composite scores were calculated for each respondent by averaging their responses within each of the five dimensions of the feline and canine attitude surveys (Table 4). This produced average scores for Confidence with Cats, Confidence with Dogs, Preference for Cats and Preference for Dogs, among others, that could be analyzed according to respondent characteristics. Pairwise deletion was used to handle instances of participant non-respondence. In addition to examining skewness statistics, the normality of these composite scores was visually assessed using histograms and Q-Q plots. Assumptions were generally met for the use of paired and independent sample t-testing. Paired sample t-testing was used to directly compare attitudes between canine and feline patients within respondents, while independent sample t-tests were used to assess differences in specific attitudes among groups of respondents (ie, differences in preference between respondents with allergies vs those without allergies). In instances where Levene’s test for equality of variance was significant in independent samples testing, adjusted
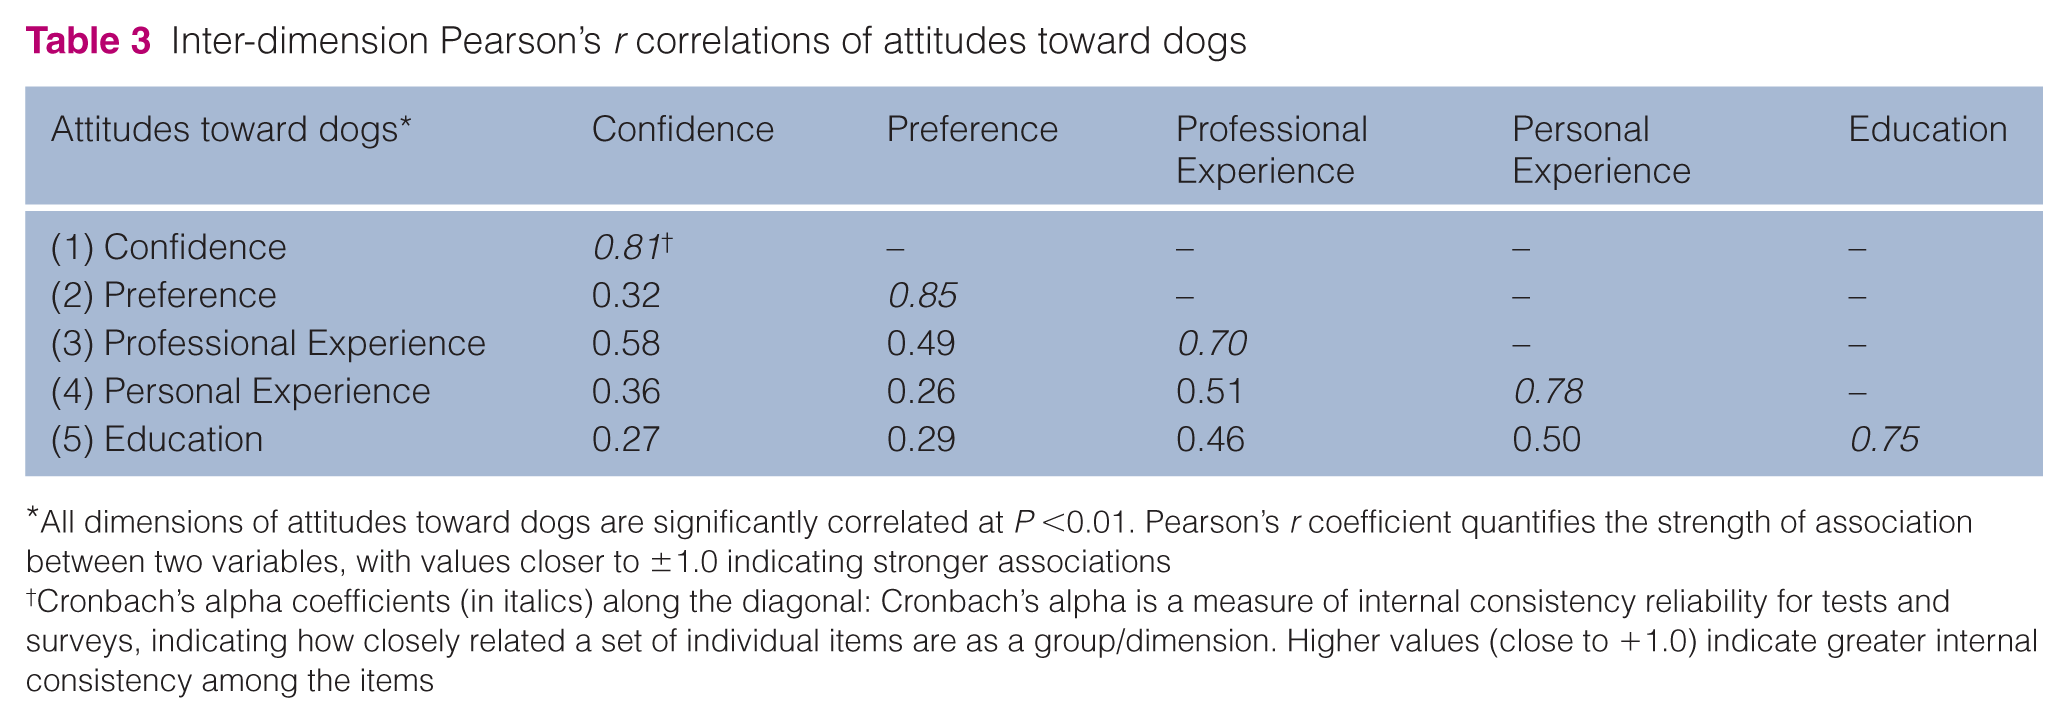
Inter-dimension Pearson’s r correlations of attitudes toward cats

All dimensions of attitudes toward cats are significantly correlated at P <0.01. Pearson’s r coefficient quantifies the strength of association between two variables, with values closer to ±1.0 indicating stronger associations
Cronbach’s alpha coefficients (in italics) along the diagonal: Cronbach’s alpha is a measure of internal consistency reliability for tests and surveys, indicating how closely related a set of individual items are as a group/dimension. Higher values (close to +1.0) indicate greater internal consistency among the items
Inter-dimension Pearson’s r correlations of attitudes toward dogs
All dimensions of attitudes toward dogs are significantly correlated at P <0.01. Pearson’s r coefficient quantifies the strength of association between two variables, with values closer to ±1.0 indicating stronger associations
Cronbach’s alpha coefficients (in italics) along the diagonal: Cronbach’s alpha is a measure of internal consistency reliability for tests and surveys, indicating how closely related a set of individual items are as a group/dimension. Higher values (close to +1.0) indicate greater internal consistency among the items
Average composite subscale ratings for attitudes toward cats and dogs

Data are mean ± SD unless otherwise indicated
Difference between average feline and canine attitude category ratings is significant at P <0.001
df = degrees of freedom
Results
A total of 287 responses were received from a broad cohort including faculty (n = 44), staff (n = 60) and students (n = 183).
In all categories, results displayed less positive veterinary attitudes toward cats than dogs (Table 4), supporting initial hypotheses that attitudes toward cats were generally less positive across the various identified dimensions. Respondents’ confidence in working with cats was significantly lower than confidence in working with dogs. Preference for cats was significantly lower than that for dogs. Personal experiences were significantly less positive with cats when compared with dogs. Professional experience with cats was also found to be significantly less than experience with dogs. Education regarding cats was rated significantly lower than the education provided for dogs.
The observed comparative analysis of ratings between cats and dogs across five categories – Confidence, Preference, Professional Experience, Personal Experience and Education – revealed distinct trends when compared among faculty, staff and students (Figure 1). Overall, dogs received higher ratings than cats across all groups, although this difference was not always statistically significant. Confidence ratings for cats were lower for all cohorts compared with dogs; however, this difference in confidence was statistically significant only among students (t[322] = 5.72; P <0.01). Compared with cats, Preference ratings for dogs were notably higher among staff (t[102] = 5.94; P <0.01) and students (t[322] = 12.78; P <0.01), while faculty showed similar levels of preference for both species. In terms of Professional Experience, dogs were rated far more favorably compared with cats, especially by students (t[321] = 13.79; P <0.01). Personal Experience ratings were also higher for dogs among staff (t[99] = 3.14; P <0.01) and students (t[322] = 6.96; P <0.01). Interestingly, Education ratings were significantly lower for cats than dogs across all cohorts (faculty: t[82] = 2.66; P <0.01; staff: t[99] = 3.63; P <0.01), especially students (t[322] = 12.63; P <0.01).
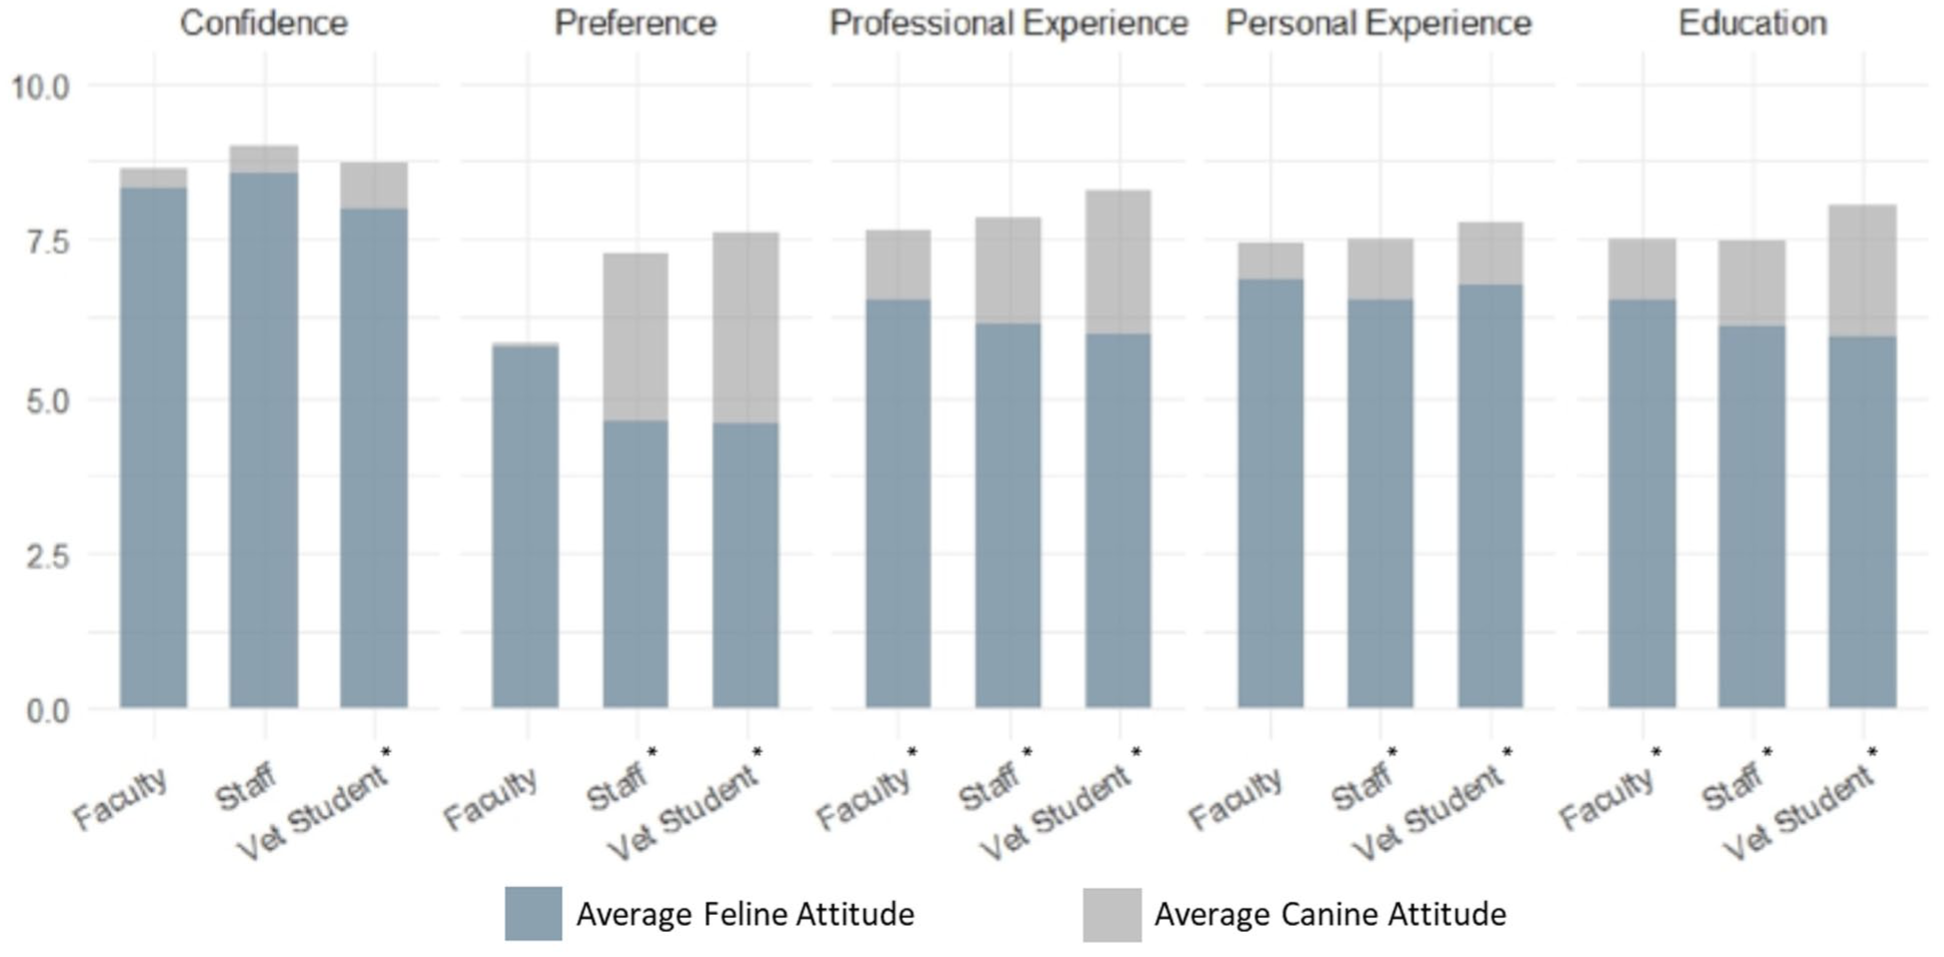
Comparison of average composite attitudes toward cats and dogs by respondent type. *Difference between average feline and canine attitudes within respondent category is significant at P <0.01
Respondents reporting cat allergies and those reporting dog allergies were compared respectively to those not reporting allergies for that species. That is, participants with cat allergies were compared with participants without cat allergies (Figure 2), and the same comparison was made versa for dog allergies (Figure 3). Among participants reporting cat allergies (n = 58), a significant reduction in preference for cats was observed (t[256] = −1.75; one-sided P <0.05). In contrast, those reporting dog allergies (n = 24) exhibited unexpectedly higher confidence in handling both cats and dogs compared with those without dog allergies (cats: t[44.24] = 3.77; P <0.01; dogs: t[254] = 2.29; P <0.05), as well as more professional experience specifically with cats (t[35.61] = 2.67; P <0.01). Personal experiences and educational exposure did not appear to vary significantly across allergy groups, suggesting that allergic status primarily influences professional and preference factors.

Veterinary attitudes toward cats and dogs according to cat allergy status. *Difference in attitude between respondents with cat allergy and respondents without cat allergy is significant at P <0.05

Veterinary attitudes toward cats and dogs according to dog allergy status. Asterisks indicate significant differences in attitude between respondents with dog allergy and respondents without dog allergy: *P <0.05. **P <0.01
Discussion
Results from this survey reinforced the hypothesis that veterinary professionals have less positive overall views toward cats, which has significant negative implications for feline care. Veterinary teams who are not confident with cats or have negative perceptions of cats may provide less optimal care and handling. Approximately 30% of cat owners report that they are unlikely to pursue routine veterinary care again if their cat has a stressful veterinary experience, 6 making each interaction important to the cat’s future medical care. The American Association of Feline Practitioners (now Feline Veterinary Medical Association) in collaboration with the International Cat Care Veterinary Society (formerly International Society for Feline Medicine) developed guidelines and a Cat Friendly Practice (CFP) program to improve feline handling and veterinary experiences5,15; however, these resources are underutilized. Although there are currently more than 25,000 practices (D Klosowski, Veterinary Economics Division, American Veterinary Medical Association, June 10 2024, personal communication) in the USA that treat cats, only 880 had CFP status as of 2023, 1 in spite of evidence that CFP status increases the number of cat visits and the amount of diagnostic testing performed. 16
The data suggest that allergies may also play a role in shaping the attitudes of veterinary professionals toward cats and dogs. The prevalence of sensitization to cats is reported to be in the range of 5–20%; 17 therefore, a proportion of veterinary professionals would be expected to be affected. Cat allergies may generate more symptoms than dog allergies. 17 Those reporting cat allergies had a decreased preference for cats, which may result in conscious or unconscious avoidance of cats due to discomfort or adverse physiological reactions. This aversion may influence not only personal choices but also professional willingness to engage with feline patients. Individuals with dog allergies may seek more professional engagement with cats, enhancing their confidence and skills with this species. However, the relatively low number of individuals reporting dog allergies in this study limits interpretation of these data.
Dogs were rated higher than cats among faculty, staff and students in nearly every category: Confidence, Preference, Professional Experience, Personal Experience and Education. Interestingly, confidence with dogs somewhat decreased with experience, with students having higher ratings than faculty or staff, although this difference was not tested for statistical significance. In contrast, confidence with cats appeared to be rated higher for faculty and staff than students. Personal experience ratings for dogs were quite high for the student cohort and may falsely influence confidence ratings. Professional experience with cats was rated lower than that for dogs across all cohorts. This is likely because cats receive less overall veterinary care than dogs. 1 Feline preference ratings were lower for staff and students, while faculty exhibited no significant species preferences. This reinforces the theory that working with cats increases comfort with this species. Educational exposure to cats was rated as consistently lower than for dogs by all groups, but the type of education was not specified. Further investigation into the type of education – clinical, hands-on labs, didactic or web-based – is needed.
Lower numbers of cat visits may limit professional experience in clinical practice, perpetuating negative perceptions and making training in veterinary colleges vital. Although our survey did not show a correlation between self-assessed education and confidence, the type of education (hands-on, didactic, web-based) was not specified. Education in feline behavior and increased examination opportunities have been shown to increase veterinary students’ confidence and satisfaction in working with cats.18,19 Increased education in feline behavior may increase confidence with cats by building recognition of feline fear-anxiety, pain and stress-associated behaviors and learning how to diminish and manage them.5,6,15,16
There are several limitations to this study. Selection bias is possible as those with stronger species attitudes may have been more likely to complete the survey.
Another limitation is distribution to a single college of veterinary medicine, which may not be representative of other colleges or veterinary professionals as a whole. This veterinary college primarily draws its student body from the southeastern USA; however, its faculty, staff and students represent a broad geographic distribution, including regions across the country and numerous international locations. The affiliated teaching hospital provides both referral and primary care services, supporting a diverse caseload. At the time of this survey, only the primary care service had CFP designation.
One potential limitation of the study is the wide distribution of respondents across various roles within the institution. Since all faculty and staff influence students and contribute to college and patient culture, broad assessment was performed. As this veterinary college uses a multi-species systems approach to didactic courses, classroom instructors may exert an influence on students’ attitudes toward species. Although the survey did not explicitly identify whether faculty and staff respondents were directly involved in small animal clinical work, the data suggest selection bias toward small animal practice. Clinical faculty (n = 38), technical staff (n = 47) and fourth-year students (n = 31) are the survey population (total n = 116) engaged in direct clinical care of dogs and cats within the teaching hospital. Of all survey respondents, 100 reported seeing canine patients weekly, while 110 reported seeing feline patients weekly, suggesting that they were mostly small animal clinical respondents. Future iterations of the survey may be limited to small animal clinical students, staff and faculty.
The staff respondents were mostly technicians (n = 47) but also included several administrative (n = 5) and research (n = 8) staff. The attitudes of administrative and research staff contribute to the culture of the college as they have vital roles in training students and providing care for small animal patients and clients. Staff showed a lower preference for cats, while faculty exhibited no specific preferences. This discrepancy may be a result of decreased experience due to shorter career paths and staff turnover common in the veterinary staff professions. 20 Staff may be less motivated for training in feline handling. 21
Veterinary students made up a large percentage of survey respondents. Although the student cohort in our data would be expected to have less established attitudes, veterinary experience is a prerequisite for admission to many veterinary colleges, 22 including the one surveyed. Entry-level US veterinary students had a median of 800 h of veterinary experience in 2023 (M Camus, Associate Dean for Academic Affairs, Auburn University College of Veterinary Medicine, 10 August 2025, personal communication). Given that the majority of US veterinary practices treat small animals, it is likely that most students entered veterinary college with significant experience and potential biases regarding working with dogs and cats.
Further research surveying general practitioners, other veterinary colleges or CFPs may provide valuable insights into attitudes toward feline care.
Conclusions
Our results highlight the critical role of education and clinical experience in shaping veterinary teams’ confidence and positivity toward cats. Our data showed that veterinary professionals surveyed had overall less favorable attitudes toward cats than dogs in terms of confidence, preference, professional and personal experience, and education. Allergies may also contribute to species preference, as those reporting cat allergies had lower preference for cats, while those with dog allergies showed higher preference for and professional experience with cats. Ratings for confidence with cats appeared to improve with experience, while the opposite was found in regard to dogs. All cohorts rated educational exposure to cats as lower than that for dogs, highlighting gaps in feline learning.
Footnotes
Acknowledgements
The authors thank Kendell Mitchell DVM for his contributions to the survey and Merrillee Holland DVM, DACVR for her support.
Author note
Some of this material was presented as a poster at the Southern European Veterinary Conference, Madrid, Spain, 24–26 October 2024.
Conflict of interest
The authors declared no potential conflicts of interest with respect to the research, authorship, and/or publication of this article.
Funding
Funding for a survey incentive gift card raffle was received from the Auburn College of Veterinary Medicine Chapter of the Student American Veterinary Medical Association. The authors received no financial support for the research or authorship of this article.
Ethical approval
This work did not involve the use of animals and therefore ethical approval was not specifically required for publication in JFMS.
Informed consent
This work did not involve the use of animals (including cadavers) and therefore informed consent was not required. No animals or people are identifiable within this publication, and therefore additional informed consent for publication was not required.