
Abstract
Objectives
To determine the effects of haemorrhage and fluid over-resuscitation on colloidal osmotic pressure of albumin (COP albumin), plasma (Posm) and effective (Eosm) osmolality in anaesthetised cats.
Methods
A total of six cats were given three treatments once, at 2-month intervals, in a randomised, crossover haemorrhage-resuscitation study. The treatments were divided into two phases, a controlled haemorrhage phase and a fluid resuscitation phase, as follows: (1) NoHR = no controlled haemorrhage and no resuscitation; (2) LRS = controlled haemorrhage followed by lactated Ringer’s solution infusion (60 ml/kg/h); and (3) TS = controlled haemorrhage followed by 6% tetrastarch 130/0.4 suspended in 0.9% saline infusion (20 ml/kg/h). The resuscitation fluids were administered for 120 mins. Data were collected before haemorrhage, before resuscitation and at 30 min intervals until 120 mins. Variables were calculated at each time point as follows: COP albumin = albumin concentration (g/l) × 0.57; Posm = (2 × sodium) + glucose + blood urea nitrogen; and Eosm = (2 × sodium) + glucose. All Posm and Eosm concentrations were measured as mmol/l. Data were compared using a general linear mixed model (significance: P <0.05).
Results
Mean ± SD total haemorrhage volumes for NoHR, LRS and TS were 10.2 ± 2.3, 29.3 ± 9.0 and 29.1 ± 6.3 ml/kg, respectively. The COP albumin decreased over time in all treatments regardless of volumes of blood lost and fluid administered. The decrease in COP albumin was profound and clinically relevant in LRS and TS (both P <0.001). There were no statistical differences in Posm and Eosm over time except in LRS at 90 (P = 0.004) and 120 ml/kg (P <0.001).
Conclusions and relevance
The COP albumin decreased in all treatments but to low and clinically relevant concentrations in LRS and TS, putting the cats at risk of fluid overload. There were no clinically relevant derangements in Posm and Eosm.
Keywords
Introduction
Total body water is distributed into intracellular and extracellular compartments and water flows freely across plasma membranes between these compartments along an osmotic pressure gradient. 1 The extracellular compartment is further divided into the interstitial compartment and intravascular compartment, and movement of free water between these compartments has been predicted by the modified Starling principle. 2 Briefly, microvessels (capillaries) are permeable to macromolecules, which means that a balance of hydrostatic and oncotic pressures cannot prevent fluid exchange. 3 Hydrostatic forces are higher in the intravascular compartment promoting a net efflux filtration of water into the intestinal compartment. This free water, if not moving into the intracellular compartment by an osmotic pressure gradient, is absorbed into lymphatic circulation and returned to the intravascular compartment via the thoracic duct. 4 Oncotic forces within the intravascular and intestinal compartments promote keeping free water within each of these compartments. The intravascular compartment has a higher oncotic force compared with the intestinal compartment and thus a higher propensity to keep free water within this compartment. 5 The interaction of albumin and sodium, the most important extracellular cation, is important to maintain intravascular volume. Free water is attracted by sodium cations; thus, sodium is the primary determinant of extracellular compartment osmolality. 6 Predicted by the Gibbs–Donnan effect, albumin (a negative charged protein) is an important component of colloidal oncotic pressure because it attracts sodium cations (positively charged) that form the colloidal osmotic pressure (COP) of the extracellular compartment. 7 Therefore, any change in plasma albumin or sodium concentrations can alter intravascular volume status and fluid kinetics and these changes can occur during haemorrhage and fluid resuscitation.8,9 Haemorrhage, depending on the volume of blood lost, results in an absolute hypovolaemia that manifests as hypotension and once >40% of circulating volume has been lost, hypovolaemic shock. 10 Volume resuscitation using isotonic crystalloid or synthetic colloid solutions is more accessible and convenient in practice compared with blood products; however, there is no clear guideline on what volume of resuscitation fluid should be used to restore the intravascular volume. Past recommendations include a 3:1 or 1:1 volume replacement for crystalloids or synthetic colloids, respectively, for every millilitre of blood lost; however, there is an ever-present risk of causing volume overload, coagulopathies and haemodilution.8,11
Measuring intravascular COP and plasma osmolality (Posm) requires reference laboratories that have the machines and trained personnel to measure these variables accurately and this capability is often limited to academic hospitals. In the absence of this capability, many equations have been described to calculate total COP and albumin’s contribution to COP (COP albumin) and Posm and effective osmolality (Eosm) in humans and animals. 12 There are many human-derived equations; this is likely because of different responses during different disease processes, treatments and fluid resuscitation methods. 13 Few of the proposed human equations have been investigated in dogs, and even less so in cats, to compare measured and calculated values with a general recommendation that they can be used clinically in most cases. 14 There is a paucity in the literature of using these described equations in cat research, especially those undergoing haemorrhage and fluid resuscitation.
We aimed to determine the effect of haemorrhage and over-resuscitation on calculated COP albumin, Posm and Eosm in anaesthetised cats. We hypothesised that there would be no difference in calculated COP albumin, Posm and Eosm over time in three different haemorrhage-resuscitation treatments.
Materials and methods
Study design and animals
The data presented in this randomised crossover study form part of a larger haemorrhage-resuscitation project that was approved by the ethics committees of the University of Pretoria (v006-15) and the University of Witwatersrand (2017-10-68-C-AREC). We adhered to the ARRIVE 2.0 reporting guidelines. The inclusion criteria were that the cats had to be deemed healthy based on a clinical examination, and haematology and biochemistry (urea, creatinine and albumin) were within normal reference intervals (RIs) for cats. The exclusion criteria were not established because the cats were purchased as kittens and reared for the PhD project with the exception that they had to weigh >3.5 kg. A group of six domestic cats (three males and three females) from a research colony that was housed in a communal indoor–outdoor cattery were used. Routine animal husbandry protocols were established, ensuring the cats were cared for by experienced animal health technicians. Daily interactions with the cats were implemented and included interactive toys and building climbing structures for environmental enrichment.
The sample size was based on availability of research colony cats and the study budget. Therefore, a post-hoc power analysis using a two-variance power curve calculation was carried out based on the calculated COP albumin data presented here, as follows: sample number = 72; alpha = 0.05; ratio of the standard deviations (SDs) between the no haemorrhage no resuscitation treatment (SD = 2.3) and 1/2 haemorrhage and resuscitation treatments (controlled haemorrhage followed by lactated Ringer’s solution infusion [LRS] SD = 3.9; controlled haemorrhage followed by 6% tetrastarch 130/0.4 suspended in 0.9% saline infusion [TS] SD = 4.0) was rounded off to one decimal point (0.6). Power was calculated as 0.97 for the calculated COP albumin data.
Study procedures
Three different treatments were instituted by randomisation using a single block design (www.randomization.com) at an interval of 2 months. The treatments were divided into two phases, a controlled haemorrhage phase and a fluid resuscitation phase, as follows: (1) NoHR = no controlled haemorrhage and no resuscitation; (2) LRS = controlled haemorrhage followed by an isotonic crystalloid infusion (lactated Ringer’s solution; Fresenius Kabi) at 60 ml/kg/h; and (3) TS = controlled haemorrhage followed by a synthetic colloid infusion, 6% tetrastarch 130/0.4 suspended in 0.9% saline (Voluven; Fresenius Kabi). The fluids used for resuscitation were administered for 120 mins.
The controlled haemorrhage involved manually aspirating blood into a semi-closed collection system using 20 ml plastic syringes primed with 4 ml of citrate–phosphate–dextrose (JMS blood bag, 450 ml; JMS Singapore) at a targeted rate of 2 ml/kg/min until 1/2 endpoints was reached. The endpoint was either (1) a maximum blood withdrawal of 30 ml/kg or (2) a mean arterial blood pressure of <48 mmHg that persisted for at least 3 mins.
The study procedure took place at the Onderstepoort Veterinary Academic Hospital. On the data collection days of the study, the cats were admitted to the theatre and a clinical examination was performed. Thereafter, they were premedicated with buprenorphine (0.02 mg/kg IM, Temgesic; Reckitt Benckiser Healthcare) and left alone for 45 mins. A cephalic vein was then cannulated and general anaesthesia induced with alfaxalone to effect. Anaesthesia was maintained using isoflurane-in-oxygen delivered by a paediatric rebreathing circuit (15 mm internal diameter, Compact paediatric breathing system; Intersurgical). The cats spontaneously ventilated throughout the general anaesthetic and the fresh gas flow rate was standardised to 80 ml/kg/min. Once anaesthetised, perianaesthetic intravenous fluid therapy using lactated Ringer’s solution administered at 5 ml/kg/h was started. The hair on the ventral neck was shaved and aseptically prepared before inserting a catheter (22 G, 50 mm, Arrow arterial catheterisation set; Arrow International) into the left jugular vein (percutaneously) and right carotid artery (cut-down technique), both using the Seldinger technique. A multiparameter physiologic monitor (Cardiocap 5; Datex) was used to continuously monitor vital variables and recorded at set time points during the procedures. Once the haemorrhage phase was complete, the resuscitation phase began. Once the resuscitation phase was complete, the cats were administered meloxicam (0.2 mg/kg SC, PetCam; CiplaVet) and buprenorphine (0.03 mg/kg IV) before being allowed to recover from anaesthesia in the intensive care unit (ICU) for 24 h before returning to the colony. Data and methods not related to this study but from the larger haemorrhage-resuscitation project are reported elsewhere.8,10,11,15 The focus of this study was the haemorrhage and resuscitation phases.
Data collection
Venous blood was collected at predefined time points, as follows: before controlled haemorrhage (pre-haemorrhage); immediately after haemorrhage but before starting resuscitation (T0); and 30 mins (T30), 60 mins (T60), 90 mins (T90) and 120 mins (T120) after starting resuscitation. Blood was stored in serum vacuum tubes (2 ml) and lithium-heparinised syringes (1 ml, BD A-line; Becton Dickinson) and sent to an onsite veterinary reference laboratory for processing by experienced clinical pathologists and technicians. Serum was analysed to determine albumin, glucose and blood urea nitrogen (BUN) concentrations using a daily calibrated reference analyser (Cobas Integra 400 Plus; Roche Diagnostics). Sodium concentration (Na+) was measured using a daily calibrated benchtop blood gas analyser (Rapidlab 500 System; Siemens). At each time point, the total volume of blood loss and the total volume of fluids administered were recorded.
Data analysis
For each time point, the COP albumin, Posm and Eosm were calculated, as follows:
COP albumin = serum albumin concentration (g/l) × 0.57 (Poole–Wilson formula) 16
Posm = (2 × Na+ (mmol/l)) + glucose (mmol/l) + BUN (mmol/l) (Smithline–Gardner formula) 17
Eosm = (2 × Na+ (mmol/l)) + glucose (mmol/l) (Stevenson–Bowyer formula) 18
The cumulative volume of blood loss and volume of fluids administered were calculated for each time point.
The distribution of the calculated data was assessed by plotting histograms, investigating descriptive statistics and using the Anderson–Darling test for normality. Data were parametric and reported as the mean (95% confidence interval [CI] of the mean). Data sets from each treatment were compared using a general linear mixed model where random factors were cat, and cumulative volume of blood loss and fixed factors were cumulative volume of fluids administered and time. Model fit to data was assessed for linearity, homoscedasticity and randomness by investigating residual plots. Multiple comparisons of significant outcomes were compared using Dunnett’s method where pre-haemorrhage values within each treatment were used as the control. Data were presented using bubble plots, where the variable of interest was the bubble with the diameter representing the magnitude of the variable, the y-axis was cumulative volume of blood loss and the x-axis was cumulative volume of fluids administered over 120 mins (each axis unit were ml/kg). Data were analysed and bubble plots were created using commercially available software (MiniTab 18; Minitab and Microsoft Excel; Microsoft, respectively). Significance was interpreted as P <0.05.
Results
The mean ± SD age and weight of the cats was 21 ± 1 months and 4.9 ± 1.2 kg, respectively. The mean ± SD total haemorrhage volumes for NoHR, LRS and TS were 10.2 ± 2.3, 29.3 ± 9.0 and 29.1 ± 6.3 ml/kg, respectively. The calculated COP albumin decreased in all treatments, regardless of the volume of fluids administered or blood loss. In NoHR, the mean COP albumin was 16 mmHg (95% CI 14–19) before shamming controlled haemorrhage and resuscitation and precipitously decreased from T30 (P = 0.005), T60 (P = 0.003) and T90 (P <0.001) to its lowest at T120 (P <0.001) of 14 mmHg (95% CI 12–17) (Figure 1 and Table 1). In LRS, the mean COP albumin was 14 mmHg (95% CI 14–18) at pre-haemorrhage and continuously declined rapidly from T30 to T120 (all P <0.001) to 8 mmHg (95% CI 6–10). A similar outcome to LRS was calculated in TS, where the pre-haemorrhage value was 16 mmHg (95% CI 14–19) and continuously declined from T0 until T120 (all P <0.001) to 6 mmHg (95% CI 5–8).

Bubble plots where the variable of interest was the bubble, with the diameter representing the magnitude of the variable, the y-axis representing cumulative volume of blood loss and the x-axis representing cumulative volume of fluids administered over 120 mins. The variables of interest were (a) calculated COP albumin, (b) calculated Posm; and (c) calculated Eosm in six anaesthetised cats that underwent three different haemorrhage-resuscitation treatments, as follows: NoHR = no controlled haemorrhage and no resuscitation; LRS = controlled haemorrhage followed by lactated Ringer’s solution infusion at 60 ml/kg/h; and TS = controlled haemorrhage followed by a synthetic colloid infusion, 6% tetrastarch 130/0.4 suspended in 0.9% saline infusion at 20 ml/kg/h. # = significantly different COP albumin values compared with pre-haemorrhage values within each treatment; * = significantly different Posm values compared to pre-haemorrhage values within LRS treatment; $ = significantly different Eosm values compared to pre-haemorrhage values within LRS treatment; COP = colloidal osmotic pressure; Eosm = effective osmolality; Posm = plasma osmolality
The mean and 95% CI of calculated COP albumin, Posm and Eosm in six anaesthetised cats that underwent three different haemorrhage-resuscitation treatments
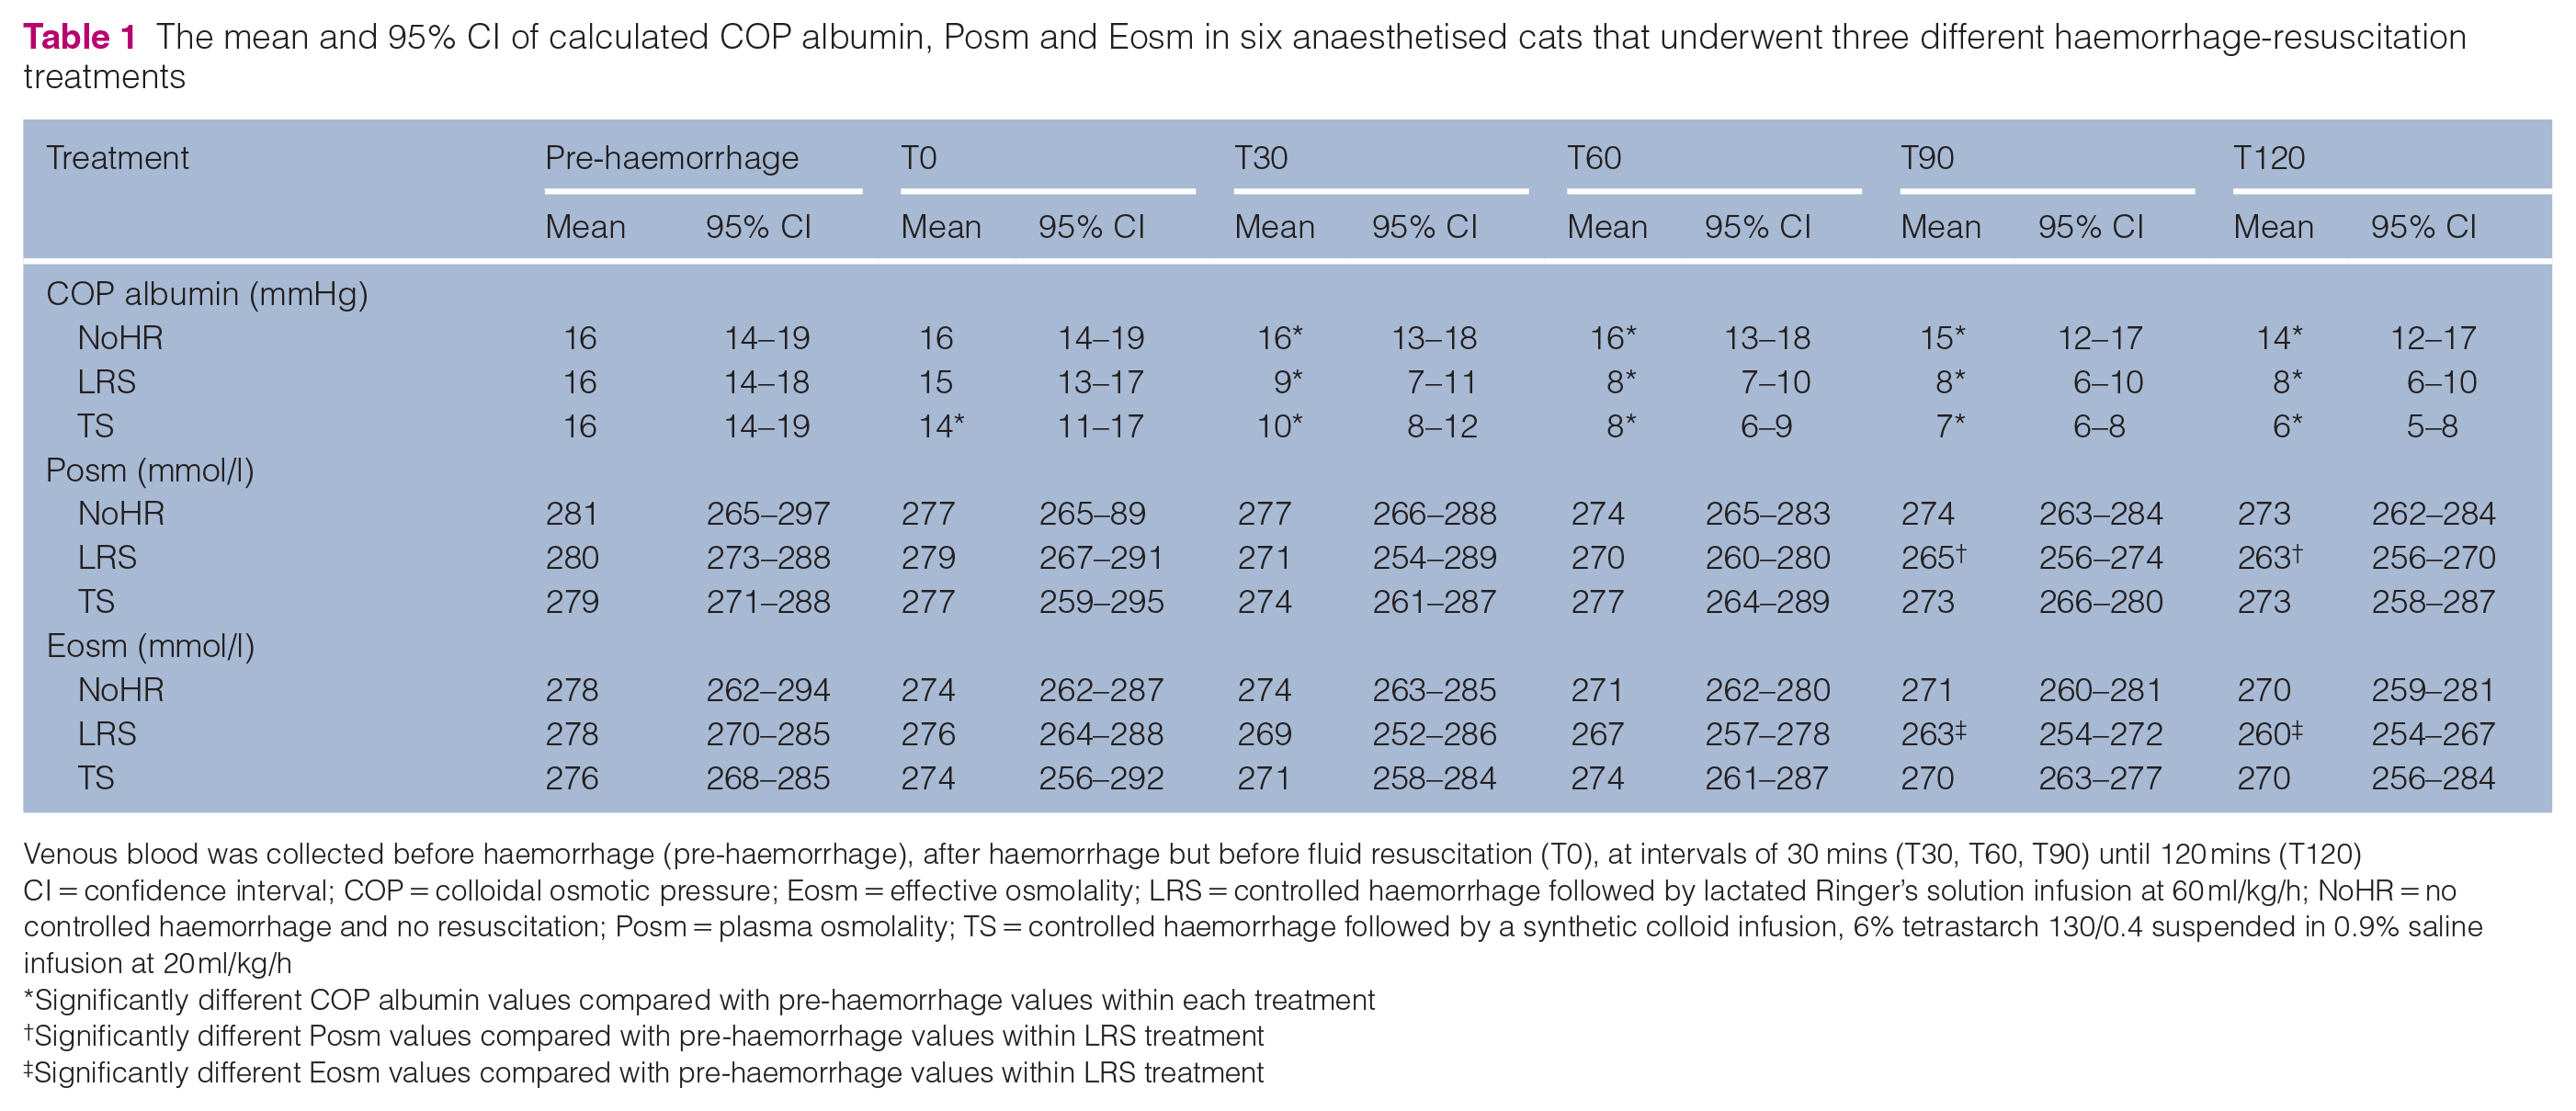
Venous blood was collected before haemorrhage (pre-haemorrhage), after haemorrhage but before fluid resuscitation (T0), at intervals of 30 mins (T30, T60, T90) until 120 mins (T120)
CI = confidence interval; COP = colloidal osmotic pressure; Eosm = effective osmolality; LRS = controlled haemorrhage followed by lactated Ringer’s solution infusion at 60 ml/kg/h; NoHR = no controlled haemorrhage and no resuscitation; Posm = plasma osmolality; TS = controlled haemorrhage followed by a synthetic colloid infusion, 6% tetrastarch 130/0.4 suspended in 0.9% saline infusion at 20 ml/kg/h
Significantly different COP albumin values compared with pre-haemorrhage values within each treatment
Significantly different Posm values compared with pre-haemorrhage values within LRS treatment
Significantly different Eosm values compared with pre-haemorrhage values within LRS treatment
The Posm and Eosm were not different in value regardless of the volume of fluid administered or blood loss for NoHR and TS. The pre-haemorrhage Posm and Eosm were 281 mmol/l (95% CI 265–297) and 278 mmol/l (95% CI 262–294) for NoHR, and 279 mmol/l (95% CI 271–288) and 276 mmol/l (95% CI 268–285) for TS, respectively. However, the pre-haemorrhage Posm and Esom were 280 mmol/l (95% CI 273–288) and 278 mmol/l (95% CI 270–285) for LRS, which declined at T90 (P = 0.004) to 265 mmol/l (95% CI 256–274) and 263 mmol/l (95% CI 254–272), respectively, and at T120 (P <0.001) to 263 mmol/l (95% CI 256–270) and 260 mmol/l (95% CI 254–267), respectively.
Discussion
We sought to determine if atraumatic controlled severe haemorrhage and fluid over-resuscitation in anaesthetised cats had an effect on calculated COP albumin, Posm and Eosm. In these cats, COP albumin decreased regardless of haemorrhage volumes or volume or type of fluid administered. There were no clinically relevant derangements in Posm and Eosm irrespective of the volume of blood lost or the volume and type of fluid administrated during over-resuscitation.
The precipitous decrease in albumin and total serum proteins has been well described in anaesthetised horses 19 and dogs, 20 but less so in cats. Although only calculated COP albumin is reported here, our cats’ actual albumin concentrations, which decreased in a similar manner to COP albumin, were reported in another paper focused on identifying biomarkers of impending fluid overload. 8 The drugs used for the general anaesthetic could have contributed to this decrease in COP albumin in all treatments. Buprenorphine decreases hepatocyte synthesis of albumin in vitro. 21 However, we detected a decrease within 1 h of starting general anaesthesia and the half-life of albumin in cats is in the range of 12–14 days; 22 thus, a buprenorphine-induced decrease in albumin synthesis would only be detected after this period. We surmise that buprenorphine had little effect on this decrease in COP albumin. Furthermore, buprenorphine, when given at high subcutaneous doses to cats for 8 consecutive days, had no change in albumin concentration. 23 Alfaxalone, when given alone to cats using a similar dose to that used in our study, had no effect on albumin. 24 Isoflurane does cause a precipitous decrease in albumin concentration in horses, 25 dogs 26 and cats. 27 How isoflurane decreases the intravascular albumin concentration is not fully elucidated but there is an increase in transendothelial albumin permeability. 28 The proposed mechanism is isoflurane-induced enhancement of caveolin-1 phosphorylation, which is a key cell surface scaffold protein responsible for the formation of caveolae for endothelial transcyctosis (ie, vesicular shuttle) of albumin. 29 The decrease in COP albumin in LRS and TS was profound compared with the decrease in NoHR and can be attributed to the loss of fresh whole blood followed by fluid resuscitation. 29 Isoflurane inhibited the compensatory intravascular expansion after mild and severe haemorrhage in sheep. 30 We speculate that this could be true for our anaesthetised cats whereby compensatory fluid shifts to restore intravascular volume could also have been hindered by isoflurane; however, we did not investigate controlled severe haemorrhage without resuscitation. The administration of large volumes of intravenous fluids during resuscitation dilute albumin and thus the intravascular oncotic pressure, but increases hydrostatic pressure, which promotes fluids to move into the interstitial compartment. 31 Although not published here, clinical evidence of fluid overload, which included facial or limb oedema, serous or serosanguineous discharge from the respiratory tract, were evident in most LRS treatments and half of TS treatments. 8 Fluid overload was not treated but the cats were observed in the ICU and within 4 h, all fluid overload signs resolved. By the next day, the albumin concentrations were within normal RIs. 8 The rapid resolution of these signs of fluid overload were unexpected by the authors, especially considering the notion that cats are thought to be fluid sensitive. A possible reason for this rapid resolution could be because of interstitial washdown and vascular albumin refill, which has been described as a novel explanation for intravenous fluid kinetics. 32 Briefly, this explanation proposes that crystalloid infusions increase lymphatic flow and albumin in the interstitial compartment is returned by lymphatic fluid to the intravascular compartment via the thoracic duct. 32
There were no clinically relevant changes to Posm and Eosm, which suggests that large volume resuscitation with isotonic fluids after rapid severe haemorrhage (>40% of circulating volume) does not alter osmotic forces. Fluid shifts between the extracellular and intracellular compartments are predominantly along osmotic gradients. 33 The fluids used for resuscitation were isotonic enough for our cats’ plasma and the fluid overloaded states seen in LRS and TS resolved quickly, suggesting that no untoward effects occurred to imbalance the osmotic gradients. A statistically significant but clinically irrelevant decrease in osmolality in LRS was attributed to the large volume of fluid given (120 ml/kg over 120 mins) and that the sodium concentration of this fluid is 130 mmol/l, which caused the intravascular concentration to decrease once > 90 ml/kg were given. 34 An aim of the larger fluid research project was to investigate how fluid sensitive cats are and if they can manage fluid overload. As a result, we cannot recommend these volumes of fluids used during clinical resuscitation. In cats undergoing severe intraoperative haemorrhage (>30 ml/kg blood loss), we recommend an initial bolus of 30 or 10 ml/kg of LRS and TS, respectively. 8 These proposed initial replacement volumes imply that ratios of 1:1 or 0.3:1 for LRS or TS, respectively, are recommended and these are in stark contrast to the 3:1 or 1:1 recommendation that was once proposed.8,11 Hypocoagulopathy occurs when volume replacement ratios exceed 2.2:1 or 0.7:1 for LRS and TS, respectively. 11 Controversies surrounding the use of TS in cats (and other animals) exist because of their extrapolated propensity to cause coagulopathies, acute kidney injury and associated increased mortality in critically ill human patients. 35 However, data suggest that cats (and dogs) tolerate moderate doses given as boluses or constant rate infusions, 36 and that the incidence of acute kidney injury is no different in cats not exposed to TS. 37
There were notable limitations to our study, the first being that total serum protein and globulins were not measured because it was unfortunately not a variable of interest in the larger fluid project. Therefore, we could only calculate COP albumin in this study. However, the other equations that have been proposed to calculate COP, such as the Landis–Pappenheimer equation, have been compared with measured COP in cats but they can differ by up to 5 mmHg.14,38 Despite these equations not being an accurate determinate of measured COP, 39 the calculated COP albumin used in our study offers good trend information. 14 A caveat to the Poole–Wilson formula is that it is unknown how the constant of 0.57 was derived. Others have speculated that it might be derived from healthy human patients where albumin made up 70% of the total plasma protein concentration. 39 The haemorrhage-resuscitation model was conducted in healthy young cats under experimental conditions, and we cannot speculate if the same outcomes would be true in clinical cases. The sample size was small and not calculated for this study; thus, we performed a post-hoc power calculation using the calculated COP albumin, which was greater than 0.8. The chance of a type II error occurring appears minimal (beta = 1–0.97; beta = 0.03, or 3% probability of rejecting the null hypothesis when it is false). 40 Finally, we did not correct the sodium concentration in the Posm and Eosm calculations. Corrected sodium equations are based on human equations where the serum water fraction is assumed to be constant at 93%; however, this assumption does not work in cats. 41 Unfortunately, we did not measure cholesterol or total proteins required for this corrected sodium equation for cats. We cannot speculate what the magnitude of relevance would be if we had corrected the sodium concentrations, but we suggest that the trend information would not be different.
Conclusions
Decreases in COP albumin occur in isoflurane-anaesthetised cats and the decrease is clinically relevant if they haemorrhage and are given fluids for resuscitation. There was no clinically relevant change in calculated Posm or Eosm when isotonic fluid resuscitation after severe haemorrhage has occurred.
Footnotes
Acknowledgements
The authors would like to thank the staff members of the UPBRC that assisted in the PhD research project. We would also like to thank the following for their financial contributions: South African Veterinary Foundation, Health and Welfare Sector Education and Training Authority (HWSETA) Fund, University of Pretoria Research Development Program, South African National Research Foundation.
Conflict of interest
The authors declared no potential conflicts of interest with respect to the research, authorship, and/or publication of this article.
Funding
The authors received no financial support for the research, authorship, and/or publication of this article.
Ethical approval
This work involved the use of experimental animals and the study therefore had ethical approval from an established committee as stated in the manuscript.
Informed consent
Informed consent (verbal or written) was obtained from the owner or legal custodian of all animal(s) described in this work (experimental or non-experimental animals, including cadavers, tissues or samples) for the procedure(s) undertaken (prospective or retrospective studies). No animals or people are identifiable within this publication, and therefore additional informed consent for publication was not required.