
Abstract
Objectives
The aim of the present study was to compare the circulating transforming growth factor-beta (TGF-β) of clinically normal age-matched and naturally occurring chronic kidney disease (CKD) cats and to determine the correlation between the TGF-β expression and histopathological changes in cats with CKD.
Methods
A total of 11 clinically normal age-matched and 27 cats with naturally occurring CKD were included in this study. Circulating TGF-β was quantified by immunoassays. Kaplan–Meier analysis was used to calculate the association between survival time and the concentration of circulating TGF-β. A general linear model was used to compare the circulating TGF-β between groups. Immunohistochemical analyses revealed TGF-β expression in renal tissues from cats with CKD that died during the study (n = 7) and in available archived renal tissue specimens taken at necropsy from cats that had previous CKD with renal lesions (n = 10). Correlations of the TGF-β expression and clinical parameters (n = 7) and histopathological changes (n = 17) were analysed using Spearman’s rank correlation.
Results
The median survival time of cats with a lower concentration of circulating TGF-β was shorter than that of cats with a higher concentration. The area under the curve of circulating TGF-β for predicting CKD was 0.781, indicating good differentiation. The study indicated a significant difference in circulating TGF-β concentrations between clinically normal cats and those with CKD and demonstrated that TGF-β expression is correlated with tubular atrophy.
Conclusions and relevance
The study findings suggest that decreased serum TGF-β and tubular atrophy with TGF-β immunoreactivity may be significant in cats with CKD.
Introduction
Chronic kidney disease (CKD) is common in geriatric cats. The prevalence of feline CKD is 1.9% in the cat population of the USA, 1 20% in cats presented to animal hospitals in Australia, 2 0.6% in sick cats at the Small Animal Hospital, Faculty of Veterinary Science, Chulalongkorn University, Thailand 3 and 2.37% in cats presented at the Faculty of Veterinary Medicine, Chiang Mai University, Thailand. 4 Increased serum creatinine (>1.6 mg/dl), blood urea nitrogen (BUN; >35 mg/dl) and symmetric dimethylarginine (SDMA; >14 µg/dl) concentration, as well as decreased urine specific gravity (USG <1.035), are routinely used to identify CKD in cats.5,6 Continually increased fasting blood SDMA of more than 14 μg/dl is used to diagnose early CKD. 6 Then, substaging is due to proteinuria and hypertension.
Tubulointerstitial nephritis is a significant lesion in feline7 –11 and human 12 patients with CKD. In the case of cats with CKD, the concentration of creatinine has been found to be substantially linked with interstitial fibrosis. 10 Interstitial fibrosis correlates with the severity of CKD, anaemia, hyperphosphatemia and proteinuria in cats with CKD. 11
Transforming growth factor-beta (TGF-β) is an important pro-fibrotic mediator because it modulates the healing process. Increased concentrations of TGF-β have been found in patients with rheumatoid arthritis, 13 intestinal inflammation, 14 myocarditis 15 and diabetic nephropathy. 16 TGF-β is abundant in the kidney. The ratio of urinary TGF-β to urine creatinine in cats with CKD is significantly higher than in healthy cats. 17 Arata et al 18 reported that the concentration of urinary TGF-β1, which is the most common polypeptide member of the TGF-β superfamily of cytokines, is elevated in cats with CKD. Furthermore, urinary active TGF-β1 has been correlated with renal interstitial fibrosis in cats. 19
Although there are studies on TGF-β in cats with CKD, they have focused on urinary TGF-β. The objectives of this study were to compare circulating TGF-β between clinically normal age-matched cats and those with naturally occurring CKD, and to determine the correlation between TGF-β expression and clinical or histopathological changes in cats with naturally occurring CKD.
Materials and methods
Animals
Clinically normal age-matched cats
In total, 11 clinically normal age-matched cats presented to the Small Animal Hospital, Faculty of Veterinary Medicine, Chiang Mai University, were included in this study. The cats were at least 7 years old and had normal physical examination results, serum creatinine less than 1.6 mg/dl, SDMA less than 14 µg/dl, BUN less than 35 mg/dl and USG more than 1.035. Cats were included without sex preference.
Cats with naturally occurring CKD
The group with naturally occurring CKD comprised 27 cats that visited the Small Animal Hospital, Faculty of Veterinary Medicine, Chiang Mai University, with increased serum creatinine (>1.6 mg/dl), increased BUN (>35 mg/dl) and decreased USG (<1.035). 5 These cats with CKD had clinical signs, including polyuria, polydipsia, weight loss, poor haircoat, dehydration, non-regenerative anaemia and small/irregular kidneys. Every cat had evidence of chronic azotaemia. The cats were evaluated for clinical signs and underwent blood tests on several occasions before being enrolled in this study, which lasted more than 3 months. Furthermore, radiography and ultrasonography were employed to comprehensively assess these cats in the present study. Importantly, meticulous examination of the imaging results revealed the absence of any indications of post-renal aetiologies (such as ureteral dilatation or chronic ureteral obstructions), further supporting the primary diagnosis of CKD. The imaging findings revealed either small kidney size, polycystic kidney or hydronephrosis. The exclusion criterion was cats with a history of other systemic diseases, such as heart disease, hyperthyroidism, diabetes mellitus and lower urinary tract. We recruited cats without sex preference.
All cats with CKD were treated with conservative medical treatment, including fluid therapy, and fed with the prescription diet for renal disease according to daily requirements. The owners were allowed to withdraw their cats if the clinical signs worsened. The Ethics Committee of the Faculty of Veterinary Medicine, Chiang Mai University, approved the Human and Animal Experimentation protocol (no. R8/2562).
Study designs
Blood samples were collected to determine the complete blood count, blood chemistry (alkaline phosphatase, alanine aminotransferase, BUN, creatinine and phosphorous)20,21 and circulating TGF-β level. The samples were kept at −20°C and used within 6 months of storage.
Urine samples were collected by voiding midstream, by catheterisation or by cystocentesis for urinalysis. In total, 17 renal tissues were obtained from cats with CKD that died during the study (n = 7) and from tissue banks of the Veterinary Diagnostic Laboratory, Faculty of Veterinary Medicine, Chiang Mai University, with renal lesions (n = 10), and we subsequently performed haematoxylin and eosin staining, Masson’s trichrome staining, periodic acid–Schiff staining and immunohistochemistry (IHC). We evaluated the TGF-β expression and histopathological changes in the kidneys mentioned above.
Laboratory examination
Circulating TGF-β
Circulating TGF-β in the cats’ sera were measured using dot blot analysis.22–25 The serum and phosphate-buffered saline (1:1) mixture were denatured at 95°C for 5 mins. The denatured protein (3 µl) was dotted onto the nitrocellulose membrane. The nitrocellulose membrane, with all denatured protein samples, was incubated with bovine serum albumin as a blocking buffer for 30 mins at room temperature. The membrane was then incubated with a primary antibody (purified anti-TGF-β1 antibody; BioLegend, catalogue no. 846802; 1:1000) at room temperature for 2 h and then washed three times in TBST for 5 mins. (TBST solution is a mixture of Tris-buffered saline [TBS] and Tween 20.) The membrane was incubated with a secondary antibody (horseradish peroxidase goat anti-mouse IgG antibody; BioLegend, catalogue no. 405306; 1:3000) for 45 mins at room temperature and also washed three times in TBST for 5 mins. We used 3,3′-diaminobenzidine as a substrate to detect the peroxidase reaction for 5 mins at room temperature. The membrane was then rinsed in running tap water to stop the reaction. Another sheet of the membrane was prepared and dotted with samples prepared in the same manner as the first. This membrane was stained with Ponceau red for 10 mins at room temperature. The membrane was then rinsed in running tap water to stop the reaction. Ponceau red staining is used for measuring total protein in serum. We used Image Studio Lite (LI-COR Biosciences) to analyse TGF-β and total protein density. The circulating TGF-β was calculated by TGF-β integrated density/total protein integrated density.
IHC
In the necropsy procedure performed on the kidneys of cats with CKD, small, thin pieces (1.0 cm × 1.0 cm × 0.2 cm) were cut and fixed with 10% neutral buffered formalin. Later, water was removed entirely from these tissues. Transparentising was then conducted by using a transparent agent, and immersion was performed at 54–64°C. Next, the tissues were embedded in paraffin and sliced by a rotary microtome to produce sections with a thickness of 3 µm. Each tissue section was transferred onto glass slides for IHC. The tissue slides were deparaffinised and rehydrated. The antigen retrieval was performed using a microwave (700 W) for 20 mins in citric buffer pH 6. The tissue slides were then placed at room temperature and rinsed in distilled water for 5 mins.
To each tissue slide, we added 200 µl of 3% hydrogen peroxide for 5 mins to block endogenous peroxidase. To block hydrophobic bonding and non-specific interactions, 200 µl of 2.5% bovine serum albumin was added onto each tissue slide for 5 mins and then washed in TBS saline plus 0.025% Triton X-100 for 5 mins, three times. Each tissue section was incubated with a primary antibody (primary mouse TGF-β1 monoclonal antibody; catalogue no. 846802, 1:500) at 37ºC for 2 h. Normal goat serum was applied onto the tissue slides at room temperature for 30 mins and washed in TBS for 5 mins, three times. The tissue slides were incubated with a secondary goat anti-mouse antibody (catalogue no. 405306, 1:1000) tagged with horseradish peroxidase for 45 mins at room temperature and washed in TBS for 5 mins, three times.
This chromogen had 3,3′-diaminobenzidine as its substrate to detect the peroxidase reaction. Then the tissue slides were stained with haematoxylin and lithium. After the slides dried, the tissue slides were mounted with Permount and covered with a coverslip. The negative control was performed by replacing the primary antibody with the normal mouse serum and subjecting it to the same protocol. The positive control for TGF immunostaining was ovarian tissue. We used the CaseViewer program (3DHISTECH) to assess the quantity and quality of TGF-β stains. TGF-β intensity was assessed in a systematic manner by randomly selecting five distinct regions within each slide. The grading process encompassed the evaluation of TGF-β expression within the glomerulus and tubulointerstitium. The TGF-β intensity score was then calculated according to the equation below. 26 The person performing the scoring was unaware of the tissue’s histological score.

where N is the total number of cells and N0.5, N1 and N2 are the numbers of TGF-β intensity: grades 0.5 (trace staining), 1 (mild staining) and 2 (strong staining), respectively.
Histopathological characteristic evaluation
In each periodic acid–Schiff staining specimen, four histopathological scores were examined and graded by a pathologist. The glomerular sclerosis score was graded from 0 to 4, depending on expansion of the sclerotic area: 27 0 = no sclerosis; 1 = expansion <25% of the glomerular surface area; 2 = 25–50% expansion; 3 = 50–75% expansion; and 4 = 75–100% sclerosis expansion. Mesangial cell proliferation was graded from 1 to 3, depending on the average cell number of mesangial areas in each glomerulus: 28 grade 1 = average cell number <4; grade 2 = average cell number 4–6; and grade 3 = average cell number >6. The interstitial fibrosis and tubular atrophy lesions were graded from 0 to 4 26 with modifications: 28 0 = absent; 0.5 = small focal areas of damage; 1 = involvement of <10% of cortex; 2 = involvement of <25–50%; and 4 = extensive damage involving >50% of the cortex.
Statistical analyses
Data are presented as mean ± SD. The Kaplan–Meier survival analysis was used to explore the relationship between the survival time of cats with CKD and the concentration of circulating TGF-β on the first day of diagnosis. A Cox proportional hazard model was used to identify the independent factors that influence survival in cats with CKD. A general linear model was used to compare the mean between groups. The predictive value for CKD was analysed using receiver operating characteristic (ROC) curve analysis with a calculated area under the curve (AUC). The correlation between TGF-β intensity by IHC and clinical/histopathological parameters was determined using Spearman’s rank correlation. A P value of less than 0.05 was considered significant.
Results
Circulating TGF-β in the serum was significantly lower in the cats with CKD (0.04 ± 0.02) than in the clinically healthy age-matched cats (0.08 ± 0.04; P <0.001) (Table 1, Figure 1). The inter-coefficient of variation values for circulating TGF-β in the healthy cats and the cats with CKD were determined to be 5% and 16%, respectively. The ROC curve analysis for the AUC of circulating TGF-β for the prediction of CKD was 0.781 (95% confidence interval = 0.62–0.93) (Figure 2).
Age, body weight, systolic blood pressure and blood parameters between age-matched clinically normal cats and cats with CKD

Data are n or mean ± SD unless otherwise indicated
P <0.01 when compared between the clinically normal cats and those with CKD by general linear model
P <0.001 when compared between the clinically normal cats and those with CKD by general linear model
P <0.05 when compared between the clinically normal cats and those with CKD by general linear model
BUN = blood urea nitrogen; CKD = chronic kidney disease; NA = not available; SDMA = symmetric dimethylarginine; WBC = white blood cell count

Transforming growth factor-beta (TGF-β) integrated density for 11 clinically healthy cats and 27 cats with chronic kidney disease (CKD). P value was calculated using a general linear model. ***P <0.001
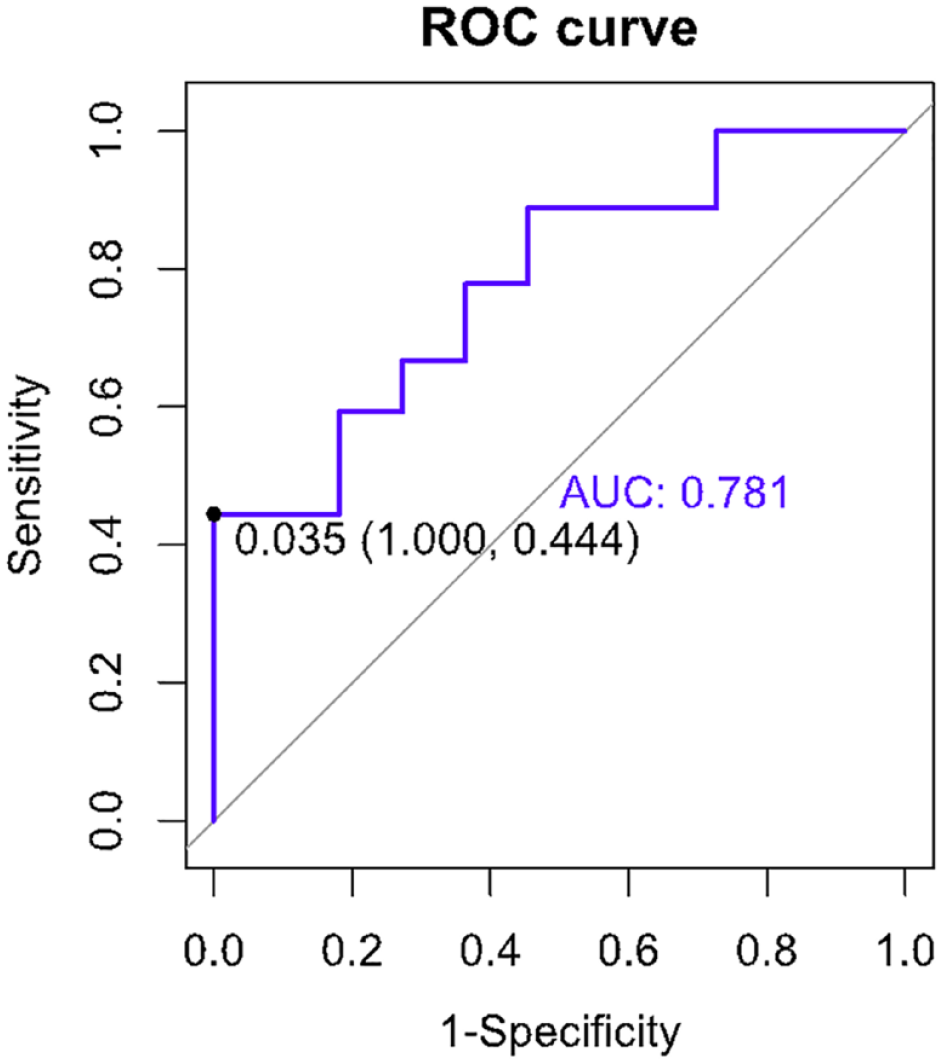
The area under the receiver operating characteristic (ROC) curve of circulating transforming growth factor-beta for the prediction of chronic kidney disease
The signalment and clinical parameters of age-matched clinically normal cats and those with CKD are shown in Table 1. The survival time of cats with the lower concentration of circulating TGF-β was shorter than that of cats with the higher concentration. The median survival times of cats with low and high concentrations of circulating TGF-β were 430 and 913 days, respectively, after the first day of diagnosis with symptomatic and conservative medical management (Figure 3).

Kaplan–Meier survival estimates by the level of circulating transforming growth factor-beta (TGF-β). The survival curve shows the survival time based on the level of circulating TGF-β. The high-level TGF-β group comprises 27 cats with circulating TGF-β more than 0.035. The low-level TGF-β group has 11 cats with circulating TGF-β less than 0.035. The survival time of cats in the latter group (*, median = 430 days) was shorter than that of cats in the former (*, median = 913 days)
Signalment and clinical parameters of seven cats with CKD that died during the study are shown in Table 2. These seven cats had CKD stage II (n = 2), stage III (n = 2) and stage IV (n = 3). There were three cats with CKD with no substaging and four cats with CKD with substaging that included blood pressure and proteinuria (n = 1), blood pressure (n = 2) and proteinuria (n = 1). The cats with CKD that died were aged 3.11–11 years (mean age: 7.20 ± 3.10).
Mean ± SD of the parameters of the dead CKD cats (n = 7)

Data are n or mean ± SD
ALP = alkaline phosphatase; ALT = alanine transaminase; BUN = blood urea nitrogen; CKD = chronic kidney disease; RBC = red blood cell count; WBC = white blood cell count
The TGF-β immunohistochemical staining in the tubulointerstitium (median ± interquartile range: 0.630 ± 0.292) was higher than in the glomerulus (median ± interquartile range: 0.496 ± 0.394). TGF-β was expressed in the glomeruli, proximal convoluted tubules, areas with mesangial cell proliferation, interstitial fibrosis area, loop of Henle, collecting ducts, distal convoluted tubules and areas of tubular atrophy (Figure 4). In the negative control, no stained section was found in the feline kidney (Figure 4a). As a positive control, TGF-β staining was observed in the feline ovary (Figure 4b).

(a) Transforming growth factor-beta immunohistochemical staining in the negative control. Positive control for immunostaining: staining is observed in (b) the ovary, (c) glomeruli and proximal convoluted tubules (PCT), (d) area with mesangial cell proliferation and mesangial matrix accumulation, (e) interstitial fibrosis area and (f,g,h) renal tubules, including the loop of Henle (LH), collecting ducts (CD), distal convoluted tubules (DCT) and areas of tubular atrophy. Original magnification ×400. Scale bar = 20 µm
The histopathological characteristics of the kidney samples included glomerular sclerosis, mesangial cell proliferation, interstitial fibrosis and tubular atrophy (Table 3). The scores of each periodic acid–Schiff-stained histopathological feature, ranging from grades 0 to 4, are shown in Table 3 and in Figures 1–4 in the supplementary material. Tubular atrophy had the highest score compared with the other histopathological characteristics, whereas mesangial cell proliferation had the lowest. TGF-β immunohistochemical staining had a significantly positive correlation with glomerular sclerosis and tubular atrophy (Figure 5).
Histopathological characteristics of renal tissues from cats with chronic kidney disease that died during the study (n = 7) and tissue banks with renal lesions (n = 10)

IQR = interquartile range

The correlation of transforming growth factor-beta intensity and histopathological characteristics of renal tissues from cats with chronic kidney disease that died during the study (n = 7) and tissue banks with renal lesions (n = 10). Correlation matrix using the corrplot R package. Positive correlations are represented by dark green circles, and negative correlations by brown circles. Colour intensity and the size of the circle are proportional to the Spearman rank correlation coefficients. Correlation coefficient values are displayed in the colour intensity bar
Discussion
In this study, the cats with CKD had significantly lower circulating TGF-β than clinically normal age-matched cats. This is in agreement with a study that reported low circulating TGF-β concentration in patients with end-stage kidney disease. 29 A total of 11 cats with CKD stages III and IV were included in our study. Conversely, in another study, a high circulating TGF-β concentration was associated with kidney disease in older community-dwelling adults. 30 The use of inclusion criteria in our study aimed to establish a population consisting solely of cats with CKD without concomitant systemic diseases. This selection process may have contributed to the observed disparity in TGF-β levels between the present study and the previous investigation. 30 Specifically, the previous study focused on a population primarily affected by cardiovascular disease, 30 highlighting the contrast in the population-based approach employed.
The clinical implication of decreased circulating TGF-β concentration in cats with CKD has not yet been explored. A study reported low serum TGF-β concentration in cats with CKD compared with healthy cats, but the findings were not significant. 18 Regarding other diseases, serum TGF-β1 concentration was significantly lower in human patients with thrombocytopenia 31 and coronary artery disease32,33 than in controls. TGF-β1 is produced by megakaryocytes, stored in platelet alpha-granules and released in serum by degranulation. 34 Two cats with CKD with thrombocytopenia in our study may have affected these results. Regarding coronary artery disease, it has been suggested that serum TGF-β1 is suppressed in advanced atherosclerosis due to the pro-inflammatory process. 35 Many published works have demonstrated renal inflammation, immune complex deposition and decreased renal fibrosis with enhanced nuclear factor kappa B signalling in TGF-β knockout mice.36–38 Moreover, serum TGF-β1 concentration is expected to decrease in response to the activation of pro-inflammatory cytokines, including interleukin-1, interleukin-6 and tumour necrosis factor. 39 Decreased serum TGF-β may be explained by the aforementioned protective role.40,41
Urinary TGF-β levels have been found to be elevated in cats with CKD when compared with healthy cats. 18 This increased urinary TGF-β may be attributed to increased renal tubular TGF-β immunoreactivity, which can arise as a consequence of renal injury. 42 In addition, the activation of renal tubular cells has been postulated as a key factor leading to the enhanced production of TGF-β. 43 Notably, this upregulation of TGF-β production in urine is thought to be associated with the activation of proximal tubular cells induced by persistent proteinuria. 43
The present study suggests that cats with a low circulating TGF-β have a considerably shorter life span than cats with a high circulating TGF-β. To the best of our knowledge, our study is the first to demonstrate an association between the survival time of cats with CKD and circulating TGF-β concentration. Survival analyses of cats with CKD in previous studies have only focused on death within 1 month 44 and the International Renal Interest Society (IRIS) stage based on serum creatinine. 45 However, a study reported an association between survival time and TGF-β in humans who had undergone kidney transplantation, finding a positive correlation between TGF-β polymorphism and long-term graft survival. 46 Our results can be explained by the protective effects of TGF-β in CKD. 40
According to current knowledge, tubular atrophy is a hallmark of CKD.47,48 In the present study, tubular atrophy was the most common histopathological characteristic of the cats with CKD. Renal tissues collected from cats with CKD that died during our study were mostly in IRIS stages III and IV (71.4%). In agreement with one study, tubular degeneration was significantly greater in these stages. 49 The mechanisms related to tubular atrophy are apoptosis, 50 oxidative stress 51 and tubular hypoxia. 48 One previous study also indicated oxidative stress in cats with CKD. 52
Previous studies have documented the presence of tubulointerstitial inflammation and fibrosis, as frequently observed histopathological manifestations in cats with CKD.11,53 However, in the present study, cats with CKD exhibited mild-to-moderate stages of interstitial fibrosis, indicating a relatively less advanced progression of this histopathological feature.
The present study indicates that TGF-β expression was predominantly in the tubulointerstitium. TGF-β staining was observed in the proximal convoluted tubules, interstitial fibrosis area, distal convoluted tubules and areas of tubular atrophy. These results are similar to those of previous studies involving other species.54 –56 In rats, TGF-β expression was in the renal tubulointerstitium, extracellular matrix and distal tubules.55,56 In mice, TGF-β was also in the proximal and distal tubules. 54 Moreover, TGF-β was prominently localised in kidney tissues from animals with kidney problems, including rats with unilateral ureteral obstruction, 56 rats with diabetic nephropathy 55 and mice with diabetes. 54
TGF-β expression had a significantly positive correlation with histopathological characteristics, including glomerular sclerosis and tubular atrophy, in this study. TGF-β has been shown to participate in renal tubule cell apoptosis. 57 Consistent with observations in other species afflicted with renal disorders, previous studies have emphasised a high expression of TGF-β within the renal tubules.54 –56 The positive area of TGF-β expression in the renal tubules of mice with diabetes was larger than that of non-diabetic mice. 54 In rats, there was a significant increase in TGF-β expression in the renal tubulointerstitium of rats with diabetic nephropathy. 55 TGF-β expression was prominent in the distal tubules of rats with unilateral ureteral obstruction rats. 56 Increased renal tubular TGF-β immunoreactivity may result from renal injury. 42
TGF-β plays a central role in CKD because it stimulates apoptosis in renal tubular epithelial cells, resulting in tubular atrophy. 58 The relationship between TGF-β expression and tubular atrophy is also implicated in tubulointerstitial fibrosis. 59 However, TGF-β staining intensity in the current study was not significantly associated with interstitial fibrosis scoring, as most of the cats with CKD had mild scores. These cats might have had mostly tubular atrophy and only early-stage tubulointerstitial fibrosis.
The age of the cats may have also contributed to the differences in histopathological findings between the present and previous studies. This study included cats with CKD aged approximately 7 years, whereas previous studies included cats with CKD aged over 9 years.9,11 Cats with CKD in Thailand are mostly Siamese and Siamese-mixed breeds with a lower age than reported in a previous study. 3
One of our study’s drawbacks is that the cats were not fully classified using the IRIS approach, with sub-staging depending on blood pressure and proteinuria. A small sample size is also a limitation factor for our study. We are unable to provide data on substaging in renal tissues from 10 cats with previous necropsy CKD with renal lesions. We only present data from the substaging of the seven cats with CKD that died during the study. Furthermore, it would have been valuable to include normal kidney samples for comparative analysis alongside the diseased kidneys.
In this study, we investigated decreased serum TGF-β and tubular TGF-β immunoreactivity in cats with CKD. TGF-β has a dual role of protecting against inflammation and, when enhanced in the kidney, facilitating dysregulated tissue repair. 41 Kidney TGF-β immunoreactivity relates to tubular atrophy through the mechanisms of apoptosis, 57 epithelial-to-mesenchymal transition 60 and inflammation. 38 These results highlight the significance of TGF-β concentration and localisation in cats with CKD.
Conclusions
The findings of our study demonstrate that cats with naturally occurring CKD have significantly lower circulating TGF-β than clinically healthy age-matched cats. In addition, the survival time of cats with CKD with a low concentration of circulating TGF-β is significantly shorter than that of cats with a high concentration. TGF-β expression was detected in areas of interstitial fibrosis and tubular atrophy, and our results indicate correlations between TGF-β expression and pathological changes, especially tubular atrophy. While this study included cats with CKD but no other illnesses, it is limited to this specific group. A larger study is needed to draw more generalisable conclusions.
Supplemental Material
Supplementary Figure 1:
In periodic acid–Schiff-stained sections, glomerular sclerosis scoring included grades 0–4.
Supplemental Material
Supplementary Figure 2:
In haematoxylin and eosinstained sections, mesangial cell proliferation scoring included grades 1 and 2.
Supplemental Material
Supplementary Figure 3:
In periodic acid–Schiff-stained sections, interstitial fibrosis scoring included grades 0–4.
Supplemental Material
Supplementary Figure 4:
In periodic acid–Schiff-stained sections, tubular atrophy scoring included grades 1–4.
Footnotes
Acknowledgements
We would like to thank the cats’ owners, nurses and clinicians from the Small Animal Veterinary Hospital, Faculty of Veterinary Medicine, Chiang Mai University for their support, encouragement and extensive help in case collection.
Supplementary material
The following files are available as supplementary material:
Supplementary Figure 1: In periodic acid–Schiff-stained sections, glomerular sclerosis scoring included grades 0–4.
Supplementary Figure 2: In haematoxylin and eosin-stained sections, mesangial cell proliferation scoring included grades 1 and 2.
Supplementary Figure 3: In periodic acid–Schiff-stained sections, interstitial fibrosis scoring included grades 0–4.
Supplementary Figure 4: In periodic acid–Schiff-stained sections, tubular atrophy scoring included grades 1–4.
Conflict of interest
The authors declared no potential conflicts of interest with respect to the research, authorship, and/or publication of this article.
Funding
This study was fully supported by the Thailand Research Fund and Office of the Higher Education Commission (grant number MRG6280209).
Ethical approval
The work described in this manuscript involved the use of non-experimental (owned or unowned) animals and procedures that differed from established internationally recognised high standards (‘best practice’) of veterinary clinical care for the individual patient. The study therefore had prior ethical approval from an established (or ad hoc) committee as stated in the manuscript.
Informed consent
Informed consent (verbal or written) was obtained from the owner or legal custodian of all animal(s) described in this work (experimental or non-experimental animals, including cadavers) for all procedure(s) undertaken (prospective or retrospective studies). No animals or people are identifiable within this publication, and therefore additional informed consent for publication was not required.
References
Supplementary Material
Please find the following supplemental material available below.
For Open Access articles published under a Creative Commons License, all supplemental material carries the same license as the article it is associated with.
For non-Open Access articles published, all supplemental material carries a non-exclusive license, and permission requests for re-use of supplemental material or any part of supplemental material shall be sent directly to the copyright owner as specified in the copyright notice associated with the article.