
Abstract
Objectives
The aim of this study was to determine whether high-protein and high-carbohydrate diets exert differential effects on serum cholesterol, triglyceride and fructosamine concentrations in healthy cats.
Methods
A randomised, crossover diet trial was performed in 35 healthy shelter cats. Following baseline health assessments, cats were randomised into groups receiving either a high-protein or high-carbohydrate diet for 4 weeks. The cats were then fed a washout diet for 4 weeks before being transitioned to whichever of the two studied diets they had not yet received. Fasting serum cholesterol, triglyceride and fructosamine concentrations were determined at the end of each 4-week diet period.
Results
Cats on the high-carbohydrate diet had significantly lower serum cholesterol (P <0.001) concentrations compared with baseline measurements. Cats on the high-protein diet had significantly higher serum cholesterol (P <0.001) and triglyceride (P <0.001) concentrations, yet lower fructosamine (P <0.001) concentrations compared with baseline measurements. In contrast, overweight cats (body condition score [BCS] >5) had lower cholesterol (P = 0.007) and triglyceride (P = 0.032) concentrations on the high-protein diet than cats within other BCS groups.
Conclusions and relevance
Diets higher in protein and lower in carbohydrates appear beneficial for short-term glucose control in healthy cats. A high-protein diet was associated with significantly elevated cholesterol and triglyceride concentrations in healthy cats, even though the increase was significantly less pronounced in cats with a BCS >5. This finding suggests that overweight cats process high-protein diets, cholesterol and triglycerides differently than leaner cats.
Introduction
The cat is an obligate carnivore with various nutritional peculiarities adapted to a diet high in protein and low in carbohydrates. 1 While older research postulated that high-carbohydrate diets increased the risk of obesity in cats, 2 more recent literature has presented contrasting findings. 3 Obesity in cats is associated with an increased risk for the development of diabetes mellitus (DM). 2 Dietary therapy for diabetic cats focuses on reducing obesity, increasing muscle mass, decreasing postprandial hyperglycaemia and controlling blood glucose fluctuations by minimising the need for beta cells to produce insulin. 4 Current evidence suggests that a high-protein, low-carbohydrate diet – relative to a high-carbohydrate diet – can benefit cats with DM.5 –8 Furthermore, clinical signs, blood glucose measurements and fructosamine concentrations can be used to monitor glycaemic control and response to therapy.9 –15 While researchers agree that high-protein diets can help manage DM and obesity in cats,5 –8,16 there is limited literature as to whether this type of diet would be advantageous to the healthy cat.
There are conflicting reports about how carbohydrates and fats influence the glycaemic response in healthy cats. High-fat diets are associated with diminished glucose clearance and beta cell function 17 in contrast to high-carbohydrate diets.18,19 There is also contradictory evidence regarding the influence of fibre on glycaemic control in cats. While some have demonstrated better glycaemic control, 20 others have failed to replicate these findings. 6 Most of the research that has assessed how diet composition influences the feline glycaemic response has focused on DM.5,6,8,20 with only a few studies using healthy cats.17,18,21,22 Furthermore, these investigations differ widely in study design, feeding protocols, population size and diet composition, which makes comparisons between studies difficult.
Several studies have reported that a high-protein and low-carbohydrate diet does not significantly affect serum triglyceride concentrations in cats.19,23,24 In comparison, cats fed diets high in fat had significant increases in triglyceride concentrations.17,25,26 Although high-fibre foods lower triglyceride concentrations in diabetic cats 20 they increase cholesterol concentrations in healthy cats. 27 Previous studies evaluating the effects of high-fat diets on cholesterol concentrations have been contradictory. Some have reported that high-fat diets do not contribute to hypercholesterolaemia,25,28,29 while another has reported that high-fat diets do contribute to hypercholesterolaemia in healthy cats. 17 Moreover, diabetic cats with increased serum cholesterol concentrations are 65% less likely to achieve diabetic remission than cats with normal serum cholesterol concentrations. 30 This suggests that hypercholesterolaemia plays a primary role in the progression of diabetes in cats by possibly preventing the recovery of beta cell function. 30 This theory is supported by several murine studies that have shown that elevated cholesterol concentrations can impair beta cell function.31,32 The current literature has also reported increased cholesterol concentrations in lean, overweight and diabetic cats on the traditional high-protein diet prescribed to diabetic cats. 23
The aim of this study was to determine the effect of three diets on serum cholesterol, triglyceride and fructosamine concentrations in lean, normal and overweight non-diabetic cats.
Materials and methods
Experimental design
The study was a randomised, crossover clinical trial that was approved by the Animal Ethics Committee of the University of Pretoria (V079-18).
Animals
Forty cats were recruited from an animal shelter, with 35 cats completing the study. Of the 40 cats, 30 were female and 10 were male, and all were neutered. Equal numbers of each sex were not chosen as animal selection depended on the availability of cats at the animal shelter. Three cats were excluded owing to early renal insufficiency, while a further two were excluded owing to behaviour-related issues. To assist in proper identification, all cats were microchipped (Backhome; Virbac RSA). The inclusion criteria were: age >1 year; not affected by overt renal or liver disease, DM or hyperthyroidism; negative for feline immunodeficiency virus (FIV) and feline leukaemia virus (FeLV); not on any concurrent medical therapy; acceptance of restraint, venepuncture and all diets; no history of chronic vomiting or diarrhoea; known birthdate; and complete vaccination record.
Feeding protocol
All diets used are detailed in Table 1. Prior to enrolment, participating cats were fed a commercial maintenance/baseline diet by the animal shelter. Following baseline health assessments, cats were randomised into groups that were fed either a high-protein or high-carbohydrate diet for 4 weeks. After these 4 weeks, cats were fed a washout diet for 4 further weeks. The principal limitation of a crossover trial is that the effects of one treatment may ‘carry over’ and alter the response to subsequent treatments. Thus, to prevent this, a washout diet, which was an intermediate between the high-protein and high-carbohydrate diet, was chosen. Additionally, 4 weeks were selected to mimic the same amount of time that the cats spent on each of the study diets. Thereafter, they were transitioned to the crossover diet (Figure 1). Each cat was transitioned between diets over 7 days. Cats were fed ad libitum of the dry and wet diets. Body condition score (BCS) was determined based on the nine-point BCS chart. 33 Clinical examinations, BCS, weight and environmental temperature (non-contact infrared thermometer [Electromann SA]) measurements, were conducted on a weekly basis. Both dry and wet high-protein diets were offered to all cats, while only a dry diet for the high-carbohydrate and washout diet.
Comparison of the diets (reported on a dry matter basis) used in the 35 cats that completed the study


Flowchart highlighting the research process in the 40 cats enrolled in the study and randomised into the groups receiving either a high-carbohydrate (HC) or high-protein (HP) diet first, with the former order specifically shown here. BCS = body condition score; CBC = complete blood count; TT4 = total thyroxine
Health assessment and laboratory tests
Cats were determined as healthy based on history, physical examination and laboratory tests. Blood samples were collected from all 40 cats prior to the start of the study after a 12 h fast. Blood was collected from the jugular vein by needle venepuncture and placed into one serum and one EDTA tube. Serum cholesterol, triglyceride, alkaline phosphatase, alanine aminotransferase, gamma-glutamyl transferase, blood urea nitrogen, creatinine, glucose, albumin, globulin and total serum protein levels were measured using the Cobas Integra 400 plus analyser (Roche Diagnostics). The ADVIA 2120 Hematology System (Siemens Healthineers) was used to obtain all complete blood counts (CBCs). Total thyroxine concentrations were measured with the Immulite 2000 immunoassay system (Siemens Healthineers). Fructosamine concentration was determined using a colorimetric method on the Cobas Integra 400 plus analyser. A SNAP Combo plus (IDEXX Laboratories) ELISA for the simultaneous detection of FeLV antigen and antibodies for FIV was performed. All biochemistry and CBCs were performed at the Clinical Pathology Laboratory at the Faculty of Veterinary Science, University of Pretoria. Fructosamine concentrations were determined at a commercial laboratory (IDEXX Laboratories, Johannesburg, South Africa). Blood samples were collected from the cats after the 4-week feeding period with the high-protein, high-carbohydrate and washout diets. Blood samples were centrifuged and serum centrifuged, separated and refrigerated within 1 h of collection. Thereafter, serum was aliquoted and frozen at –80°C within 24 h of collection. At the end of the study, all collected specimens were analysed in a single batch.
Statistical analyses
Data were assessed for normality of distribution by plotting histograms, calculating descriptive statistics and performing the Anderson-Darling test (MINITAB Statistical Software, Release 13.32). Right-skewed data were transformed using the natural logarithm. Categorical data were described using proportions and 95% confidence intervals, while quantitative data were described using medians and interquartile ranges. Quantitative data were further evaluated by creating boxplots using the ggplot2 package (Wickham, 2009) within R (R Development Core Team, 2017). Categorical data were compared between cats based on the first diet assignment groups using χ2 tests (Epi Info, version 6.04; CDC). Quantitative data were compared between initial diet assignment groups using independent t-tests on the raw or natural logarithm transformed data. Mann–Whitney U-tests were used when the normality assumption was violated. Mixed-effects linear models were created to determine the effect of diet and BCS on serum cholesterol, triglyceride and fructosamine concentrations. Cat was included as a random effect in all models and the correlation among repeated measures was modelled using a first-order autoregressive (AR1) covariance structure. Evaluated fixed effects included diet, ordinal BCS groupings, sex, breed, age, experimental room, room temperature and pairwise interactions between BCS and diet. Complete models were fit and a backwards stepwise process was employed to remove predictors with the largest P values until all remaining variables had significant slope parameters. Unless otherwise stated, SPSS (IBM SPSS Statistics Version 25) was used for all statistical analyses. Significance was set at P <0.05.
Results
Baseline data
There were no statistical differences in the baseline data between the two initial diet groups (Tables 2 and 3).
Comparison of baseline demographics and serum chemistry parameters in the 40 cats enrolled in the study and randomised into the groups receiving either a high-carbohydrate (HC) or high-protein (HP) diet first
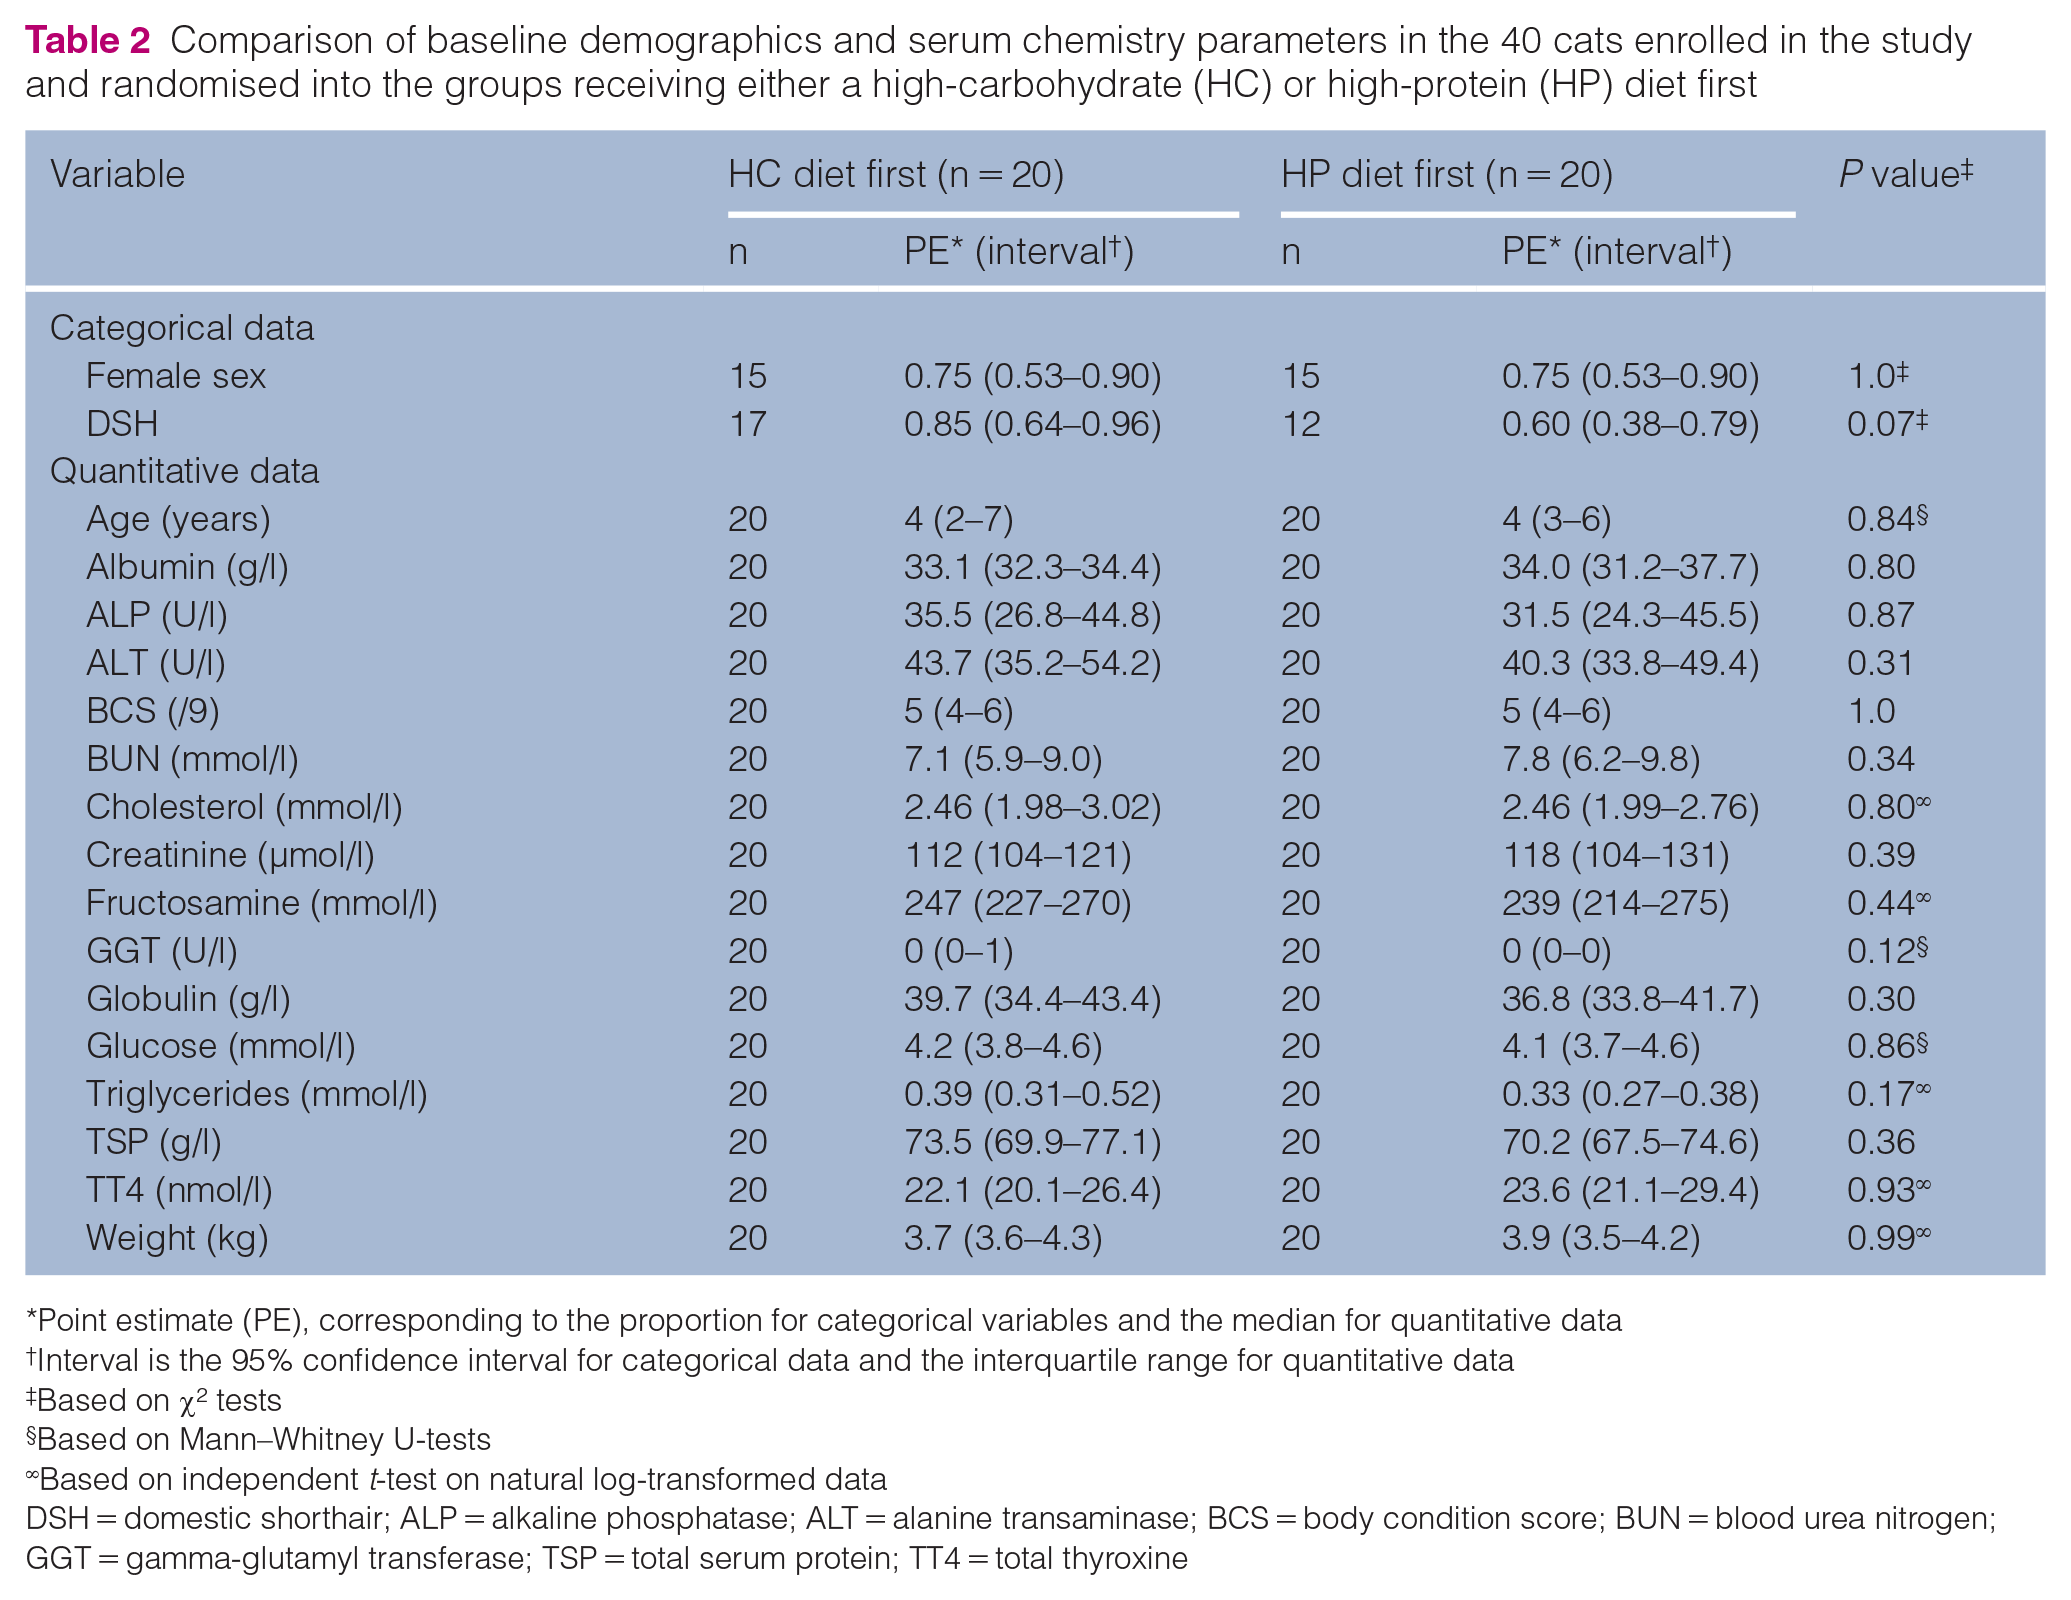
Point estimate (PE), corresponding to the proportion for categorical variables and the median for quantitative data
Interval is the 95% confidence interval for categorical data and the interquartile range for quantitative data
Based on χ2 tests
Based on Mann–Whitney U-tests
Based on independent t-test on natural log-transformed data
DSH = domestic shorthair; ALP = alkaline phosphatase; ALT = alanine transaminase; BCS = body condition score; BUN = blood urea nitrogen; GGT = gamma-glutamyl transferase; TSP = total serum protein; TT4 = total thyroxine
Comparison of complete blood count results in the 40 cats enrolled in the study and randomised into the groups receiving either a high-carbohydrate (HC) or high-protein (HP) diet first
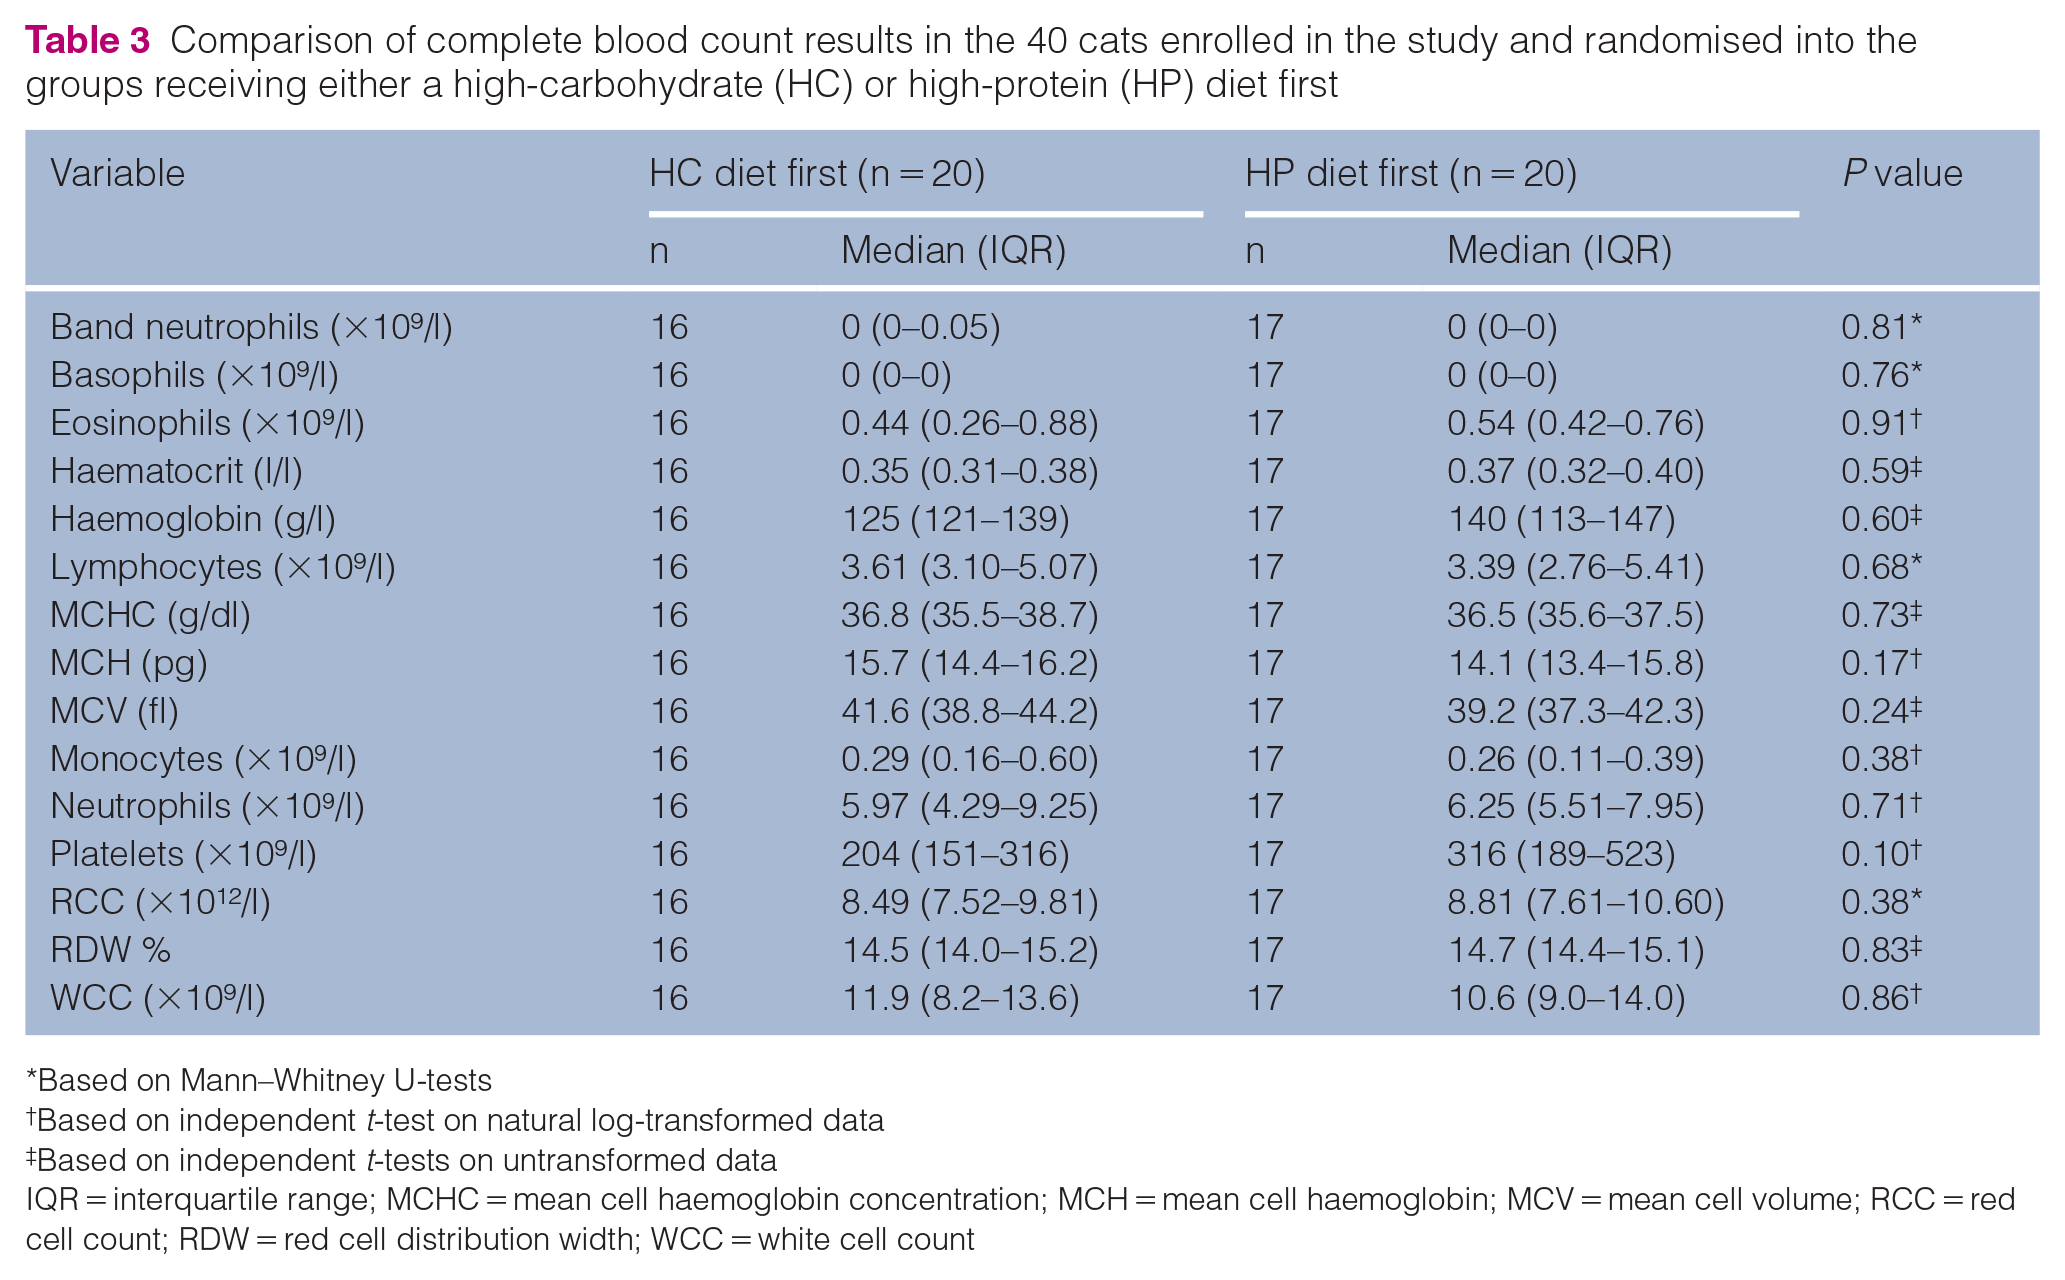
Based on Mann–Whitney U-tests
Based on independent t-test on natural log-transformed data
Based on independent t-tests on untransformed data
IQR = interquartile range; MCHC = mean cell haemoglobin concentration; MCH = mean cell haemoglobin; MCV = mean cell volume; RCC = red cell count; RDW = red cell distribution width; WCC = white cell count
Body weight
Having been fed a high-protein diet (P = 0.001), being male (P <0.001) and having a BCS >5 (P = 0.002) were significant predictors of heavier body weights (Table 4).
Multivariable associations between body weight*, diet and body condition score (BCS) in the 35 cats that completed the study
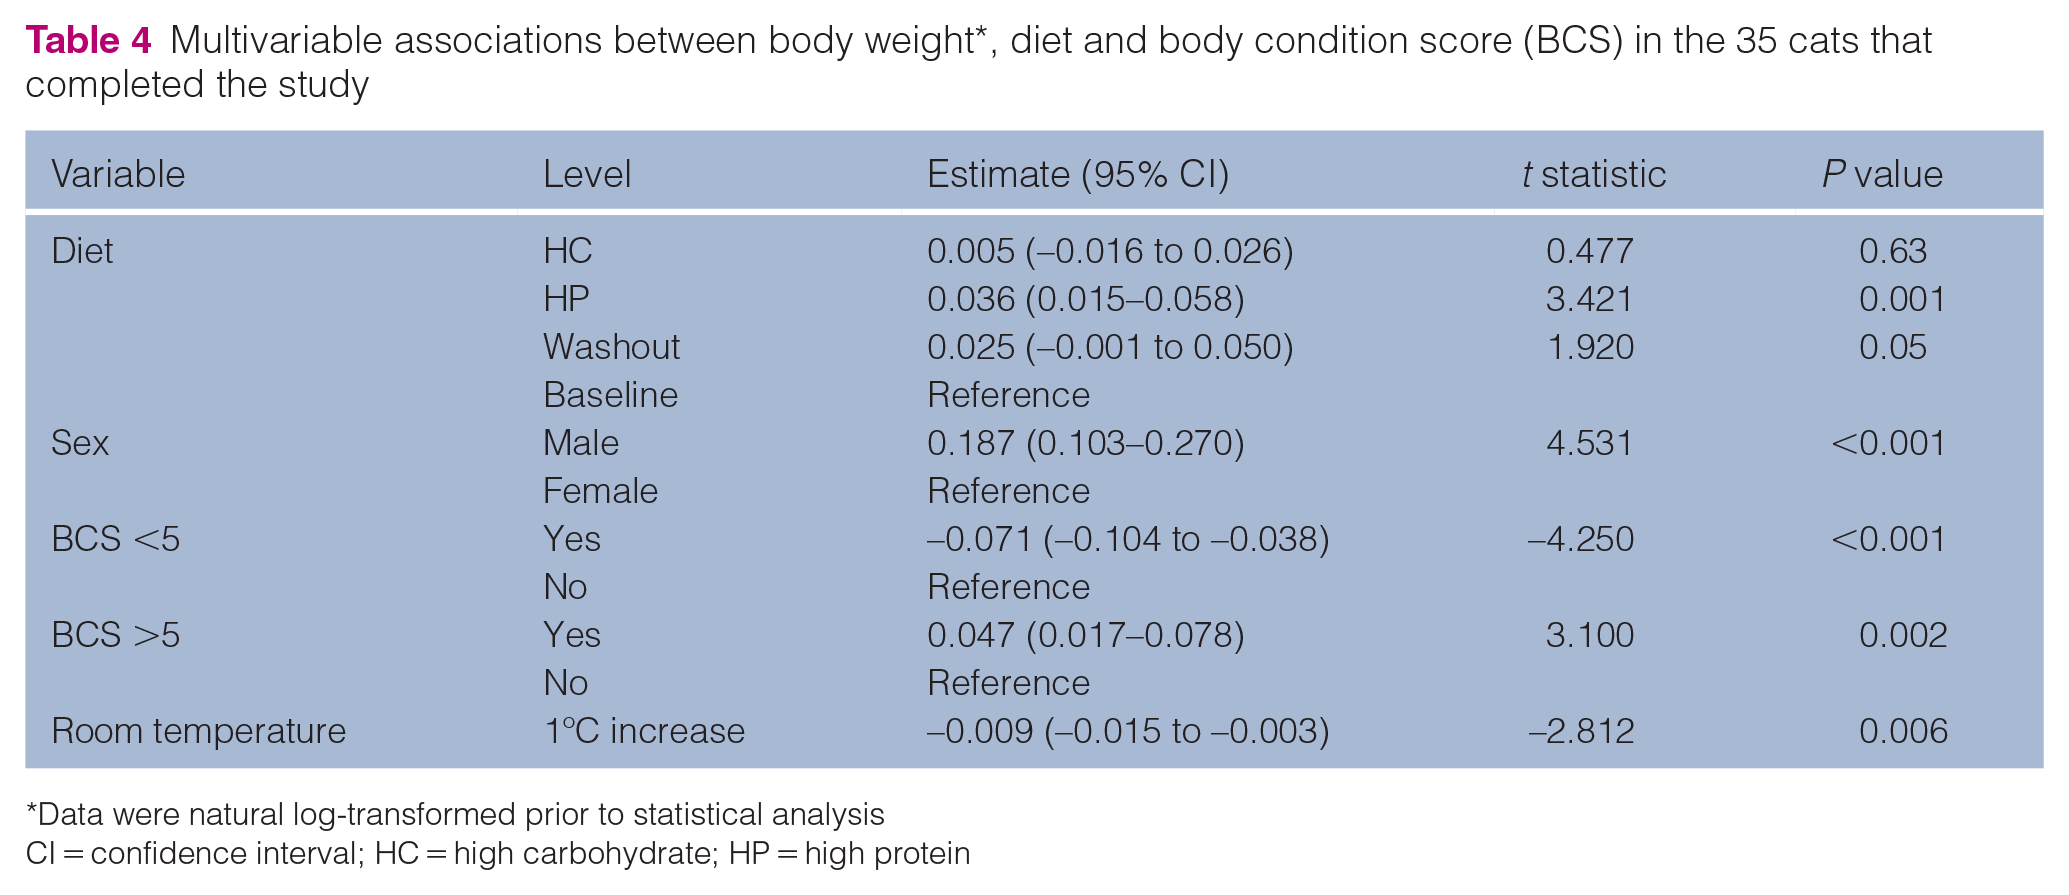
Data were natural log-transformed prior to statistical analysis
CI = confidence interval; HC = high carbohydrate; HP = high protein
Cholesterol
Median cholesterol concentrations were highest on the high-protein diet (Figure 2; Table 5). Cholesterol concentrations were above the reference interval (RI) in 10% (n = 15/145) of the samples, of which 87% (n = 13/15) represented the high-protein diet and 13% (n = 2/15) the washout diet. Ninety percent (n = 130/145) of the cholesterol concentrations of the remainder of the samples were either within or just below the RI. Cats on the high-carbohydrate diet had significantly lower (P <0.001) cholesterol concentrations than cats on either the high-protein (P <0.001) or washout diets (P <0.001; Table 6). Moreover, cats with a BCS >5 and that were fed a high-protein diet had significantly lower (P = 0.007) cholesterol concentrations than cats from other BCS groups.
Descriptive statistics for the 35 cats that completed the study

IQR = interquartile range; BCS = body condition score; HC = high carbohydrate; HP = high protein
Multivariable associations between serum cholesterol*, diet and body condition score (BCS) in the 35 cats that completed the study

Data were natural log-transformed prior to statistical analysis
CI = confidence interval; HC = high carbohydrate; HP = high protein
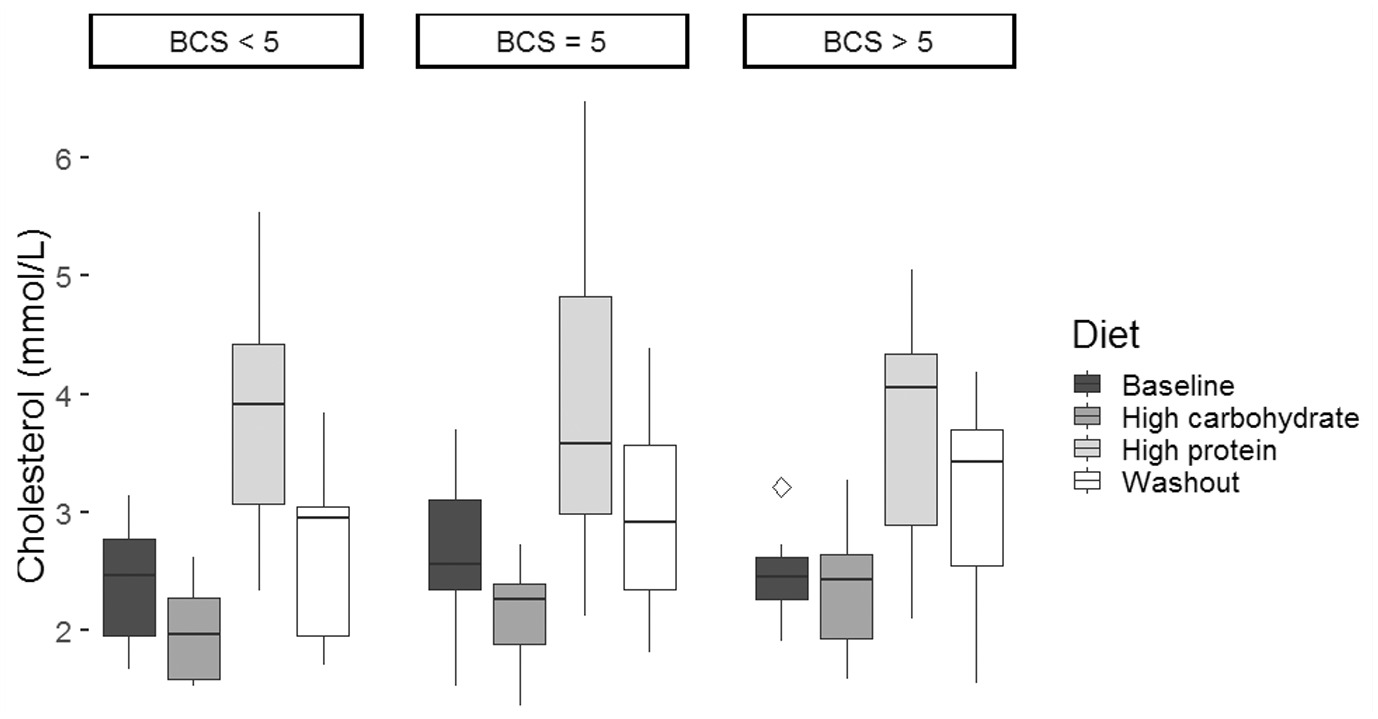
Serum cholesterol values for the 35 cats, separated according to body condition score (BCS), that completed the study. Data are shown as median (horizontal line within box), 25th and 75th percentiles (horizontal ends of boxes), and 10th and 90th percentiles (vertical lines)
Triglycerides
Median triglyceride concentrations were lowest on the washout diet (Figure 3; Table 5). None of the triglyceride concentrations was above the RI. Cats that had been fed the washout diet had significantly lower (P = 0.009) concentrations of triglycerides, whereas cats fed the high-protein diet had significantly higher (P <0.001; Table 7) concentrations. Cats with a BCS >5 and fed a high-protein diet had significantly (P = 0.03) lower triglyceride concentrations than those from other BCS groups.
Multivariable associations between serum triglycerides*, diet and body condition score (BCS) in the 35 cats that completed the study

Data were natural log-transformed prior to statistical analysis
CI = confidence interval; HC = high carbohydrate; HP = high protein
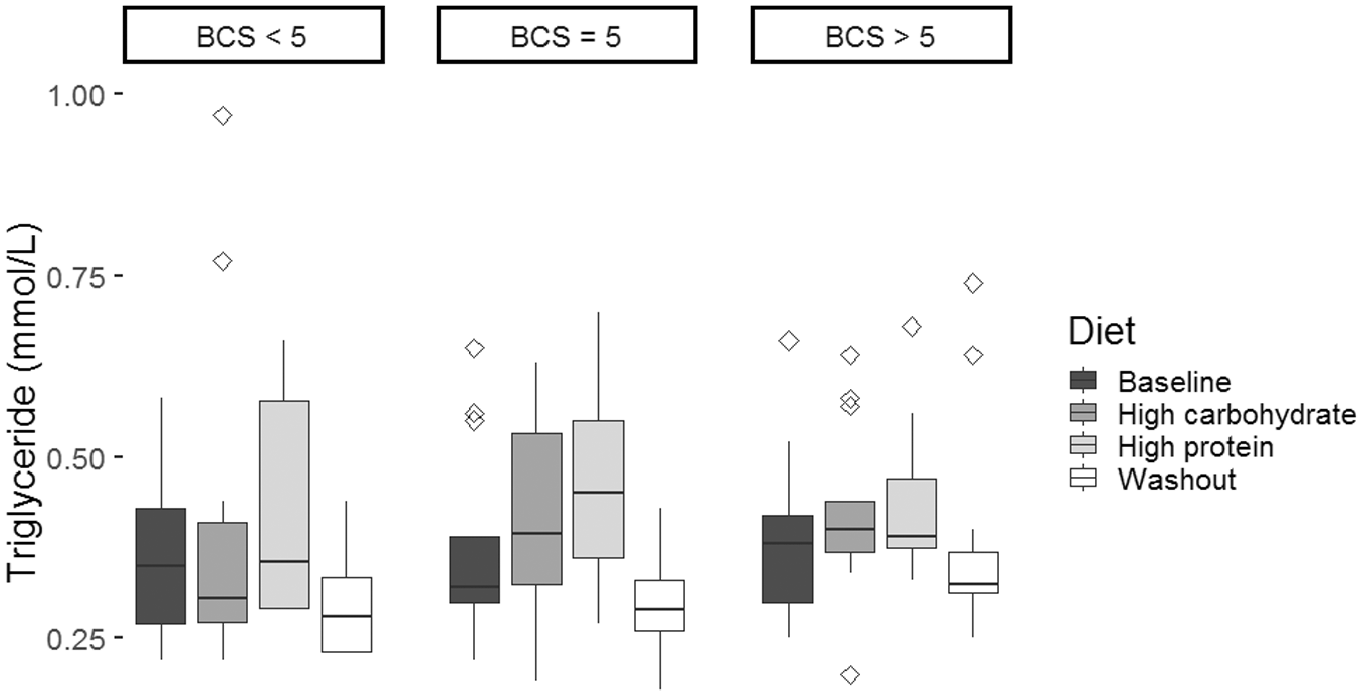
Serum triglyceride values for the 35 cats, separated according to body condition score (BCS), that completed the study. Data are shown as median (horizontal line within box), 25th and 75th percentiles (horizontal ends of boxes), and 10th and 90th percentiles (vertical lines)
Fructosamine
Median fructosamine concentrations were highest in cats fed the high-carbohydrate diet (Figure 4; Table 5). Only 6% (n = 9/143) of the fructosamine samples were below the RI; of these, four represented cats on the high-protein diet, four on the washout diet and one on the baseline diet. The remaining 94% (n = 134/143) of samples were within the RI. Cats on either the high-protein or washout diets had significantly lower (P <0.001) fructosamine concentrations than other cats (Table 8).
Associations between serum fructosamine* and diet in the 35 cats that completed the study

Data were natural log-transformed prior to statistical analysis. No multivariable model fit the data
CI = confidence interval; HC = high carbohydrate; HP = high protein
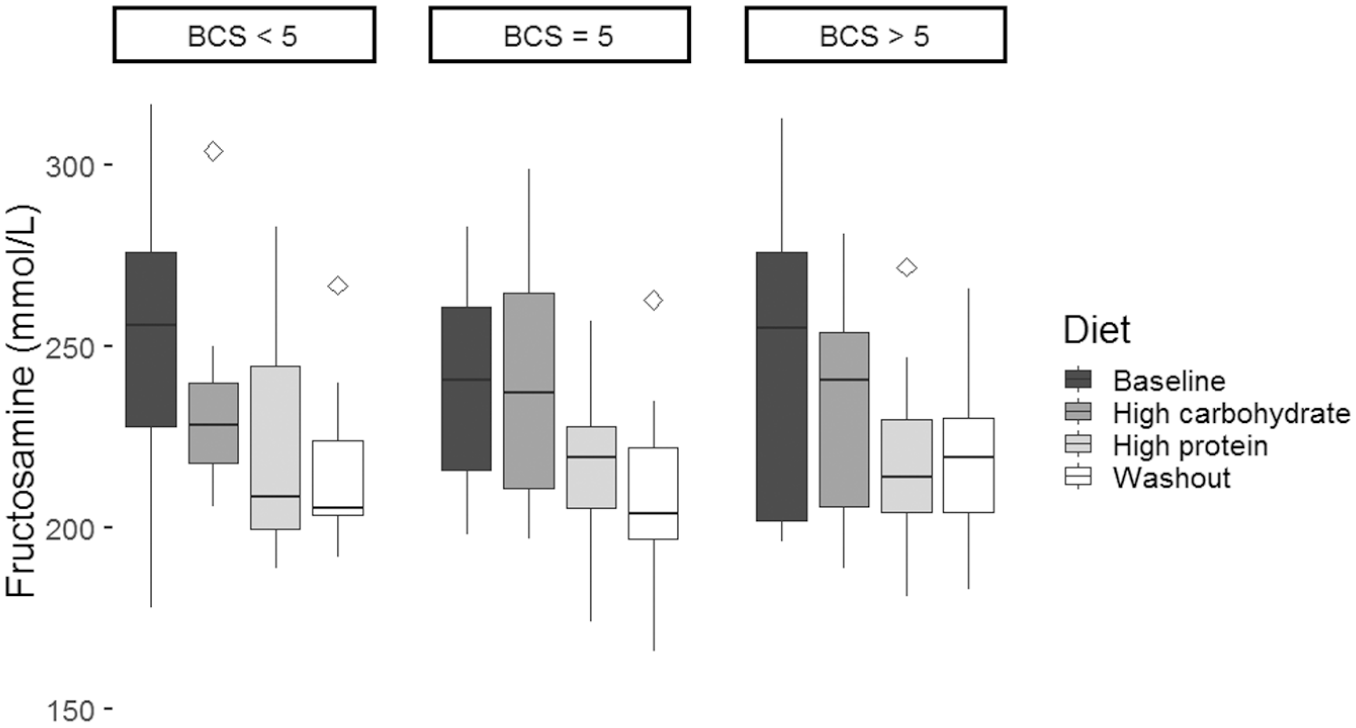
Serum fructosamine values for the 35 cats, separated according to body condition score (BCS), that completed the study. Data are shown as median (horizontal line within box), 25th and 75th percentiles (horizontal ends of boxes), and 10th and 90th percentiles (vertical lines)
Discussion
This study showed that cats on a high-carbohydrate diet had significantly lower serum cholesterol concentrations than cats on the maintenance diet. Cats on a high-protein diet had significantly higher serum cholesterol and triglyceride concentrations, yet lower fructosamine concentrations than baseline measurements. In contrast, overweight cats (BCS >5) had lower cholesterol and triglyceride concentrations on a high-protein diet than cats representing other BCS groups.
It has been shown that neutered male cats are at an increased risk of obesity vs intact males, and therefore at greater risk for developing DM.22,34,35 In the current study, neutered male cats were significantly heavier than neutered female cats, which is in agreement with previous findings.36,37 It has been postulated that high-carbohydrate diets increase the risk for obesity in cats; 22 however, there are few epidemiological studies available that either support or refute this claim. 35 In the current study, cats on a high-carbohydrate diet were not heavier than cats on other diets. This supports prior reports that cats limit their total energy intake when consuming a high-carbohydrate diet.18,38 However, lack of weight gain in this study could have resulted from a lack of uniformity in caloric intake between groups and the time on each diet. Dietary protein is an important component of weight loss diets, 39 as high-protein diets have been shown to promote fat loss in cats. 16 However, offering overweight cats an ad libitum high-protein diet increases food intake – perhaps due to increased palatability – without any noticeable changes in body weight or composition. 24 Our ad libitum experiment demonstrated that cats fed a high-protein diet were heavier than cats on other diets.
In diabetic cats, hypercholesterolaemia reduces the chance of remission by almost 65%. Although hypercholesterolaemia can contribute to the pathogenesis of DM in cats, 30 its effects on healthy cats are still debateable. Prior research has reported that diabetic, lean and overweight cats fed a high-protein diet had higher serum cholesterol concentrations. 23 In this study, cats that were fed a high-protein diet had significantly higher cholesterol concentrations compared with other cats. Cats fed the high-protein diet had elevated median cholesterol concentrations among all three BCS groups. Interestingly, overweight cats on the high-protein diet did not have a large increase in serum cholesterol concentrations. The mechanism through which ingested protein is coupled to upregulated cholesterol production requires further study.
Studies have indicated that insoluble fibre is positively associated with cholesterol concentrations in overweight cats. It has been speculated that fibre can interfere with the absorption of specific fat components that could subsequently alter which lipoproteins are synthesised in the liver. 27 It should be noted that the high-protein diet of the current study had considerably higher crude insoluble fibre content than the high-carbohydrate diet. The high-protein diet had nearly double the amount of fat that was in the high-carbohydrate diet. It has been reported that a high-fat diet does not contribute to hypercholesterolaemia.25,28,29 Nevertheless, prior studies of cats fed a high-fat diet reported higher cholesterol concentrations than cats fed a high-carbohydrate diet. 17 Cats in the current study fed the high-carbohydrate diet, which has a low fibre, protein and fat content, had lower cholesterol concentrations, while cats fed the high-protein diet, which has high fibre, protein and fat content, had increased cholesterol concentrations. As interactions between different dietary components may have exerted an additive role in these findings; further studies are required to specifically address lipoprotein fractions.
There are conflicting reports of the influence of diet on triglyceride concentrations in cats. Several studies have reported that a high-protein and low-carbohydrate diet does not significantly affect triglyceride concentrations in cats,19,23,24 whereas others have shown that a high-fat diet results in a significant increase in triglyceride concentrations.17,25,26 The current study showed that a high-protein diet increased triglyceride concentrations in healthy cats. The discrepancies between these findings and previous reports might be due to the differences in study design. Overweight cats generally have higher triglyceride concentrations than healthy cats. 40 In this current study, lean and normal cats fed a high-protein diet and overweight cats fed a high-carbohydrate diet had the highest median triglyceride concentrations. In this study, cholesterol and triglyceride concentrations in overweight cats decreased when fed a high-protein diet.
Diabetic cats can benefit from high-protein and low-carbohydrate diets by higher diabetic remission rates, 6 lower fructosamine concentrations 8 and improved glycaemic control.5,8 The majority of studies on the effect of diet composition on feline glycaemic response have focused on diabetic cats,5 –8,20 with only a few studies involving healthy cats.17,18,21,22 The current study showed that cats on the high-carbohydrate diet tended to have the highest median fructosamine concentrations. In the literature, there are conflicting reports on the effect of carbohydrates and fats on the glycaemic response in healthy cats. One study showed that cats fed a high-fat diet had a diminished glucose clearance and beta cell function relative to cats fed a high-carbohydrate diet. 17 There is also evidence that high-carbohydrate diets cause higher insulin 26 and post-prandial glucose concentrations18,19 vs healthy cats fed high-fat and high-protein diets. There seems to be a complex link between diet and fructosamine concentrations among healthy cats; more specifically, the current study revealed that carbohydrate and fat contents were positively and negatively, respectively, linked with fructosamine concentrations in healthy cats.
In this study, cats on both high-protein and washout diets had significantly lower fructosamine concentrations compared with cats on the other diets. These findings agree with the finding that healthy cats fed high-protein diets with either low or moderate levels of starch had significantly decreased glucose and fructosamine concentrations compared with moderate-protein and high-starch diets. 41 There is conflicting evidence regarding the influence of fibre on the glycaemic control in cats. Glycaemic control in cats with DM improved when fibre intake was increased to moderate levels, 20 which is in contrast to other studies that showed the opposite. 6 Cats continue with post-prandial gluconeogenesis from protein, which might explain why fibre is potentially less effective in this species.42,43 Even though the exact mechanisms underlying these findings remain unknown, it is speculated that dietary fibre affects the nutrient transit rate in the gut, which subsequently reduces glucose absorption along with post-prandial glycaemia and enhances glycaemic control.20,44 This study suggests that diets high in protein, fibre and fat, but low in carbohydrates, could contribute to decreased glucose concentrations in healthy cats.
This study had several limitations. The included cats were not fed according to their individual nutritional requirements, but ad libitum to simulate the situation in private, multi-cat households. Ad libitum feeding is regarded as a risk factor for obesity, and thus the feeding strategy in this study might have inadvertently predisposed the participating cats to gain weight. 45 The amount of food that each cat ingested was not recorded and thus some cats might have preferred one type of food to another, which could have introduced bias. Additionally, a hierarchical structure will occur with group housing of cats with dominant animals eating more and submissive animals eating less. While this might have introduced bias, an adaptation period of 2 months to identify these cats was performed to reduce this limitation. Two such cats were identified and excluded. Finally, wet food was only used for the high-protein diet and this could have influenced the present findings; however, the dietary contents of the wet and dry high-protein diets had very similar protein, carbohydrate and fat composition. Additionally, both types of feed (wet and dry) of this specific diet would traditionally be given to a cat in the clinical setting, and we attempted to replicate the decision a clinician would face in private practice.
Conclusions
Diets with a high protein but low carbohydrate content might be beneficial for short-term glucose control in healthy cats. The reduction in cholesterol and triglyceride concentrations in overweight cats on a high-protein diet, relative to lean and normal cats on the same diet, is a novel result that warrants further investigation. The finding that a high-protein diet significantly increased cholesterol and triglyceride concentrations and a high-carbohydrate diet significantly decreased cholesterol concentrations in healthy cats relative to other diets also warrants further investigation.
Footnotes
Acknowledgements
The authors thank the staff of the Animal-Anti Cruelty League for the care of the animals and usage of their facilities and nurses Jade Little and Roxanne Lundin for their assistance.
Author note
This paper was presented as a poster presentation at the annual ECVIM-CA online congress, 2–5 September 2020.
Conflict of interest
The authors declared no potential conflicts of interest with respect to the research, authorship, and/or publication of this article.
Funding
This work was supported by the Pathobiology research theme of the Faculty of Veterinary Science of the University of Pretoria, the South African Veterinary Foundation (grant number SAVF 1652); the Health and Welfare Sector Education and Training Authority (grant number 2808743). Hill’s provided all the food and Virbac provided all the microchips. None of the funders and companies mentioned above had any role in the design, analysis and writing of this article.
Ethical approval
The work described in this manuscript involved the use of non-experimental (owned or unowned) animals. Established internationally recognised high standards (‘best practice’) of veterinary clinical care for the individual patient were always followed and/or this work involved the use of cadavers. Ethical approval from a committee was therefore not specifically required for publication in JFMS. Although not required, where ethical approval was still obtained, it is stated in the manuscript.
Informed consent
Informed consent (either verbal or written) was obtained from the owner or legal custodian of all animal(s) described in this work (either experimental or non-experimental animals) for the procedure(s) undertaken (either prospective or retrospective studies). No animals or people are identifiable within this publication, and therefore additional informed consent for publication was not required.
This paper was handled and processed by the European Editorial Office (ISFM) for publication in JFMS