
Abstract
Objectives
Flow cytometric (FCM) immunophenotyping of lymphoid tissue aspirates is an available adjunct for feline lymphoma diagnostics. Reference data have only been established for feline peripheral blood. Studies investigating the composition of normal and mildly reactive feline lymph nodes (LNs) are lacking. The aim of this prospective study was to establish reference data for lymphocyte subpopulations in normal and mildly reactive feline peripheral LNs using a standardised multicolour panel of antibodies.
Methods
Macroscopically inconspicuous mandibular and/or popliteal LNs from 31 adult cats, which were euthanased for reasons other than haematological diseases, were excised and processed within 5 h after death. Multicolour flow cytometry using eight different feline-specific, anti-canine and human cross-reactive monoclonal antibodies used in current diagnostic marker panels was performed after cytological exclusion of pathological states and complemented by lymphocyte clonality testing, histopathology and immunohistochemistry (IHC) to ensure the absence of lymphoid disease.
Results
Of 31 cats, the immunophenotyping data of 24 individuals could be included as histopathology and clonality testing excluded a pathological condition. Lymphocyte populations showed the following positive antibody reactions: CD18+ 86.3% ± 13.86%, CD3+ 54.81% ± 11.10%, CD5+ 57.39% ± 12.66%, CD21+ 40.42% ± 12.40%, CD79alphacy+ (CD79αcy) 30.41% ± 13.49% and CD14+ 0.75% ± 1.35%. There were 30.88% ± 13.48% CD4+ and 12.91% ± 6.68% CD8+ cells. Cytology revealed a mixed population of mostly lymphoid cells in all samples. The absence of a monoclonal/oligoclonal neoplastic population was confirmed by lymphocyte clonality testing. Histopathology and IHC showed a normal or mildly reactive pattern in all cases.
Conclusions and relevance
This study establishes FCM immunophenotyping data of lymphocyte populations of normal and mildly reactive feline peripheral LNs. For the first time, anti-CD5, CD4, CD8 and CD21 reference data in normal and mildly reactive feline peripheral LNs are presented. CD18, CD3, CD14 and CD79αcy have been used to establish reference data for the first time in any feline material.
Introduction
Owing to the increasing availability of monoclonal antibodies directed against leukocyte populations of pet animals, especially cats and dogs, immunophenotyping of lymphocyte subpopulations has become standard practice in the diagnostic work-up of lymphoma and leukaemia. 1 Nevertheless, in the current literature, compared with dogs, significantly fewer phenotypic data are available for feline leukaemias and lymphoma. Few papers referring to preanalytical factors affecting sample quality and immunophenotyping in haematopoietic diseases have been published to date.2–6
Reference data pertaining to cell populations present in normal feline lymph node (LN) cytological samples are well established.7–9 In contrast, data describing the immunophenotypical subpopulations of normal or mildly reactive peripheral feline LNs are lacking.
Previous studies have investigated restricted flow cytometric (FCM) antibody panel data for feline whole blood/peripheral blood mononuclear cell samples.10–13 They demonstrated data for clones of monoclonal antibodies (mAbs) against CD4, CD5, CD8, CD21 and CD56 (Table 1). No reference data for feline LNs using these antibodies currently exist. For anti-CD18 (panleukocyte marker), anti-CD14 (myelomonocytic marker), anti-CD79alphacy (CD79αcy; B-cell marker) or the alternative T-cell marker anti-CD3, clone CD3–12, no reference data for feline peripheral blood or LN material are available. The aim of the present study was to characterise lymphocyte subpopulations in normal and mildly reactive feline peripheral LNs in order to provide reference data to aid differentiation of a normal/hyperplastic status from lymphoid neoplasia.

Novel reference data for specific mAbs against feline CD4, CD8, CD5 and the putative cross-reactive mAbs against CD14, CD18, CD21, CD79αcy and CD3 are presented.
Materials and methods
LN collection and processing
In this prospective study, popliteal LNs and/or mandibular LNs were harvested from adult cats (>1 year of age), euthanased at the Clinic for Small Animals at the University of Veterinary Medicine, Vienna, Austria, between 2016 and 2020. The cats were euthanased for various reasons excluding haematopoietic malignancies and systemic inflammatory disease. The cadavers of the patients were ceded to the university by written owner consent. All cats were euthanased by an intravenous overdose of barbiturate. Within 5 h of death at least one palpable (either mandibular or popliteal) LN and a maximum of both popliteal and mandibular LNs were excised using a sterile blade. Inclusion criteria for further processing were absence of palpable LN enlargement and unremarkable gross morphology during preparation.
Immediately after excision the material was transferred into a 15 ml vial (Greiner Bio-One) containing 10 ml of cell culture medium (RPMI; PAA) supplemented with 10% inactivated fetal calf serum (PAA) and 100 U/ml penicillin/0.1 mg/ml streptomycin (PAA). The LNs were stored at 4°C for a maximum of 12 h until further processing depending on the time of the day/night. All LNs from an individual cat were then trimmed clean of surrounding fat and connective tissue and were cut in half. Tissue imprints were prepared for cytological evaluation to rule out neoplasia or inflammatory disease before immunophenotyping. One half of at least one representative LN was transferred into 4% buffered formaldehyde solution and prepared for histopathology and immunohistochemistry (IHC). From the remaining LN material, a single-cell suspension was prepared by mincing the LNs through a sieve (mesh size 40 µm). The single-cell suspension was transferred to phosphate buffered saline (1 × PBS) without Ca2+ and Mg2+ (PAA), and was centrifuged at 1300 U/min (353 g) for 6 mins (Heraeus Multifuge 1s-R; Kendro). The cell pellet was resuspended in 1 ml of PBS and was used for FCM immunophenotyping and PCR-based lymphocyte clonality testing.
Total nucleated cell count
The total nucleated cell count (TNCC) was determined by an ADVIA 2120 (Siemens) haematology analyser with the veterinary software setting for cats.
Cytology: differential cell count
Cytocentrifuge preparations with approximately 5 × 10⁵ cells from the single-cell suspension and LN imprints were stained by a Romanowsky dip stain (LT-Sys Haema-Schnellfaerbung; Labor+ Technik). Both cytological samples were microscopically inspected by the principal investigator (BCR) and a board-certified clinical pathologist (IS). Cellularity, overall preservation of cells, morphology and the presence of infectious agents were evaluated. Additionally, a 200-cell differential count was performed. The cells were differentiated into small lymphocytes, medium-sized lymphoid round cells, large lymphoid round cells, macrophages, plasma cells, eosinophils, neutrophils and mast cells. Criteria for cell differentiation included cell size, amount, colour, granulation and vacuolisation of cytoplasm, and topography, size, shape and chromatin pattern of the nucleus, as described previously.7,8
FCM immunophenotyping
For immunophenotyping, aliquots of the single-cell suspensions were labelled with anti-feline, anti-human or anti-canine cross-reactive mAbs listed in Tables 2 and 3. The viability dye eBioscience Fixable Viability Dye eFluor 780 (Thermo Fischer Scientific, Life Technologies) was used for live/dead discrimination from case 9 onwards when this stain was included into the panel. Cells-only and corresponding isotype controls to all corresponding antibodies were used as controls. Most of these mAbs were directly conjugated to fluorochromes. For each analysis 5 × 10⁵ to 1 × 10⁶ cells were incubated with the mAbs or the corresponding isotype controls for 20 mins on ice. After a washing step (PBS without Ca2+ and Mg2+), cells labelled with unconjugated mAbs or unconjugated isotype controls were incubated with anti-mouse secondary antibodies (Tables 2 and 3) and incubated for an additional 20 mins on ice. After a final washing step all labelled cells were immediately analysed in a FACSCanto II flow cytometer (BD Biosciences). For fixation and permeabilisation prior to labelling intracellular antigens, anti-CD79αcy and anti-CD3, the IntraStain-Kit (Dako) was used according to the manufacturer’s instructions. Combinations of monoclonal antibodies used for multicolour staining and the isotype controls are listed in Table 3.
List of monoclonal antibodies used for flow cytometric phenotyping of normal and mildly reactive feline peripheral lymph node cells, including clone, isotype, fluorescent label, source and target species/cross-reactivity

Fluorescence labelling was achieved by use of a secondary antibody
m = mouse; r = rat; FITC = fluorescein isothiocyanate; APC = allophycocyanin; PE = phycoerythrin
Antibody combinations used for multicolour flow cytometric phenotyping of normal and mildly reactive feline peripheral lymph node cells

Tubes numbered 1, 3 and 5 are the isotype controls followed by the respective specific antibody combinations in tubes 2, 4 and 6. All tubes except tubes 3 and 4 contained exclusively directly conjugated antibodies. The cells-only tube and live/dead staining control tube are not listed in the table. In all tubes shown, eBioscience Fixable Viability Dye eFluor 780 staining was added
m = mouse; r = rat; FITC = fluorescein isothiocyanate; APC = allophycocyanin; PE = phycoerythrin
Gating was performed for all samples using the forward scatter/side scatter (FSC/SSC) dot plot representing the size and the granularity of the cells/events. The target lymphoid population was gated and the dead cells excluded by viability stain. The remaining living cells within the gate were used for the analysis of their antigen expression.
Lymphocyte clonality testing by PCR for antigen receptor rearrangement
For the PCR-based lymphocyte clonality assay, total genomic DNA (gDNA) was extracted from 5 × 10⁶ cells of the feline LNs with 200 µl of elution buffer using a commercial kit following the manufacturer’s instructions (EZNA Tissue DNA Kit; Omega Biotech). gDNA concentration and quality were determined using the NanoDrop 2000c spectrophotometer (Thermo Fisher Scientific) in pedestal mode. The threshold was set to 30 ng/µl with desired 260/280 ratios of 1.8–2.0 and 260/230 ratios ⩾2 (2.0–2.2). 19 The gDNA samples were assayed by amplifying a 189 base pair (bp) fragment of the feline androgen receptor gene, the immunoglobulin heavy chain (IGH–VDJ) gene rearrangements with the primer sets V1F2, V3F3 and V3F4, and the T-cell receptor gamma chain (TRG-VJ) gene rearrangements with the primer sets TCRG-J1 and TCRG-J2.19–21 Each PCR reaction was carried out in triplicate, including positive and negative PCR controls in each PCR run.19,22
After PCR, 10 µl of DNA Dilution Buffer (Qiagen) was added to each PCR reaction and size separated using the QIAxcel Advanced System capillary electrophoresis analyser with the QIAxcel DNA High Resolution Kit and the QX Alignment Marker 15 bp/1000 bp (Qiagen). The presence and size of the products obtained with PCR were accurately determined using QIAxcel ScreenGel software (Qiagen). Identical PCR triplicates verified the reproducibility of the clonality patterns, which were interpreted as described previously.19,22,23
Histopathology and IHC
The formalin-fixed samples of the peripheral LN material were embedded in paraffin (FFPE samples), cut into 2 µm sections, stained with haematoxylin and eosin and all examined microscopically by one veterinary anatomical pathologist (AF-B).
IHC was performed with a LabVision-Autostainer (Thermo Fisher Scientific) using the Bright Vision horseradish peroxidase (HRP)-polymer method. FFPE samples were cut into 2 µm sections, deparaffinised, rehydrated and pretreated with heat in pH 6 citrate for 20 mins, incubated in a hydrogen peroxidase block (Thermo Fisher Scientific) for 5 mins and in an Ultra Vision Protein Block (Thermo Fisher Scientific) for another 10 mins. A polyclonal rabbit anti-human antibody against CD3 (Dako; diluted 1:1000) and a polyclonal rabbit anti-human antibody against CD20 (Spring Biosiences; diluted 1:1000) was used. The samples were incubated with the primary antibodies for 30 mins, and subsequently with the secondary antibodies (Bright Vision poly-HRP anti-rabbit IgG; Immunologic) for 30 mins. For visualisation, DAB Quanto (Thermo Fisher Scientific) was used for 5 mins and counterstained with Mayer’s haematoxylin. A feline peripheral LN was used as a positive control.
All samples were evaluated by the same experienced veterinary anatomical pathologist (AF-B).
Statistics
Data were analysed using Microsoft Excel and Microsoft Analyse-it. Results of TNCCs the cytological evaluation and the FCM phenotyping were analysed by non-parametric methods indicating minimum, maximum, first and third quartiles, interquartile, interval, median and the 95% confidence interval (CI). In addition, parametric data were calculated for the determined lymphoid subpopulation results in order to provide better comparability with previously published data.
Cytology indicated and histopathology confirmed that not all LNs were normal, despite their normal gross appearance in size, colour and texture. Histopathology revealed a mildly reactive pattern in 13 samples. Therefore, inferential statistics were applied to investigate differences in cytological differentials and FCM data between normal and mildly reactive LNs. The Mann–Whitney U-test was used and P values <0.05 were considered significant.
Results
In total, mandibular and popliteal LNs from 31 cats were collected. Seven animals had to be excluded from the study owing to monoclonal patterns in clonality testing (n = 4), histopathology suspect for neoplasia (n = 2) and accidental deterioration of material (n = 1).
LN material from 24 cats met the inclusion criteria, showing macroscopically normal LN size, texture and colour, a normal to mildly reactive cell composition in cytology (Figure 1), evaluable FCM results, polyclonality and normal to mildly reactive patterns in histopathology and IHC.

Cytological pattern and mean leukocyte differential counts in normal feline lymph nodes (LNs). (a) Photo of two representative feline peripheral LNs excised post mortem for analysis. (b) Cytological imprint preparations of a representative feline peripheral LN showing a dominant population of small lymphocytes, a moderate number of medium-sized lymphoid round cells, and rare macrophages and plasma cells, single eosinophils and mast cells. Hämaquick × 40 and × 100 objectives. (c) Mean relative differential cell count in normal and mildly reactive peripheral feline LNs (n = 24). The x-axis represents the different populations counted. The y-axis represents the percent counted. The boxes represent the confidence interval (CI) of the mean, the horizontal line within the boxes represents the mean and the whiskers show the minimum and the maximum. Outliers >1.5 and <3 of the interquartile range (IQR) are marked with a red +; outliers >3 IQRs are marked with a red X. Blue lines indicate the SD (95% of distribution).
Mandibular LNs, popliteal LNs and both mandibular and popliteal LNs were investigated from seven, two and 10 individuals, respectively. In five cases information on anatomical site was not available.
Samples originated from 18 (75%) domestic shorthair cats, two (8.3%) Maine Coons, two (8.3%) Persians, one (4.2%) British Shorthair and one (4.2%) domestic longhair cat. Ages ranged between 1 and 20 years. There were two (8.3%) intact males, nine (37.5%) castrated males, two (8.3%) intact females and nine (37.5%) spayed females (Table 4). The age of two cats was unknown.
Breed, sex and age distribution, and cause for euthanasia of the 24 cats involved in the study of lymphocyte populations in normal to mildly reactive popliteal/mandibular lymph node by cytology, flow cytometry, PCR analysis of antigen-receptor rearrangement, histopathology and immunohistochemistry
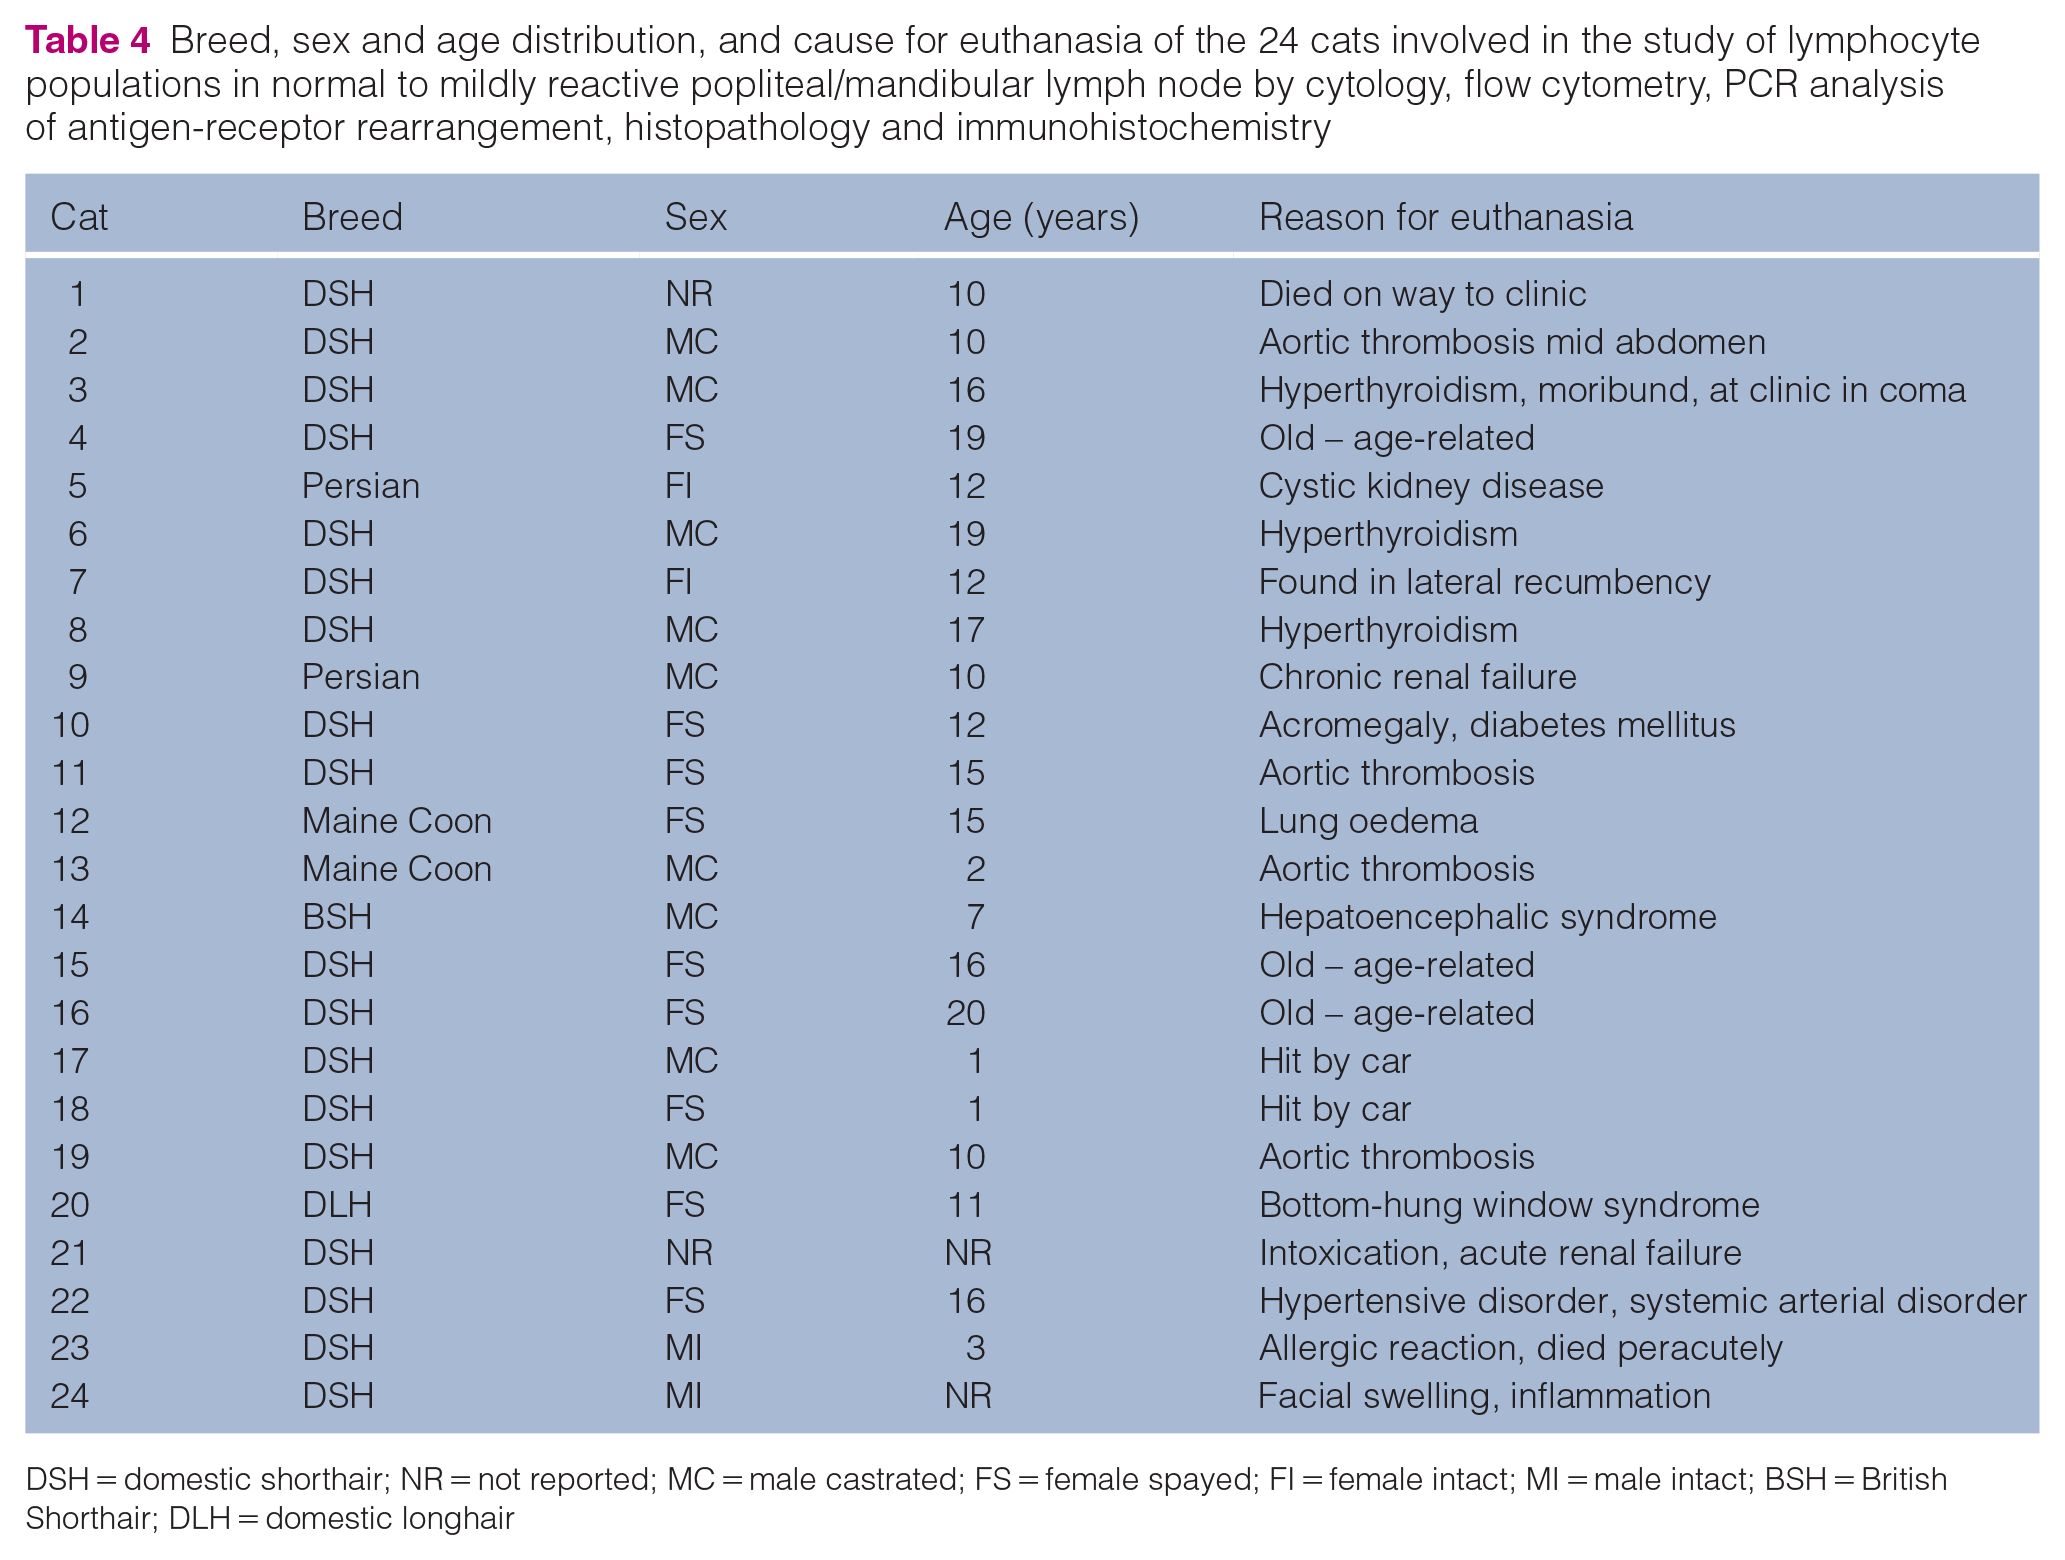
DSH = domestic shorthair; NR = not reported; MC = male castrated; FS = female spayed; FI = female intact; MI = male intact; BSH = British Shorthair; DLH = domestic longhair
TNCC
From sampled popliteal and/or mandibular LNs a total of between 0.5 × 10⁷ and 63 × 107 cells (mean 16.55 × 10⁷) were harvested. The median concentration of TNCC was 22.22 × 10³/µl.
Differences between normal and mildly reactive LNs and anatomical sites
Macroscopically, all LNs were normal in terms of size, texture and colour. Cytology demonstrated some LNs as having a reactive pattern showing plasma cells >6% (n = 4) and medium-sized lymphocytes >15% (n = 1; data not shown). Histopathology classified 11 LN samples as normal and 13 as mildly reactive. Cytology revealed a statistically significant difference between normal and reactive LNs in relation to the number of small lymphocytes (P = 0.0025), plasma cells and neutrophils (both P = 0.0048). In normal LNs, more small lymphocytes and fewer plasma cells and neutrophils were present (Table 5, Figure 2).
Inferential statistics to investigate differences in a cytological 200-cell differential between normal and mildly reactive lymph nodes classified by histopathology
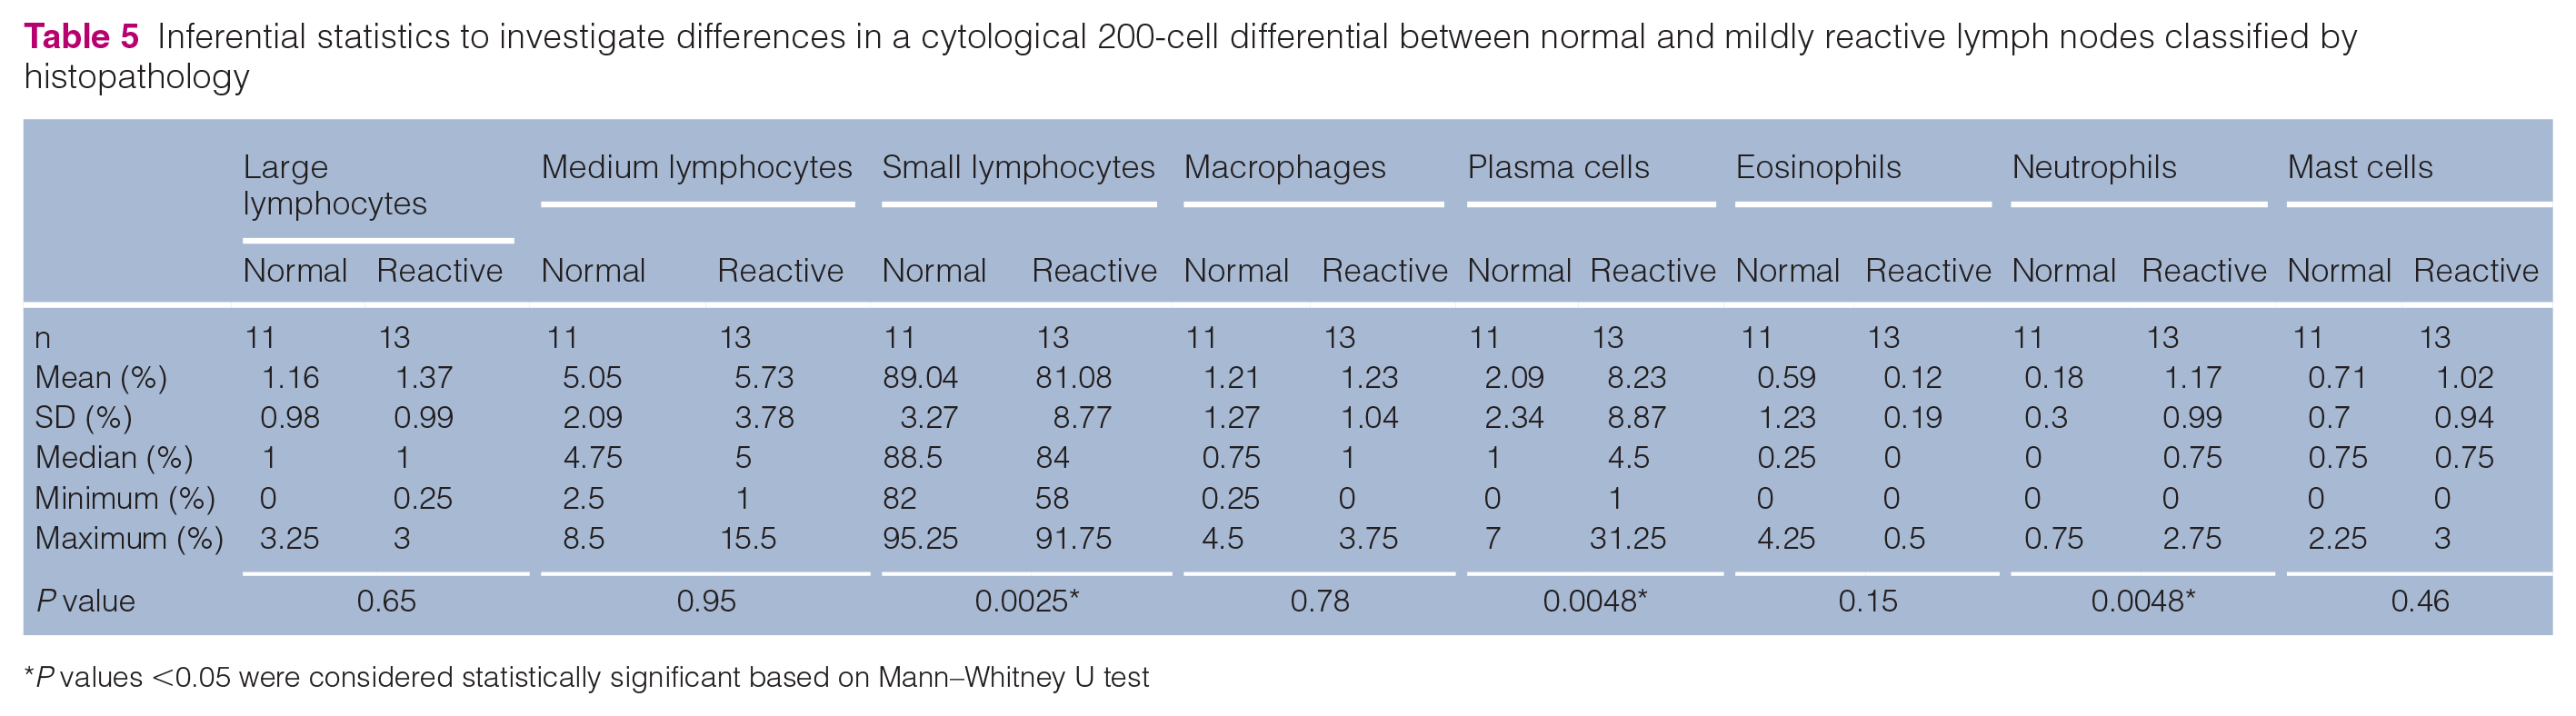
P values <0.05 were considered statistically significant based on Mann–Whitney U test

Inferential statistics showing statistically significant differences in cytological differentials between normal and mildly reactive lymph nodes classified by histopathology for the (a) small lymphocyte (SL), (b) plasma cell (PL) and (c) neutrophil (N) populations depicted as box plots. The open circles represent the data points (%). The boxes represent the confidence interval (CI) of the mean, the horizontal line within the box represents the mean, and the whiskers show the minimum and the maximum. Outliers >1.5 and <3 of the interquartile range (IQR) are marked with a red +. Blue lines indicate the SD (95% of distribution). P values <0.05 were considered statistically significant based on Mann–Whitney U test
Peripheral LNs from different anatomical sites were investigated. Five of seven mandibular LNs and 4/10 mixtures of mandibular and popliteal LNs were mildly reactive. Regarding the two popliteal LNs, one was normal and one mildly reactive. The peripheral LNs with unknown sites showed mild reactivity in 3/5 samples (Table 6).
Allocation of the different feline peripheral sample sites for normal vs mildly reactive lymph nodes (LNs) classified by histopathology

Cytology
Cytological evaluation of cytocentrifuge preparations and impression smears revealed a mixed lymphoid cell population with a predominance of small lymphocytes, a moderate number of medium-sized lymphoid round cells, and rare large-sized lymphoid cells, macrophages, plasma cells, eosinophils, neutrophils and mast cells in all samples (Figure 1b). Neither tumour cells nor infectious organisms were identified by cytological examination.
The 200-cell differential count, where the results of the two evaluators were averaged for the 11 histopathological normal and 13 mildly reactive LNs, are summarised in Table 5. The 200-cell differential count, where the results of the two evaluators were averaged for all 24 cases, are summarised in Table S1 in the supplementary material (see also Figure 1).
FCM immunophenotyping
Regarding FCM expression, no significant difference was observed between normal and mildly reactive LNs for any investigated antibody (Table 7) so data from all 24 animals could be included. Owing to partial restriction in the antibody availability for certain clones, the full panel could not be used consistently on all specimens. A representative example of antigen expression in a normal to mildly reactive feline peripheral LN is shown in Figure 3a, and data from all analysed LNs are summarised in Figure 3b,c. A mean of 65.53% ± 15.74% of lymphoid cells within the gated lymphocyte population (P1) remained for evaluation after live/dead discrimination.

Flow cytometric phenotypes determined in normal to mildly reactive peripheral lymph nodes (LNs) of 24 cats. (a) Top row: representative dot plot for forward (FSC) and side scatter (SSC) for the evaluation of cell size and granularity, respectively. The cells inside the lymphocyte gate are blue dots. Second and third rows: representative dot plots showing cells labelling positive (dependent on corresponding isotype controls) with antibodies to CD18, CD14, CD3, CD79αcy, CD21, CD5, CD8 and CD4. (b,c) Means of determined lymphocyte subpopulations in normal to mildly reactive feline peripheral LNs after labelling with antibodies to (b) CD18, CD14, CD3, CD79αcy, CD21 and CD5, and (c) CD4 and CD8 populations, as well as the CD4:CD8 and the CD4:CD21 ratios, depicted as boxplots. The open circles represent the data points (%). The boxes represent the confidence interval (CI) of the mean, the horizontal line within the box represents the mean, and the whiskers show the minimum and the maximum. Outliers >1.5 and <3 of the interquartile range (IQR) are marked with a red +; outliers >3 of the IQR are marked with a red X. Blue lines indicate the SD (95% of distribution)
The viability of the lymphocytes, available in 17/24 cases, was 70.52% ± 18.03%.
From these cells, 54.81% ± 11.10% were positive for the common intracellular human cross-reactive T-lymphocyte marker CD3 (Figure 3a,b). The additional feline T-cell marker CD5 was expressed in 57.39% ± 12.66% of the lymphoid cells (Figure 3a,b).
The lymphocyte population included, on average, 30.88% ± 13.48% CD4+CD8– T-helper cells, 12.91% ± 6.68% CD4–CD8+ cytotoxic T cells and a small population (0.65% ± 0.56%) of CD4+CD8+ double-positive T lymphocytes (Figure 3c; see also Table S2 in the supplementary material). A summary of data for means, SD, minimum and maximum, and median of all evaluated subpopulations labelled for extracellular and intracellular markers is summarised in Tables S2 and S3 in the supplementary material.
On average, 40.42% ± 12.40% of the gated cells were classified as mature B lymphocytes based on labelling with CD21 (Figure 3a,b; see also Table S3 in the supplementary material). The intracellular B-cell marker CD79αcy was positive in 30.41% ± 13.49% of cells (Figure 3a,b; see also Table S3 in the supplementary material).
The macrophage marker, CD14, was present in 0.75% ± 1.35% of the cells (Figure 3a,b; see also Table S3 in the supplementary material). In total, 86.30% ± 13.86% of all gated cells were positive for the common leukocyte marker, CD18 (Figure 3a,b; see also Table S3 in the supplementary material).
The CD4:CD8 and CD4:CD21 ratios were calculated as 3.45% ± 2.88% and 0.92% ± 0.68%, respectively (Figure 3c and Table S2 in the supplementary material).
Lymphocyte clonality testing
Of the 31 animals investigated, four were excluded from the study population due to monoclonal patterns in clonality testing (data not shown). The PCR-based lymphocyte clonality assay yielded non-clonal patterns for complete IGH–VDJ and TRG–VJ gene rearrangements in all 24 samples included, as exhibited by polyclonal results, suggesting the absence of clonal neoplastic lymphocyte populations (Figure 4). In all samples, the suitability of gDNA for the PCR assay was indicated by the successful amplification of a 189 bp fragment of the feline androgen receptor gene.

Representative clonality patterns (electropherograms) from the clonality assay of one representative feline peripheral lymph node sample. The left column shows the traces of three primer sets for IGH–VDJ (V1F2, V3F3, V3F4) and the right column illustrates the traces of the two TRG–VJ primer sets (TCRG–J1, TCRG–J2). The lower part of the second column shows the PCR positive control result for feline androgen receptor (fAR) gene as a distinct control peak. All primer sets for IGH–VDJ and TRG–VJ show a polyclonal bell-shaped curve result indicated by a red arrow. The peaks at 15 and 1000 base pairs (bp) show the alignment marker, whereas the peaks of 20–25 bp indicate the leftover primers in the PCR reactions
Histopathology and IHC
Of the primarily investigated 31 animals, two were excluded from the study population due to histopathology suspicious for lymphoid neoplasia (data not shown). Histopathological evaluation revealed normal LN architecture in all included cases. Eleven of the 24 cases demonstrated no reactive pattern and 13 showed a mildly reactive pattern (ie, mild follicular hyperplasia, mild plasma cell hyperplasia, follicular hyalinosis or a waning follicular reaction with a less densely populated germinal centre or medullary sclerosis). 24 All samples showed an orderly distribution of CD3+ and CD20+ cells (Figure 5).

Histopathological sample of a representative feline peripheral lymph node. (a) Integrity of the nodal architecture (haematoxylin and eosin [HE], bar = 160 µm). (b,c) Immunohistochemistry shows an orderly distribution of CD3+ and CD20+ lymphoid cells. (b) Immunolabelling with anti-CD3, DAB chromogen and haematoxylin counterstain (bar = 160 µm). (c) Immunolabelling with anti-CD20, DAB chromogen and haematoxylin counterstain (bar = 160 µm)
Discussion
The aim of the present study was to characterise lymphocyte subpopulations in normal and mildly reactive feline peripheral LNs from adult cats to provide reference data that can be used to differentiate a normal/mildly hyperplastic LN from lymphoma. Novel reference data for specific mAbs against feline CD4, CD8 and CD5, and the putative cross-reactive mAbs against CD14, CD18, CD21, CD79αcy and CD3 are presented. Clones, previously used for whole blood reference data (anti-CD4, CD5, CD8 and CD21), were used for LN material for the first time. mAbs against CD18, CD3, CD14 and CD79αcy were used the first time to establish reference data in any form of feline material.
Our data raised questions worth discussing in more detail. CD5 is commonly used as a pan-T-cell marker. It recognises a 67 kD glycoprotein expressed on the surface of feline T cells. Peripheral blood reference data with 65.5% ± 14.4% of positive cells compare with 57.39% ± 12.66% in normal/mildly reactive lymphoid tissue in the present study. 11 The same applies for CD4 and CD8 whole blood data. CD4 positivity has been reported in blood samples from adult and senior feline individuals (29.9% and 24.8%, respectively). 12 In our study, the CD4 helper T lymphocytes were represented as 30.88% ± 13.48% of the population. CD8 positivity has been reported in blood samples from adult and senior cats (19% and 20.0%, respectively). 12 In our study, CD8 cytotoxic T lymphocytes constituted 12.91% ± 6.68%. In addition, we identified a small population of CD4+CD8+ double-positive lymphocytes usually found in the thymus. 25 Earlier reports of extrathymic lymphocyte populations in other species, such as rats, macaques, chickens, pigs and people, suggested that they represent a transitionary population during T-cell activation and proliferation. 26 In dogs, these double-positive T cells show features of activated T cells and subsets distinctly differ in their activation status and phenotype. 27
In 2020, Rout et al described a proportion of CD4–CD8– cells of 22.6% in the peripheral blood of cats when investigating feline lymphocytosis. 13 This double-negative cell type represented 57.90% ± 11.95% in normal feline LNs in the present cohort. Comparability between data from the present study and that of Rout et al13 is limited because different marker combinations prohibit an identical gating strategy allowing the separation of CD4–CD8– B cells and other subpopulations. Further characterisation of this population is required.
The CD4:CD8 ratio of 3.45% ± 2.88% was slightly higher than in peripheral blood, in agreement with previously published reports.10–12 A mildly reactive status or an inherent difference between the materials investigated might be a reason for this. The CD4:CD21 ratio was within <1.8, as described by Rout et al in peripheral blood. 13
B cells are the second largest subset in feline LNs, constituting between 30.41% ± 13.49% and 40.42% ± 12.40% of immunophenotyped CD79αcy or CD21+ cells, respectively, in this study. While CD79αcy, the signal transduction portion of the B-cell receptor spanning the transmembrane and intracytoplasmic regions of the cell, is expressed in all immature and mature B lymphocytes, CD21 appears at the time of bone marrow release. CD79αcy is expressed in preparation for antigen receptor gene rearrangement of heavy and light chains, which is followed by cytoplasmic IgM export to the surface. 28 CD79αcy is also expressed in mature B cells and the majority of B-cell neoplasms, including precursor B cells and plasma cell tumours. 29 As soon as immature B cells exit the bone marrow, CD21 appears on their surface.30,31 In our study, the cross-reactive mAb against canine CD21 was used to detect mature feline B lymphocytes. Immunoprecipitation studies with feline lymphocytes using this mAb show a 145 kDa protein, similar to the protein precipitated from canine lymphocytes. 17 The second marker for feline B lymphocytes, the CD79αcy recognised by an anti-human mAb directed against a highly conserved cytoplasmic region of the antigen, was clustered at the Fifth International Workshop on Human Leukocyte Differentiation Antigens (HLDA), 18 and has been reported to cross-react with B lymphocytes from several mammalian species, including cattle, guinea pigs, horses, monkeys, mice, rats and pigs. 32 So far, no reference values for CD21+ or CD79αcy+ lymphocytes in normal feline LNs have been published. In the present study, the proportion of CD79αcy+ lymphocytes was always somewhat lower than the proportion of CD21+ lymphocytes. The reason for this discrepancy remains unclear. In recent years, many groups performing diagnostic FCM in the veterinary field observed non-specific binding of neoplastic T cells to CD79αcy (W Vernau, 2021, personal communication). In dogs and in cats, non-specific binding of neoplastic T cells has been observed. Thus, CD79αcy has to be considered a less reliable marker for labelling B cells than CD21, and further investigations are needed.
For CD18, CD3, CD14 and CD79αcy the data presented here are the first reference data published on any feline sample material.
Around 85% of the cells in the single-cell suspension of normal to mildly reactive feline peripheral LNs were positive for CD18. This mAb recognises the canine CD18, also known as beta 2 integrin. The tissue and cellular distribution of CD18 in canine tissue closely follows that observed in humans. 33 CD18 is expressed by virtually all leukocytes but more strongly on monocytes and granulocytes than on lymphocytes. The cross-reactivity pattern indicates that the mAb recognises an epitope common to a number of mammalian species. Immunoprecipitation experiments with feline leukocytes showed that this mAb could precipitate a 95 kDa protein (CD18) together with non-covalently associated 180 kDa, 165 kDa and 150 kDa chains, which might represent CD11a, CD11b and CD11c, respectively. 33 Owing to the nearly 100% positivity and the indicated cross-reactivity, CD18 can be used as the pan-leukocyte marker in cats. 16 This is a useful finding because a CD45 pan-leukocyte marker used in many species is not available in the cat.
In addition to the routinely used and aforementioned feline-specific extracellular CD5 antigen, an anti-human cross-reactive antibody against the highly conserved cytoplasmic region, CD3, was used for labelling of normal to mildly reactive feline peripheral LN cells. This antibody has shown broad cross-reactivity with lymphocytes of many mammalian species. 34 The very close agreement of proportions found in the current study for intracellular CD3+ and extracellular CD5+ lymphocyte populations suggests that the anti-CD3 cross-reactive antibody is a useful marker for phenotyping of feline T lymphocyte population.
CD14+ cells have not yet been described in feline LN material. The clone TÜK4 antibody was used because its reactivity with the CD14 cell surface antigen 35 – highly expressed on most feline peripheral blood monocytes 36 – was confirmed at the HLDA8 Workshop. 15 The proportion of CD14+ feline leukocytes was low, as expected for normal to mildly reactive lymphoid material, ranging from 0% to 6.1%.
The cytological distribution of the different cell populations within the 11 normal LNs in this study was comparable to previous reports, determining 75–85% and 85–90% small lymphocytes, <10% medium-sized and <5–15% large lymphocytes, <3% plasma cells and <1% neutrophils, eosinophils, mast cells and macrophages for a normal LN.7–9
The average 5.4% plasma cells, as well as 5.41% medium and 1.27% large lymphocytes reported in the current study, is below the threshold defined for a reactive hyperplastic LN (5–10% plasma cells; >15% medium and/or large lymphocytes).7,8
The primary intention was to collect ‘normal’ LNs, to establish reference data describing the composition of lymphocyte subpopulations in FCM. The LNs selected for our study were macroscopically normal in size, texture and colour. Cytology indicated slight reactivity in some samples and histopathology results confirmed this observation. LNs are designed for function; thus, a reactive state does not mean disease, which appears to be confirmed by the absence of significant differences in immunophenotyping data between microscopically normal and mildly reactive LNs, allowing us to include the reactive LNs in the data set.
Histopathology classified 11 samples as normal and 13 as mildly reactive. By cytology, statistically significant differences between normal and reactive LNs were detected for small lymphocytes (P = 0.0025), plasma cells and neutrophils (both P = 0.0048). In normal LNs the predominance of small lymphocytes was more pronounced and the percentage of plasma cells and neutrophils was lower than in mildly reactive LNs (Table 5, Figure 2). Regarding FCM expression, no significant differences between normal and mildly reactive LNs were detectable for any of the investigated antibodies (Table 7). This confirms the validity of the reference data established for both normal and mildly reactive feline peripheral LNs in this study.
Inferential statistics to investigate differences in flow cytometry data between normal and mildly reactive lymph nodes classified by histopathology

P values <0.05 were considered statistically significant based on Mann–Whitney U test
Only cytology detected statistically significant differences between normal and reactive LNs. The explanation for this fact is that FSC/SSC gating includes only the lymphocytes; thus, neutrophils, which are have a higher SSC, are excluded. Furthermore, no antibody directed against feline neutrophils was used in the panel and so detection was not possible. The same applies to the plasma cell fraction as, to our knowledge, there is no antibody available for specific labelling of feline plasma cells. Only a small shift in size could be detected in cytological differentiation, indicating a shift towards larger lymphocytes in mildly reactive LNs. However, in the antigen composition regarding B- and T-cell distribution and T-cell subpopulations, no statistically significant difference could be found for any marker. Because a cohort of 24 individuals is quite small, further studies are necessary to detect such an effect.
In the current study, peripheral LNs from different anatomical sites were investigated. Mandibular LNs, popliteal LNs and both mandibular and popliteal LNs were investigated from seven, two and 10 individuals, respectively. In five cases information regarding anatomical sites was not available. Regarding the difference between the 11 normal and 13 mildly reactive LNs, a trend was observed dependent on the anatomical site. Five of seven mandibular LNs and 4/10 mandibular and popliteal LNs were mildly reactive. Regarding the two popliteal LNs, one was normal and one mildly reactive. Three of the five LNs with an unknown anatomical site showed mild reactivity. From these data it can be concluded that for grossly normal feline LNs, mandibular LNs are more frequently mildly reactive than popliteal LNs. This finding supports the recommendation by cytology textbooks to avoid sampling of the mandibular LNs where possible. 7
Interestingly, 6/31 samples derived from macroscopically inconspicuous LNs, confirmed by normal cytological results, had to be excluded due to suspected lymphoid neoplasia in histopathology (n = 2) and monoclonal pattern (n = 4) in clonality testing. Deterioration of another sample so that the immunophotyping cytograms could not be interpreted reduced the number of employable data to 24 cats. These data could have raised the possibility of lymphoid neoplasia or possible false-positive results via clonality testing and/or histopathology and IHC. 37 Therefore, these results warranted exclusion of these samples/animals for this study.
Conclusions
This is the first report of immunophenotyping data of lymphocyte subsets in macroscopically normal and mildly reactive peripheral feline LNs. Previously, CD5, CD4, CD8 and CD21 reference data had been described for peripheral blood only. This is the first description of CD18, CD3, CD14 and CD79αcy use for the determination of feline reference data of any sample origin.
Supplemental Material
Table S1
Absolute leukocyte differential cell counts of normal and mildly reactive feline lymph nodes
Supplemental Material
Table S2
Lymphocyte populations (CD4–CD8–, CD4–CD8+,CD4+CD8+, CD4+CD8– and the CD4:CD8 and the CD4:CD21 ratios) based on flow cytometric phenotyping of normal feline lymph node cells
Supplemental Material
Table S3
Lymphocyte populations (P1, alive cells in %, CD18, CD14, CD3, CD5, CD21 and CD79αcy) based on flow cytometric phenotyping of normal feline lymph node cells
Footnotes
Acknowledgements
The authors thank the members of the Small Animal Clinic of the University of Veterinary Medicine in Vienna for providing the samples.
Author note
The findings of this study were presented, in part (n = 11), at the 2018 American College of Veterinary Clinical Pathology Conference, Washington, DC, USA.
Supplementary material
The following files are available online:
Table S1: Absolute leukocyte differential cell counts of normal and mildly reactive feline lymph nodes.
Table S2: Lymphocyte populations (CD4–CD8–, CD4–CD8+, CD4+CD8+, CD4+CD8– and the CD4:CD8 and the CD4:CD21 ratios) based on flow cytometric phenotyping of normal feline lymph node cells.
Table S3: Lymphocyte populations (P1, alive cells in %, CD18, CD14, CD3, CD5, CD21 and CD79αcy) based on flow cytometric phenotyping of normal feline lymph node cells.
Conflict of interest
The authors declared no potential conflicts of interest with respect to the research, authorship, and/or publication of this article.
Funding
The authors received no financial support for the research, authorship, and/or publication of this article.
Ethical approval
The work described in this manuscript involved the use of non-experimental (owned or unowned) animals. Established internationally recognised high standards (‘best practice’) of veterinary clinical care for the individual patient were always followed and/or this work involved the use of cadavers. Ethical approval from a committee was therefore not specifically required for publication in JFMS. Although not required, where ethical approval was still obtained, it is stated in the manuscript
Informed consent
Informed consent (verbal or written) was obtained from the owner or legal custodian of all animal(s) described in this work (experimental or non-experimental animals, including cadavers) for all procedure(s) undertaken (prospective or retrospective studies). No animals or people are identifiable within this publication, and therefore additional informed consent for publication was not required.
References
Supplementary Material
Please find the following supplemental material available below.
For Open Access articles published under a Creative Commons License, all supplemental material carries the same license as the article it is associated with.
For non-Open Access articles published, all supplemental material carries a non-exclusive license, and permission requests for re-use of supplemental material or any part of supplemental material shall be sent directly to the copyright owner as specified in the copyright notice associated with the article.