
Abstract
Objectives
Symmetric dimethylarginine (SDMA) reflects the glomerular filtration rate (GFR) in people, dogs and cats. Initial assays used a liquid chromatography-mass spectroscopy (LC-MS) technique. A veterinary immunoassay has been developed for use in commercial laboratories and point-of-care (POC) laboratory equipment. This study sought to: determine POC and commercial laboratory (CL) SDMA assay imprecision; determine any bias of the POC assay compared with the CL assay; calculate observed total error of the POC assay and compare with analytical performance goals; and calculate dispersion and sigma metrics (σ) for POC and CL SDMA methods.
Methods
Two separate studies were performed that assessed: (1) imprecision, determined by evaluation of pooled feline plasma or serum; and (2) bias, assessed by comparing pooled plasma and serum results, as well as paired analyses of clinical samples from a single venepuncture measured using both analysers. Results were assessed in relation to performance goals. Dispersion and σ were calculated for both analysers.
Results
Bias between CL and POC analysers was consistent and high numbers of clinical results were outside performance goals across both studies. Imprecision was poor for both analysers for study 1 and improved to within quality goals for the CL analyser for study 2. Dispersion was at least 40%, meaning a measured result of 14 μg/dl represents a range of possible results from 8 μg/dl to 20 μg/dl.
Conclusions and relevance
Clinicians should be careful ascribing medical significance to small changes in SDMA concentration, as these may reflect analytical and biological variability. Analyser-specific reference intervals are likely required.
Keywords
Introduction
Symmetric dimethylarginine (SDMA) is a biomarker reflecting glomerular filtration rate (GFR) in people, 1 dogs 2 and cats. 3 A veterinary assay has been developed; initial studies assessed performance of a liquid chromatography-mass spectroscopy (LC-MS) technique.2,4 Subsequently, a high throughput immunoassay was developed for routine use in commercial laboratories (CLs)5,6 and point-of-care (POC) laboratory equipment. 7 The usefulness of SDMA to assess renal disease in small animals has been questioned. 8 Independent assessment of assay performance has not been published.
The aims of the study were to characterise imprecision of two available veterinary SDMA assays with feline samples and assess bias of the POC SDMA assay relative to the CL assay. All performance parameters (defined below) were assessed using analytical performance goals recently proposed by the authors for SDMA testing, 9 with the specific intention of determining whether the analytical performance of SDMA testing would allow the same interpretation of POC and CL results when applied to feline patients.
Specific study objectives were to:
(1) Determine POC and CL SDMA assay imprecision using pooled feline plasma and serum and to compare the findings with previously published SDMA performance goals. 9
(2) Determine the POC assay’s systematic error (bias) compared with the reference laboratory assay using feline plasma and serum and to compare the findings with previously published SDMA performance goals. 9
(3) Calculate the observed total error (TEOBS) associated with the POC assay and compare this with previously published SDMA total error goals. 9
(4) Determine the dispersion for SDMA results produced on the POC and CL analysers.
(5) Establish the impact of SDMA assay performance on clinical interpretation of feline SDMA data based on assessing (1) the number of POC SDMA results falling outside CL SDMA results ± quality goal; and (2) the dispersion of POC SDMA testing.
(6) Calculate sigma metrics (σ) for POC and CL SDMA methods.
Materials and methods
Data for the assessment of SDMA assay performance were collected as two separate studies, designated study 1 and study 2. The study design, outlining data collection and statistics used, is summarised as flow charts in Figures 1–4.

Flow chart of study 1 procedures and statistics for pooled heparinised plasma samples to investigate symmetric dimethylarginine (SDMA) and creatinine imprecision and related calculations.

Flow chart of study 1 procedures and statistical assessments to compare symmetric dimethylarginine (SDMA) results from a point-of-care (POC) analyser measured using heparinised plasma with SDMA results from a commercial laboratory (CL) analyser measured using serum. Samples were from healthy cats and cats with previously diagnosed kidney disease

Flow chart of study 2 procedures and statistics for pooled heparinised plasma samples and pooled serum samples to investigate symmetric dimethylarginine (SDMA) and creatinine imprecision and related calculations.

Flow chart of study 2 procedures and statistical assessments to compare SDMA results from a point-of-care (POC) analyser and a commercial laboratory (CL) analyser measured using heparinised plasma from healthy cats and cats with previously diagnosed kidney disease
The authors contacted IDEXX with preliminary findings following study 1. Study 2 was partially funded by IDEXX after the company made changes to improve the analytical performance of the CL assay; detail regarding these changes was not available to the authors. Data from both study 1 and study 2 were used separately to calculate the imprecision of each SDMA assay, calculate bias between the SDMA assays, and calculate total error, dispersion and the sigma metric (σ) for each SDMA assay. Both the POC and the CL analysers report SDMA in units of µg/dl.
Study 1 data collection
Study 1 was conducted during May and June of 2018 and included creation of heparinised feline plasma pools from surplus heparinised whole blood samples and prospective collection of individual feline patient serum and heparinised plasma specimens. All samples were collected and used with informed owner consent.
Pooled samples (Figure 1)
Pooled plasma samples from healthy cats and cats known to have kidney disease were obtained from surplus heparinised whole blood samples (BD Vacutainer, lithium heparin; Becton Dickinson) over a 3-day period in a privately owned feline veterinary practice. Health was defined as no systemic or major organ illness recognised on clinical examination and plasma biochemistry assessment. Presence of kidney disease was defined as a plasma creatinine concentration 30% above previously documented baseline concentration together with dilute or partly concentrated urine (urine specific gravity <1.035) that could not be explained by extrarenal factors.
Each tube of heparinised whole blood was centrifuged at 1790 g for 5 mins within 30 mins of collection and the plasma harvested. Specimens with visible lipaemia or haemolysis were excluded. Collected plasma was added to one of two feline plasma pools: (1) for clinically healthy cats (plasma pool normal, PPN) or (2) renal disease cats (plasma pool renal, PPR) and kept at 4°C. After 3 days of collection, each pool was mixed thoroughly by gentle aspiration/expiration with a syringe before being divided into 0.6 ml aliquots in tightly capped plastic vials (StatSpin Urine Tubes; Beckman Coulter), which were stored frozen at –20°C for up to 2 weeks until measured. Feline SDMA has previously been measured from sera frozen for longer than a year 10 and canine SDMA has been shown to be stable after three freeze–thaw cycles; 2 the IDEXX Catalyst DX operator’s guide released in 2017, prior to the study period, recommends against ‘freezing samples that will be used to run electrolytes or NH3’ but does not mention SDMA.
SDMA was measured using one aliquot of each feline plasma pool daily for 12 consecutive working days (PPN) or eight consecutive working days (PPR). Aliquots were thawed at room temperature on the day of measurement and inverted multiple times before being tested on a POC chemistry analyser (IDEXX Catalyst DX; IDEXX Laboratories) and sent with a cold pack by courier to a commercial laboratory (IDEXX Laboratories), where they were tested on the same day using a CL chemistry analyser (AU400; Olympus). The POC 7 and CL5, 6 analysers each use a high throughput immunoassay to determine SDMA. Creatinine concentration of PPN and PPR aliquots was also measured using the POC analyser to affirm stability of the pooled plasma and the analyser.
Prospectively collected clinical samples (Figure 2)
Prospectively collected individual feline patient samples were from all cats seen by the practice and needing biochemical testing during the study period, regardless of health status. Whole blood was collected from each cat by single jugular venepuncture. Blood samples were divided into a lithium heparin tube (Catalyst Lithium Heparin Whole Blood Separator tube filled to 0.7 ml and immediately, gently mixed) and an anticoagulant-free tube (Z Serum Clot activator; Becton Dickinson). Heparinised plasma was immediately measured using the POC analyser by any of three trained veterinary nurses at the practice who routinely use this equipment.
The anticoagulant-free tubes were not processed further and were sent by courier with a cold pack to the commercial laboratory (IDEXX Laboratories). Serum was harvested at the commercial laboratory and SDMA was measured using a single CL analyser. Although common interferents (haemolysis, lipaemia, icterus) have been shown to not affect SDMA testing,2,7 the commercial laboratory’s reporting of presence and degree of lipaemia was recorded (see Table S1 in the supplementary material).
SDMA and creatinine imprecision
Mean, SD and coefficient of variation (CV) were calculated for PPN and PPR for SDMA (both analysers) and creatinine (POC analyser only). CV was calculated as CV(%) = SD/mean × 100. CV values were used to represent imprecision in further calculations involving total error, dispersion and σ.
Method comparison
Bias between SDMA assays was determined as the difference between mean results on each analyser in both measurand units and percentage:


The absolute value for bias was used for additional calculations.
Bias between SDMA assays was calculated from both pooled samples as well as paired clinical samples from individual cats. First, mean SDMA of the POC analyser was compared with mean SDMA of the CL analyser for each feline plasma pool (PPN and PPR, respectively). This determination of bias was used in subsequent calculations of SDMA total error and σ.
Secondly, the mean SDMA of prospectively collected individual clinical feline plasma specimens (measured using the POC analyser) was compared with the mean SDMA of paired feline serum specimens (measured using the CL analyser).
Further analyses using study 1 data were performed as described below under the section ‘Both studies’.
Study 2 data collection
Study 2 was conducted during November and December 2018 and included creation of specimen pools from surplus samples and prospective collection of individual feline patient heparinised plasma specimens. All samples were collected and used with informed owner consent.
Pooled samples (Figure 3)
Separate pools of feline plasma and serum were collected, aliquoted and stored as described for study 1. Two pools (one plasma, one serum) were created; each pool included cats with and without kidney disease. Each pool was tested for both SDMA and creatinine (to affirm stability of the pooled collections) using both the POC and the CL analysers for 19 consecutive working days (serum) and 23 consecutive working days (plasma), yielding four sets of data.
Prospectively collected clinical samples (Figure 4)
Prospectively collected individual feline patient samples were obtained from both clinically healthy cats and cats with kidney disease using the same inclusion criteria as study 1. Whole blood was collected from each cat by single jugular venepuncture and placed in a 2 ml lithium heparin tube (Becton Dickinson), centrifuged and either assessed immediately using the POC analyser as described for study 1 or pipetted to a tightly capped plastic vial (StatSpin Urine Tubes; Beckman Coulter) for transport for assessment at the CL as described for study 1. As with study 1, the presence and degree of lipaemia was recorded (see Table S2 in the supplementary material).
SDMA and creatinine imprecision
Mean, SD and CV of SDMA and creatinine measurements were calculated for each data set as described for study 1. These CV values were used to represent imprecision in further calculations involving total error, dispersion and σ as for study 1.
Method comparison
Bias between SDMA assays was determined in absolute and percentage terms as described for study 1.
As for study 1, bias between assays was calculated from both pooled samples and paired prospectively collected individual clinical samples. First, mean SDMA of the POC analyser was compared with mean SDMA of the CL analyser for each feline plasma pool (PPN and PPR, respectively). This determination of bias was used in subsequent calculations of SDMA total error and σ.
Secondly, POC SDMA of prospectively collected individual feline clinical plasma specimens was compared with mean CL SDMA of paired feline plasma aliquots.
Further analyses using study 2 data were performed as described below.
Both studies
For study 1 and study 2, data analysis included descriptive statistics for each dataset, Pearson’s correlation, Passing–Bablok regression with residuals analysis and Bland–Altman difference plot analysis. All data analysis was performed using Microsoft Excel 365, including a macro for Passing–Bablok analysis developed by Acomed statistik (www.acomed-statistik.de).
Observed total error calculation (Figures 1 and 3)
TEOBS was calculated separately in SDMA units and percentage for each of the four pooled sample data sets from study 1 (PPN, PPR) and study 2 (pooled plasma, pooled serum). The following formulae were used:


In these formulae, the constant 1.96 is a Z-factor representing bidirectional change and 95% statistical probability. CV in the second formula is in units of percent. Only bias derived from the pooled sample data sets was used in these calculations, so that bias and imprecision incorporated into the formulae were determined using the same samples.
Dispersion (Figures 1 and 3)
Dispersion, or the range of possible values into which a measured test result may fall based on combined analytical imprecision and biological variation (BV), 13 is expressed in units of percent and was calculated for each SDMA assay as:

where 1.96 is a Z factor reflecting bidirectional change and 95% statistical probability and CVI (in %) is intra-individual variation derived from a prior feline SDMA BV study. 14 Dispersion was calculated for each CVA (in %) calculated from both study 1 and study 2 data, such that ‘optimised’ and ‘unoptimised’ case scenario dispersion was determined. Once calculated, dispersion can be converted to a range of numbers expressed in analyte units around a measured value.
Clinical interpretation (Figures 2 and 4)
Comparability of SDMA assays based on analytical performance goals
Comparability of POC SDMA results to CL SDMA results was investigated for study 1 and study 2 separately using the paired results for the prospectively collected individual clinical feline samples. Comparability was assessed by determining whether, for each data pair, results from the POC assay fell within a range defined by the corresponding commercial laboratory result ± analytical performance goal. Both ‘desirable total error’ (TED), a BV-based quality goal, and ‘acceptable total error’ (TEA), an expert consensus-based quality goal, were used in this analysis. 9 The number of POC SDMA results falling inside and outside these ranges were counted and shown in absolute and percentage terms.
Sigma metric (Figures 1 and 3)
The σ is a unitless index and an indicator of analytical performance capability and quality. The σ is calculated using an analytical quality goal (eg, TED from BV data 14 or consensus-based TEA) 9 and the imprecision and bias of an analyser. 15 Since quality goals are often expressed in units of percent, CV and absolute %bias are typically used in the calculation. A σ value of 6 (6σ) or greater is considered ‘world-class’ performance and is expected to produce a maximum of 3.4 erroneous results per 1 million tests. Generally, a σ >3 (6210 erroneous results per 1 million tests) is considered the minimum acceptable for most assays. 16 The σ for the POC analyser was calculated as:

As for TEOBS calculations, the σ was calculated using CV (in %) and absolute %bias derived from both study 1 (PPN, PPR) and study 2 (plasma, serum) pooled sample data sets, with each data set assessed separately. The quality goal used in this calculation was TED (in %), calculated from BV data.3,9
Meeting quality goals for SDMA performance
Results of each study were assessed in relation to quality goals determined previously for SDMA performance based on BV data 14 and expert opinion (Table 1). 9
Previously published feline serum symmetric dimethylarginine (SDMA) performance goals 9

Values less than the quality goals reflect acceptable performance. The ‘desirable’ goals are based on BV study results. Results greater than the ‘desirable imprecision’ goal (ID) reflect undesirable variation among results on the same specimen measured on different days. Values greater than the ‘desirable bias’ goal (BD) reflect differences in results obtained by the different instruments, using the CL result as the standard for comparison, and may result in differences in clinical interpretation of the results obtained on different instruments. Values greater than the ‘desirable total error’ goal (TED) represent combined effects of bias and imprecision for each instrument and represent differences that are unacceptable because of the potential effect on error interpretation. Individual results outside the expert opinion goals (expressed in units of the test result) indicate the potential for misclassification of results based on current clinician opinions regarding interpretation of results.
Results
Imprecision assessments
Imprecision results are shown in Table 2. Raw data are presented in Tables S3 (study 1) and S4 (study 2) in the supplementary material.
Descriptive statistics of repeated measures of symmetric dimethylarginine (SDMA) and creatinine in pooled feline plasma or serum analysed by a point-of-care (POC) analyser and clinical laboratory (CL) reference
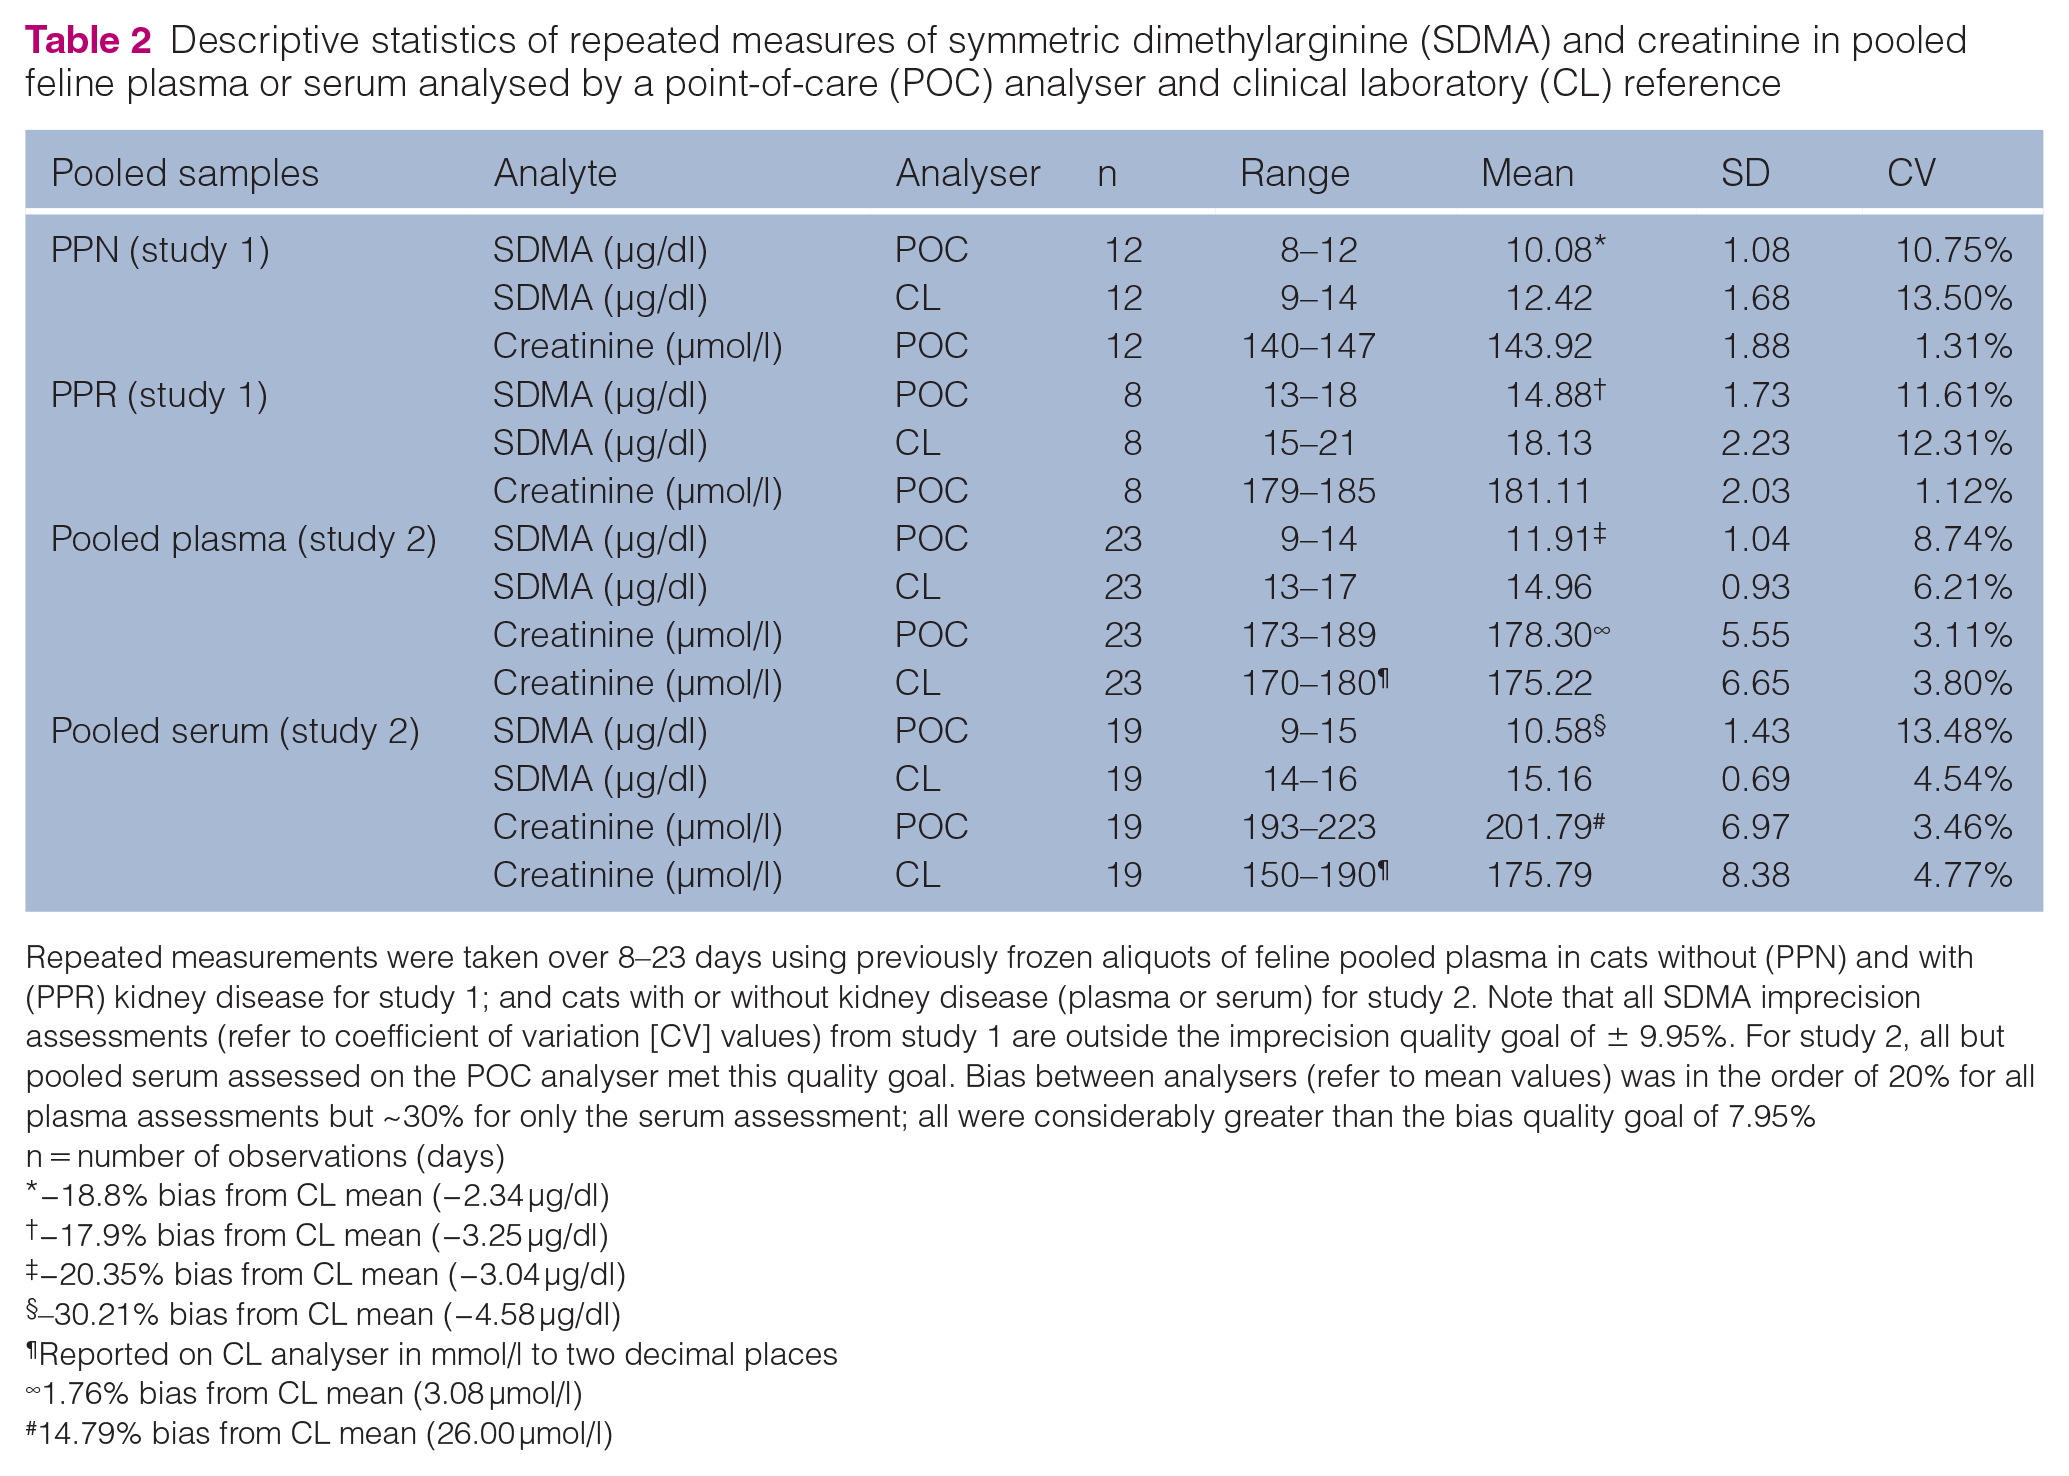
Repeated measurements were taken over 8–23 days using previously frozen aliquots of feline pooled plasma in cats without (PPN) and with (PPR) kidney disease for study 1; and cats with or without kidney disease (plasma or serum) for study 2. Note that all SDMA imprecision assessments (refer to coefficient of variation [CV] values) from study 1 are outside the imprecision quality goal of ± 9.95%. For study 2, all but pooled serum assessed on the POC analyser met this quality goal. Bias between analysers (refer to mean values) was in the order of 20% for all plasma assessments but ~30% for only the serum assessment; all were considerably greater than the bias quality goal of 7.95%
n = number of observations (days)
−18.8% bias from CL mean (−2.34 μg/dl)
−17.9% bias from CL mean (−3.25 μg/dl)
−20.35% bias from CL mean (−3.04 μg/dl)
–30.21% bias from CL mean (−4.58 μg/dl)
Reported on CL analyser in mmol/l to two decimal places
1.76% bias from CL mean (3.08 μmol/l)
14.79% bias from CL mean (26.00 μmol/l)
Study 1
SDMA imprecision from both CL and POC analysers for PPN and PPR ranged from CVA = 10.75% to 13.50%, exceeding the ID quality goal of 9.95%. Imprecision of the POC analyser was less than the CL analyser for PPN and PPR. POC analyser SDMA imprecision was approximately ten-fold greater than creatinine imprecision (CVA = 1.31% for PPN and 1.12% for PPR).
Study 2
Following proprietary adjustments to the CL analyser, SDMA imprecision of both pooled plasma (CV = 6.21%) and pooled serum (CV = 4.54%) were lower than the ID quality goal of 9.95%. POC analyser SDMA imprecision achieved this quality goal with pooled plasma (CV = 8.74%) but not pooled serum (CV = 13.48%).
CL analyser creatinine imprecision was CV = 3.80% (pooled plasma) and CV = 4.77% (pooled serum). POC analyser creatinine imprecision was CV = 3.11% (pooled plasma) and CV = 3.46% (pooled serum).
Bias assessments
Pooled plasma and serum data
All bias assessments for SDMA on both analysers from both sets of analyses (Table 2) were outside the BD quality goal of ± 7.95%.
For all data sets from both studies, mean results for the CL analyser were numerically higher than mean results for the POC analyser.
Study 1
Bias for the POC analyser compared with the CL analyser determined from pooled plasma was −18.8% (mean bias = −3.25 μg/dl) for PPN and −17.9% (−2.34 μg/dl) for PPR, both of which are greater than two times the quality goal of ± 7.95%.
Study 2
Bias for the POC analyser compared with the CL analyser determined from pooled plasma was similar to the results of study 1 at −20.4% (mean bias = −3.04 µg/dl). Bias for pooled serum was larger at −30.2% (mean bias = −4.58 µg/dl), exceeding the quality goal of ± 7.95% by approximately four-fold.
Individual patient method comparison data
Bias results from the two prospective, individual patient method comparison data are summarised in Tables 3 (study 1) and 4 (study 2). Raw data are presented in Tables S1 (study 1) and S2 (study 2) in the supplementary material, and the results are shown as a scatter plot in Figures 5 and 6.
Descriptive and bias statistics of feline serum and plasma symmetric dimethylarginine (SDMA) concentrations analysed by a commercial laboratory (CL) analyser and point-of-care (POC) analyser prior to optimisation of the CL method (study 1)

−0.5% bias from CL mean (−0.07 μg/dl)LOA = limit of agreement; CI = confidence interval
Descriptive and bias statistics of feline plasma symmetric dimethylarginine (SDMA) concentrations analysed by a commercial laboratory (CL) analyser and point-of-care (POC) analyser after optimisation of the CL method (study 2)

−11.53% bias from CL mean (−1.60 μg/dl)LOA = limit of agreement; CI = confidence interval

Scatter plot with line of best fit of results from feline serum and plasma symmetric dimethylarginine (SDMA) concentrations analysed by a commercial laboratory (CL) analyser and point-of-care (POC) analyser prior to optimisation of the CL method (study 1). Note that the individual results are scattered around rather than sitting close to the line of best fit. Note that one very high result (65 μg/dl and 73 μg/dl on each analyser) has been excluded for clarity

Scatter plot with line of best fit of results from feline plasma symmetric dimethylarginine (SDMA) concentrations analysed by a commercial laboratory (CL) analyser and point-of-care (POC) analyser after optimisation of the CL method (study 2). Note that the individual results are scattered around rather than sitting close to the line of best fit
Study 1 (Table 3)
Plasma for POC analyser SDMA and serum for CL analyser SDMA were obtained during the same blood draw from 62 cats. Ages ranged from 0.3 to 19.2 years (mean: 11.3 years, median 12.4 years), 28/62 (45%) were female (all but one spayed), 34/62 (55%) were male (all but three castrated), 34/62 (45%) were domestic shorthairs, 9/62 (15%) were Burmese and the remainder comprised 12 different breeds with no more than three cats of any other breed.
SDMA plasma results from the POC analyser and serum from the CL analyser were positively correlated. Because R 2 was <0.975 (see Table 3), Passing–Bablok regression was chosen (see Figure S1 in the supplementary material). Although the confidence interval for the slope of the Passing–Bablok regression (0.69–1.00) included 1.00 and the confidence interval for the intercept (−0.50 to 3.35) included zero, assessment of residuals (Figure S2 in the supplementary material) showed a large scatter consistent with the wide confidence interval for slope and the high imprecision seen with the pooled plasma assessments. One cat’s SDMA concentration was significantly higher than all other cats; excluding this cat, R 2 was 0.64, but including this outlying value increased R 2 to 0.88. This cat was included for all calculations, but the poorer correlation observed with its omission better reflects the large scatter seen with the residuals.
The Bland–Altman difference plot for study 1 is shown in Figure 7. The first study comparing plasma (POC analyser) with serum (CL analyser) found a minimal mean difference between analysers of –0.06 µg/dl (−0.46%, within the bias quality goal of ± 7.95%); however, the data points were scattered widely about zero, reflecting the standard deviation of differences of 2.99 µg/dl and the 95% limits of agreement (LOA) of ± 5.85 µg/dl (which exceeded both TED and TEA for concentrations <24 µg/dl). Five sets of results (8%) exceeded the LOA.

Bland–Altman difference plot for study 1 constructed by plotting for each cat the mean concentration from both analysers (x axis) against the difference between results from each analyser (y axis). The yellow lines indicate the allowable total error (TEA) as determined by expert opinion (via the survey). The blue sloping lines indicate the desirable total error (TED) as determined by a prior biological variation study. The purple lines indicate the limits of agreement (LOA) to 95% confidence interval. The LOA range is approximately double the two determined measures of clinical importance (TEA and TED) and are therefore too high for clinical acceptability

Bland–Altman difference plot for study 2 assessing the mean concentration of each analyser to the difference. The negative bias of the point-of-care (POC) analyser appears to increase as the concentration of symmetric dimethylarginine (SDMA) increases. The limits of agreement (LOA) are very similar to study 1 and too high for clinical acceptability. TEA = allowable total error; TED = desirable total error
Study 2 (Table 4)
Plasma from the same blood draw was assessed on each analyser from 50 cats, independent from the 62 cats assessed in study 1; however, three cats contributed to both studies. Ages ranged from 1.1 to 20.0 years (mean: 12.1 years, median: 13.5 years), 22/50 (44%) were female (all but one spayed), 28/50 (56%) were male (castrated), 20/50 (40%) were domestic shorthairs, 12/50 (24%) were Burmese and the remainder comprised 14 different breeds with no more than three cats of any other breed.
For the second study, SDMA plasma results from the POC analyser and the CL analyser were positively correlated but less so (R = 0.79) than in study 1 (R = 0.94). Passing–Bablok regression for study 2 is shown in Figure S3 in the supplementary material. The confidence interval for slope of the Passing–Bablok regression (0.57–0.88) did not include 1.00 and, although the confidence interval for the intercept (−0.12 to 3.92) included zero, the assessment of residuals (see Figures S2 and S4 in the supplementary material) showed a large scatter consistent with the wide confidence interval for slope and the high imprecision seen with the pooled plasma assessments on the POC analyser as well as the study 1 assessments.
The Bland–Altman difference plot for study 2 is shown in Figure 8. There was a mean difference between analysers of −1.60 µg/dl (−11.53%), exceeding the bias quality goal of ± 7.95%. As in study 1, the data points were scattered widely about zero, reflecting the same standard deviation of differences of 2.99 µg/dl and the 95% LOA of ± 5.86 µg/dl (which exceeded both TED and TEA for concentrations <24 μg/dl). Five sets of results (10%) exceeded the LOA.
Total error calculations
Study 1
TEOBS in SDMA units and percent for the POC analyser for PPN were 4.46 μmol/l and 44.20%. TEOBS in SDMA units and percent for the POC analyser for PPR were 6.63 μmol/l and 44.60%. These results were each significantly higher than the TED goal of ± 24.37%.
Study 2
TEOBS in SDMA units and percent for the POC analyser for pooled plasma were 5.08 µmol/l and 37.48%, and for pooled serum SDMA were 7.38 µmol/l and 56.63%. These results are higher the TED goal of ± 24.37%.
Dispersion
Dispersion of SDMA results in cats was ± 42.60–47.11% for the POC analyser and ± 40.01–47.11% for the CL analyser (with variations using the best and worst case scenarios from the imprecision results). In short, for the best case scenario, there is a 95% probability that a measured CL analyser result of 14 µg/dl (at the upper SDMA reference limit) represents a range of possible results from 8 μg/dl to 20 μg/dl. Table 5 shows the dispersion range for SDMA concentrations from 6 µg/dl to 21 μg/dl for the best case scenario for both analysers.
Dispersion ranges of feline serum and plasma symmetric dimethylarginine (SDMA) concentrations analysed by a point-of-care (POC) analyser and clinical laboratory (CL) reference method using published biological variation data 14 and this study’s lowest analytical variation data
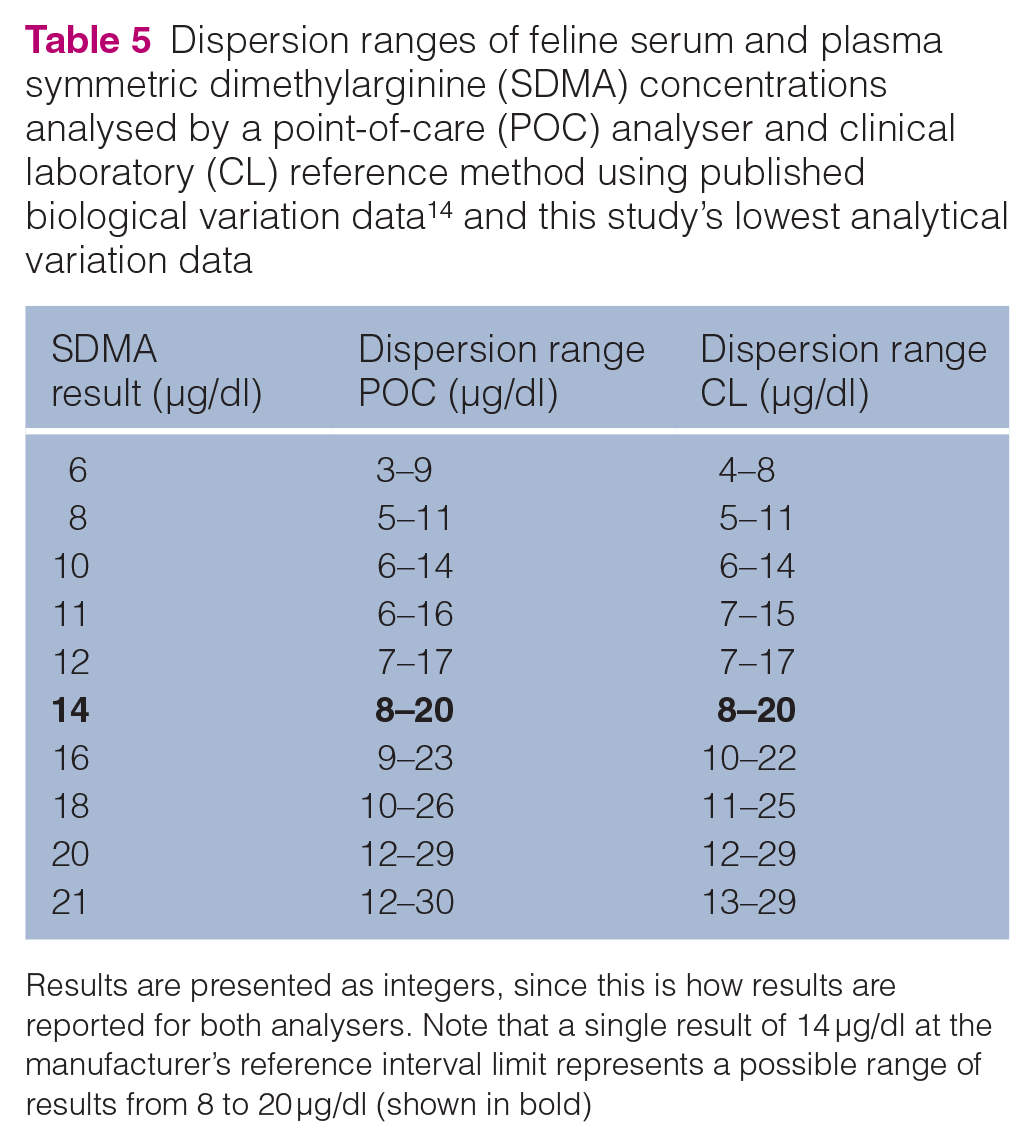
Results are presented as integers, since this is how results are reported for both analysers. Note that a single result of 14 μg/dl at the manufacturer’s reference interval limit represents a possible range of results from 8 to 20 μg/dl (shown in bold)
Clinical interpretation
Comparability of SDMA assays
Study 1
Nineteen of 63 (30.65%) differences between analysers were outside the TEA (based on expert opinion). Twelve of 63 (19.35%) differences between analysers were also outside the TED (Figure 7).
Study 2
Twenty-six of 50 (52%) differences between analysers were outside the TEA (based on expert opinion). Seventeen of 50 (34%) differences between analysers were also outside the TED (Figure 8).
Sigma metric
Study 1
POC analyser σ (PPN data) based on TED was 0.52; POC analyser σ (PPR data) based on TED was 0.56; CL analyser σ (PPN data) TED was 1.81; CL analyser σ (PPR data) TED was 1.98. Note that CL analyser bias was set as zero for these calculations, so σ values for this analyser reflect only imprecision.
Study 2
The high bias results resulted in the POC analyser σ being 0.46 for pooled plasma but, with bias being greater than TED for pooled serum, the σ was negative 0.43.
With the greatly improved imprecision and bias set at zero, the σ for the CL analyser was 3.92 (indicating approximately six errors for every 1000 samples) for plasma and 5.36 for serum (indicating approximately three errors for every 100,000 samples).
Discussion
Several measures of SDMA assay performance were consistent across both studies: bias between CL and POC analysers for pooled plasma/serum assessments; high number of clinical results outside TEA and TED performance goals; inability to meet total error goals; wide LOAs and scatter of results for Bland–Altman analyses of clinical samples; and large dispersion for results from both analysers. Additionally, there was generally large imprecision of the POC analyser (results for pooled plasma for the second study met quality goals, the other three assessments did not).
The large imprecision of both POC and CL SDMA assays in study 1 (and serum on the POC analyser in study 2) represents a lack of repeatability of results. Frozen samples have been used in prior SDMA studies with stability demonstrated;2,10 the most current POC analyser operator’s guide (2017) at the time of the study (2018) does not note any problem with frozen samples. However, a subsequent (2020) edition of the POC analyser operator’s guide recommends against freezing samples that will be used to run SDMA. There is a potential that freezing (all pooled assessments) may have impacted these results on the POC analyser. Study 2 was undertaken with the knowledge of, and financial support for, materials from the manufacturer.
A potential limitation of study 1 is that the number of SDMA repetitions was low (n = 12 for PPN and n = 8 for PPR on each analyser). Additional fictitious SDMA results were modelled mathematically (data not presented) at the closest integer to the mean value (the best possible scenario for additional samples) to bring each assessment to n = 20, and repeat analysis found that imprecision was still considerably outside the quality goal. The number of samples used for assessment of precision was increased for study 2 (n = 19 for serum and n = 23 for plasma). Recommendations regarding the number of samples appropriate to determine imprecision vary; although a precedent exists for estimating imprecison from as few as n = 5 replicate measurements, 17 it is generally accepted that 10–20 measurements should be the minimum number.18,19 Low imprecision of the creatinine assay on each analyser with both plasma and serum in both study 1 and study 2 affirms the stability of the pooled feline collections and confirms the reliability of this analyte on each analyser.
The major inconsistency between studies 1 and 2 was the markedly improved imprecision of the CL assay during study 2. This occurred after the CL made proprietary adjustments to improve precision after one of the authors contacted the laboratory to express concern about the precision performance observed during study 1. Improving the CL analyser’s imprecision led to improved σ for this analyser during study 2.
The other inconsistency between studies 1 and 2 was the average bias (and correlation and regression slope) of the clinical results, which worsened from −0.46% in study 1 to −11.53% in study 2. This inconsistency is difficult to assess, since study 1 compared plasma (POC analyser) with serum (CL analyser) and study 2 compared plasma on both analysers. Sample matrix is a variable in these comparisons, and it is unclear whether inconsistent bias is due to sample matrix and/or other factors.
The authors do not have a definitive explanation for bias calculated from pooled sample measurements being substantially larger than bias calculated from individual patient sample comparisons. However, the notably lower bias seen with patient samples from study 1 (in which plasma assessments on the POC analyser were compared with serum assessments on the CL analyser) suggests that bias data may have been impacted by specimen matrix (plasma vs serum), and raises the question of whether plasma and serum yield different results for the SDMA immunoassay on either the POC or CL analysers, or both. The decision was made to use plasma for POC measurements because it was expected this would be routine for clinical practice and is the specimen routinely used for biochemistry assays in one of the author’s practices (RB). Serum was submitted for CL testing based on a recommendation from the laboratory. 20 The effect of delayed serum separation is unknown. The initial intent of comparing plasma with serum was to replicate expected conditions in routine clinical practice. Inconsistent bias between pooled samples and clinical samples in study 1 led to the altered study design of comparing plasma on both analysers in study 2. Prior studies indicate there is minimal difference between serum and plasma SDMA determinations when evaluated by the LC-MS method.21–23 The pooled serum assessments in study 2 indicate there is also bias between the POC and CL SDMA assays with serum, and the greater differences between paired clinical plasma SDMA samples on each analyser is consistent with the bias seen with pooled samples. Further studies are required to assess whether results for paired serum or plasma samples measured using the same analyser are equivalent. It is often assumed that serum and plasma give equivalent results, except for some notable exceptions like glucose and potassium where interactions between red blood cells and platelets and anticoagulant are important;24–26 however, differences in accuracy and precision for other analytes can be caused by matrix effects, meaning that the matrix in which the analyte is measured can impact measurement. 27 With hindsight, the altered sample handling recommendation in the POC analyser operator’s guide update occurring after our study period raises concern that freezing could impact SDMA results, and we cannot exclude that freezing of specimens may have impacted imprecision data from both studies. However, it is noteworthy that bias greater than the quality goal was also recognised for the unfrozen individual patient sample comparisons that compared plasma for each analyser in study 2.
In study 1 and study 2, the POC analyser exhibited negative bias (numerically lower results) compared with the CL analyser. The consistency of this bias across both studies indicates that these two assays are not interchangeable and suggests that assay-specific reference intervals are needed. Currently, the manufacturer-provided reference interval is the same for both analysers, and no published information is available regarding reference interval derivation. The reference interval for SDMA in dogs is identical and was determined with a different assay again (LC-MS). 28 A further implication of this bias is that a single instrument/assay should be used to follow patient trends over time.
One fifth to half of clinical results fell outside quality goals determined by expert opinion (TEA) and BV (TED). 9 This finding implies that 20–50% of feline SDMA results are not comparable between the POC and CL analysers, consistent with the bias identified.
Despite the number of individual cat results outside these quality goals, the mean difference of clinical results from study 1 was only −0.06 µg/dl (−0.46%, well within the bias quality goal of ± 7.95%). Focusing on mean difference, which reflects average bias only, can be misleading. Importantly, individual cat differences were variable and occasionally large, contributing to widely scattered differences as shown in the Bland–Altman plots. This is likely due, at least in part, to assay imprecision. The principle of Bland–Altman analysis is to assess whether two methods are ‘interchangeable’. The Bland–Altman LOA reflect ± 1.96 SD around the mean difference (ie, central 95% of the differences) and should be low enough to ‘not be clinically important’. 29 In the studies reported here, both analytical performance goals (TEA and TED) were considerably less than the Bland–Altman LOA at medically important concentrations around the upper SDMA reference limit of 14 µg/dl. The BV quality goal for TED crossed over the LOA at approximately 29 µg/dl, above which there is increased certainty that SDMA elevation is a true pathological change reflecting disease.
Analytical imprecision impacts assessment of method comparison, and large SDMA imprecision was reflected in the wide spread of residuals found in the Passing–Bablok regression analysis for study 1 and study 2. Results of Passing–Bablok regression (ie, confidence in the slope and y intercept estimates) depend on sampling size, number of replications, distribution of results, measurement range and precision of each method. 30 Deming regression was also performed (results not shown) and residuals were similar, which is to be expected when data points deviate from a straight line. Uncertainty in regression increases with greater variation of residuals regardless of the model used. 31
σ for study 1 were less than 2. A σ = 2 indicates 308,538 errors per million runs (30.8% error rate), 16 which is similar to the percentage of differences outside of the TEA based on expert opinion (30.65%). This indicates both SDMA assays cannot meet the expert opinion-based analytical performance goals. σ for the POC analyser in study 2 were similar to study 1; however, the σ improved substantially for the CL analyser for both plasma and serum due to greatly improved imprecision, as discussed above. Additionally, bias was set at zero for the study 2 σ calculation. It is also important to recognise that if the CL analyser had been compared with the POC analyser (ie, incorporating bias), then the σ would reduce to less than 1.
Any measured clinical pathology result represents a range of possible results, called dispersion, which is dependent upon both biological and analytical variation. Dispersion is a useful metric that facilitates patient data interpretation. Dispersion for a feline SDMA result at the upper reference limit of 14 µg/dl means (for both analysers) that a measured SDMA of ⩾20 µg/dl is required to have confidence (with 95% statistical probability) that a medically important SDMA increase is present. This example illustrates that true analytical performance capability of a test may not match expectations that clinicians have for test performance, and that clinicians can be at risk of attaching medical significance to changes that actually reflect analytical and biological variability. Information about dispersion based on analytical imprecision and BV should be more widely disseminated for all established and new assays used in veterinary medicine for which we have reliable species-specific information about BV.
Conclusions
This study assessed SDMA assay performance across two studies of feline serum and plasma. Both studies showed bias between the two analysers, indicating that analyser-specific reference intervals are required. Total error assessments indicated that between one fifth and a half of results were not comparable between analysers. Repeatability of the same samples was predominantly outside performance goals for the POC analyser and improved for the CL after the authors notified the manufacturer about their initial findings. The wide dispersion of both SDMA assays imply that clinicians risk attaching medical significance to small SDMA changes that actually reflect analytical or biological variability.
Supplemental Material
sj-png-1-jfm-10.1177_1098612X20983260 – Supplemental material for Comparison of serum and plasma SDMA measured with point-of-care and reference laboratory analysers: implications for interpretation of SDMA in cats
Supplemental material, sj-png-1-jfm-10.1177_1098612X20983260 for Comparison of serum and plasma SDMA measured with point-of-care and reference laboratory analysers: implications for interpretation of SDMA in cats by Randolph M Baral, Kathleen P Freeman and Bente Flatland in Journal of Feline Medicine and Surgery
Supplemental Material
sj-png-2-jfm-10.1177_1098612X20983260 – Supplemental material for Comparison of serum and plasma SDMA measured with point-of-care and reference laboratory analysers: implications for interpretation of SDMA in cats
Supplemental material, sj-png-2-jfm-10.1177_1098612X20983260 for Comparison of serum and plasma SDMA measured with point-of-care and reference laboratory analysers: implications for interpretation of SDMA in cats by Randolph M Baral, Kathleen P Freeman and Bente Flatland in Journal of Feline Medicine and Surgery
Supplemental Material
sj-png-3-jfm-10.1177_1098612X20983260 – Supplemental material for Comparison of serum and plasma SDMA measured with point-of-care and reference laboratory analysers: implications for interpretation of SDMA in cats
Supplemental material, sj-png-3-jfm-10.1177_1098612X20983260 for Comparison of serum and plasma SDMA measured with point-of-care and reference laboratory analysers: implications for interpretation of SDMA in cats by Randolph M Baral, Kathleen P Freeman and Bente Flatland in Journal of Feline Medicine and Surgery
Supplemental Material
sj-png-4-jfm-10.1177_1098612X20983260 – Supplemental material for Comparison of serum and plasma SDMA measured with point-of-care and reference laboratory analysers: implications for interpretation of SDMA in cats
Supplemental material, sj-png-4-jfm-10.1177_1098612X20983260 for Comparison of serum and plasma SDMA measured with point-of-care and reference laboratory analysers: implications for interpretation of SDMA in cats by Randolph M Baral, Kathleen P Freeman and Bente Flatland in Journal of Feline Medicine and Surgery
Supplemental Material
sj-xlsx-1-jfm-10.1177_1098612X20983260 – Supplemental material for Comparison of serum and plasma SDMA measured with point-of-care and reference laboratory analysers: implications for interpretation of SDMA in cats
Supplemental material, sj-xlsx-1-jfm-10.1177_1098612X20983260 for Comparison of serum and plasma SDMA measured with point-of-care and reference laboratory analysers: implications for interpretation of SDMA in cats by Randolph M Baral, Kathleen P Freeman and Bente Flatland in Journal of Feline Medicine and Surgery
Supplemental Material
sj-xlsx-2-jfm-10.1177_1098612X20983260 – Supplemental material for Comparison of serum and plasma SDMA measured with point-of-care and reference laboratory analysers: implications for interpretation of SDMA in cats
Supplemental material, sj-xlsx-2-jfm-10.1177_1098612X20983260 for Comparison of serum and plasma SDMA measured with point-of-care and reference laboratory analysers: implications for interpretation of SDMA in cats by Randolph M Baral, Kathleen P Freeman and Bente Flatland in Journal of Feline Medicine and Surgery
Footnotes
Acknowledgements
The authors thank Diane Rigoulet, Helen Ligonis and Rebecca Hoyle for performing SDMA assessments on the POC analyser and preparing samples for courier to the laboratory.
Accepted: 30 November 2020
Supplementary material
The following files are available online:
Table S1: Raw data from clinical case comparisons of SDMA results determined for study 1 from prospective collection of individual feline patient serum (assessed on a CL analyser) and heparinised plasma specimens (assessed on a POC analyser) showing breed, sex and age of subjects as well as presence and degree of haemolysis and lipaemia.
Table S2: Raw data from clinical case comparisons of SDMA results determined for study 2 from prospective collection of individual feline heparinised plasma specimens (assessed on both CL and POC analysers) showing breed, sex and age of subjects as well as presence and degree of haemolysis and lipaemia.
Table S3: Raw data of SDMA results for imprecision study (study 1) determined from PPN and PPR on POC and CL analysers.
Table S4: Raw data of SDMA results for imprecision study (study 2) determined from pooled serum and pooled plasma on POC and CL analysers.
Figure S1: Passing–Bablok regression determined from results from feline serum and plasma SDMA concentrations analysed by a CL analyser and POC analyser prior to optimisation of the CL method (study 1).
Figure S2: Passing–Bablok regression residuals determined from results from feline serum and plasma SDMA concentrations analysed by a CL analyser and POC analyser prior to optimisation of the CL method (study 1).
Figure S3: Passing–Bablok regression residuals determined from results from feline plasma SDMA concentrations analysed by a CL analyser and POC analyser after optimisation of the CL method (study 2).
Figure S4: Passing–Bablok regression residuals determined from results from feline plasma SDMA concentrations analysed by a CL analyser and POC analyser after optimisation of the CL method (study 2).
Conflict of interest
The author(s) declared no potential conflicts of interest with respect to the research, authorship, and/or publication of this article.
Funding
The author(s) disclosed receipt of the following financial support for the research, authorship, and/or publication of this article: all testing for study 1 (POC and CL) was paid for at regular commercial rates. For study 2, IDEXX provided SDMA sample slides for POC testing and all CL testing.
Ethical approval
This work involved the use of non-experimental animals only (including owned or unowned animals and data from prospective or retrospective studies). Established internationally recognised high standards (‘best practice’) of individual veterinary clinical patient care were followed. Ethical approval from a committee was therefore not necessarily required.
Informed consent
Informed consent (either verbal or written) was obtained from the owner or legal custodian of all animal(s) described in this work (either experimental or non-experimental animals) for the procedure(s) undertaken (either prospective or retrospective studies). No animals or humans are identifiable within this publication, and therefore additional informed consent for publication was not required.
References
Supplementary Material
Please find the following supplemental material available below.
For Open Access articles published under a Creative Commons License, all supplemental material carries the same license as the article it is associated with.
For non-Open Access articles published, all supplemental material carries a non-exclusive license, and permission requests for re-use of supplemental material or any part of supplemental material shall be sent directly to the copyright owner as specified in the copyright notice associated with the article.