
Abstract
The organotin, trimethyltin (TMT), is a highly toxic compound. In this study, silver-stained rat brain sections were qualitatively and quantitatively evaluated for degeneration after systemic treatment with TMT. Degenerated neurons were counted using image analysis methods available in the HALO image analysis software. Specific brain areas including the cortex, inferior and superior colliculus, and thalamus were quantitatively analyzed. Our results indicate extensive and widespread damage to the rat brain after systemic administration of TMT. Qualitative results suggest severe TMT-induced toxicity 3 and 7 days after the administration of TMT. Trimethyltin toxicity was greatest in the hippocampus, olfactory area, cerebellum, pons, mammillary nucleus, inferior and superior colliculus, hypoglossal nucleus, thalamus, and cerebellar Purkinje cells. Quantification showed that the optic layer of the superior colliculus exhibited significantly more degeneration compared to layers above and below. The inferior colliculus showed greater degeneration in the dorsal area relative to the central area. Similarly, in cortical layers, there was greater neurodegeneration in deeper layers compared to superficial layers. Quantification of damage in various thalamic nuclei showed that the greatest degeneration occurred in midline and intralaminar nuclei. These results suggest selective neuronal network vulnerability to TMT-related toxicity in the rat brain.
Introduction
Trimethyltin (TMT) is an extremely toxic organotin compound. Trimethyltin is extensively used in industry as a stabilizer for plastics and is also used as an additive in paints. 1 Trimethyltin toxicity received attention after several occupational accidents in which exposed individuals exhibited various nervous system symptoms, such as seizures, headaches, and hearing and memory impairments. 2 As well as being of environmental concern, TMT is a frequently used “model” neurotoxicant, so a detailed analysis of its impact is very useful.
Neurotoxic effects of TMT have been described in rodent animal models. Rats treated with TMT also show nervous system impairments such as seizures and hyperactivity. Both spatial and temporal neurotoxic effects in rats have been reported in numerous studies.3-5 While the exact mechanism(s) of action underlying TMT neurotoxicity are unknown, involvement is believed to include calcium overload, 6 the affinity of organotin compounds to sulfhydryl groups in protein, 7 and oxidative stress pathways. 8 Several studies have shown neurotoxic effects of TMT on the hippocampus,9-18 in particular. Hippocampal pyramidal neurons were found to be more sensitive to TMT compared to granule cells. 19 Hippocampal damage due to TMT is used as a tool in various neurodegenerative studies. 20 Although studies have mainly focused on the hippocampus because of its sensitivity to TMT, the extent of TMT neurotoxicity is widely spread across areas of the brain. Trimethyltin exposure affects several brain regions such as the cerebral cortex, olfactory regions, the cerebellum, and areas involved in the limbic system such as the amygdala. 10
In this study, we qualitatively evaluated TMT-induced toxicity in the rat brain using sections stained with amino-cupric-silver (AmCuAg) stain to highlight the differential vulnerability of each region. Here, we also describe neuronal vulnerability to TMT by quantifying neuronal degeneration within a brain region.
Material and Methods
Animals and TMT Treatment
Protocols regarding animal use were approved and performed in accordance with the policy of the Institutional Animal Care and Use Committee at the National Center for Toxicological Research. Male Sprague Dawley rats (n = 34, age = 78 ± 1.9 days, weight = 318.56 ± 5.82 g) were obtained from Charles River Laboratories (Raleigh, NC). Rats were singly housed in polypropylene cages with ventilated isolator tops and natural wood chip bedding. They were fed a standard rat chow diet ad libitum and maintained under a 12/12 hours day/night light cycle. They were administered a single 8 (n = 4), 10 (n = 10), 11 (n = 7), or 12 mg/kg (n = 10) intraperitoneal dose of TMT (Sigma Aldrich, St. Louis, MO) or saline (2.0 mL/kg, control, n = 3). Animals were scheduled for sacrifice at 14, 21, and 35 days after TMT injection; however, if they showed severe signs of pain and distress, they were sacrificed earlier. The resulting sacrifice times were as follows: 3 (n = 5), 7 (n = 11), 14 (n = 3), 21 (n = 9), or 35 (n = 3) days posttreatment. For sacrifice, each rat was anesthetized with 5% isoflurane and perfused transcardially with 4% paraformaldehyde as described earlier.21,22
Histology
Individual isolated brains were stored in formaldehyde solution for no more than 24 hours, followed by storage in PBS, and subsequent embedding in a gelatin-based matrix using MultiBrain Technology (Neuroscience Associates, Inc., Knoxville, TN) for coronal sectioning. 23 Eighty-one serial coronal sections (40 μm) were obtained for each animal and stained using an AmCuAg stain. 23
Section Digitization and Area Quantification
Stained sections were digitized using a whole slide imaging instrument (Aperio ScanScope XT; Leica Biosystems, Vista, CA) at ×200 magnification. Sections corresponding to different brain regions were selected from 81 digitized coronal sections stained with AmCuAg, and quantitative analyses of the pathological changes associated with TMT administration were performed.
Qualitative and Quantitative Evaluation
Silver stained slides were visually analyzed (n = 34) qualitatively for degeneration in various brain areas. Degenerated neurons were quantitatively counted (count per square millimeter) using the object colocalization module available in the HALO software (Indica Labs, Albuquerque, NM). Various parameters such as stain color (black), minimum optical density (0.217), contrast radius (12), contrast threshold (0.5), minimum object size (50 or 100 μm2) were defined in this module to detect silver-stained degenerated neurons. From each of 6 animals, 2 to 3 sections were analyzed for specific brain areas. Superior and inferior colliculi were quantified to observe regional differences in degenerated neurons within these structures. Superficial cortical layers were comprised primarily of layers 1 and 2/3, and the deeper layer regions were comprised mainly of layers 5/6. These were quantified as was the thalamus to determine the selective vulnerability of different brain areas and nuclei within the thalamic structure. Kruskal-Wallis tests followed by, if appropriate, Conover-Iman tests of multiple comparisons were used to determine statistically significant differences. Results are shown as means ± SEMs (Table 1).
Mean ± SEM Values of Counts per mm Squared of Degenerated Neurons in Rats Treated With Saline or TMT in Cortex, Inferior Colliculus, Superior Colliculus, and Thalamus.
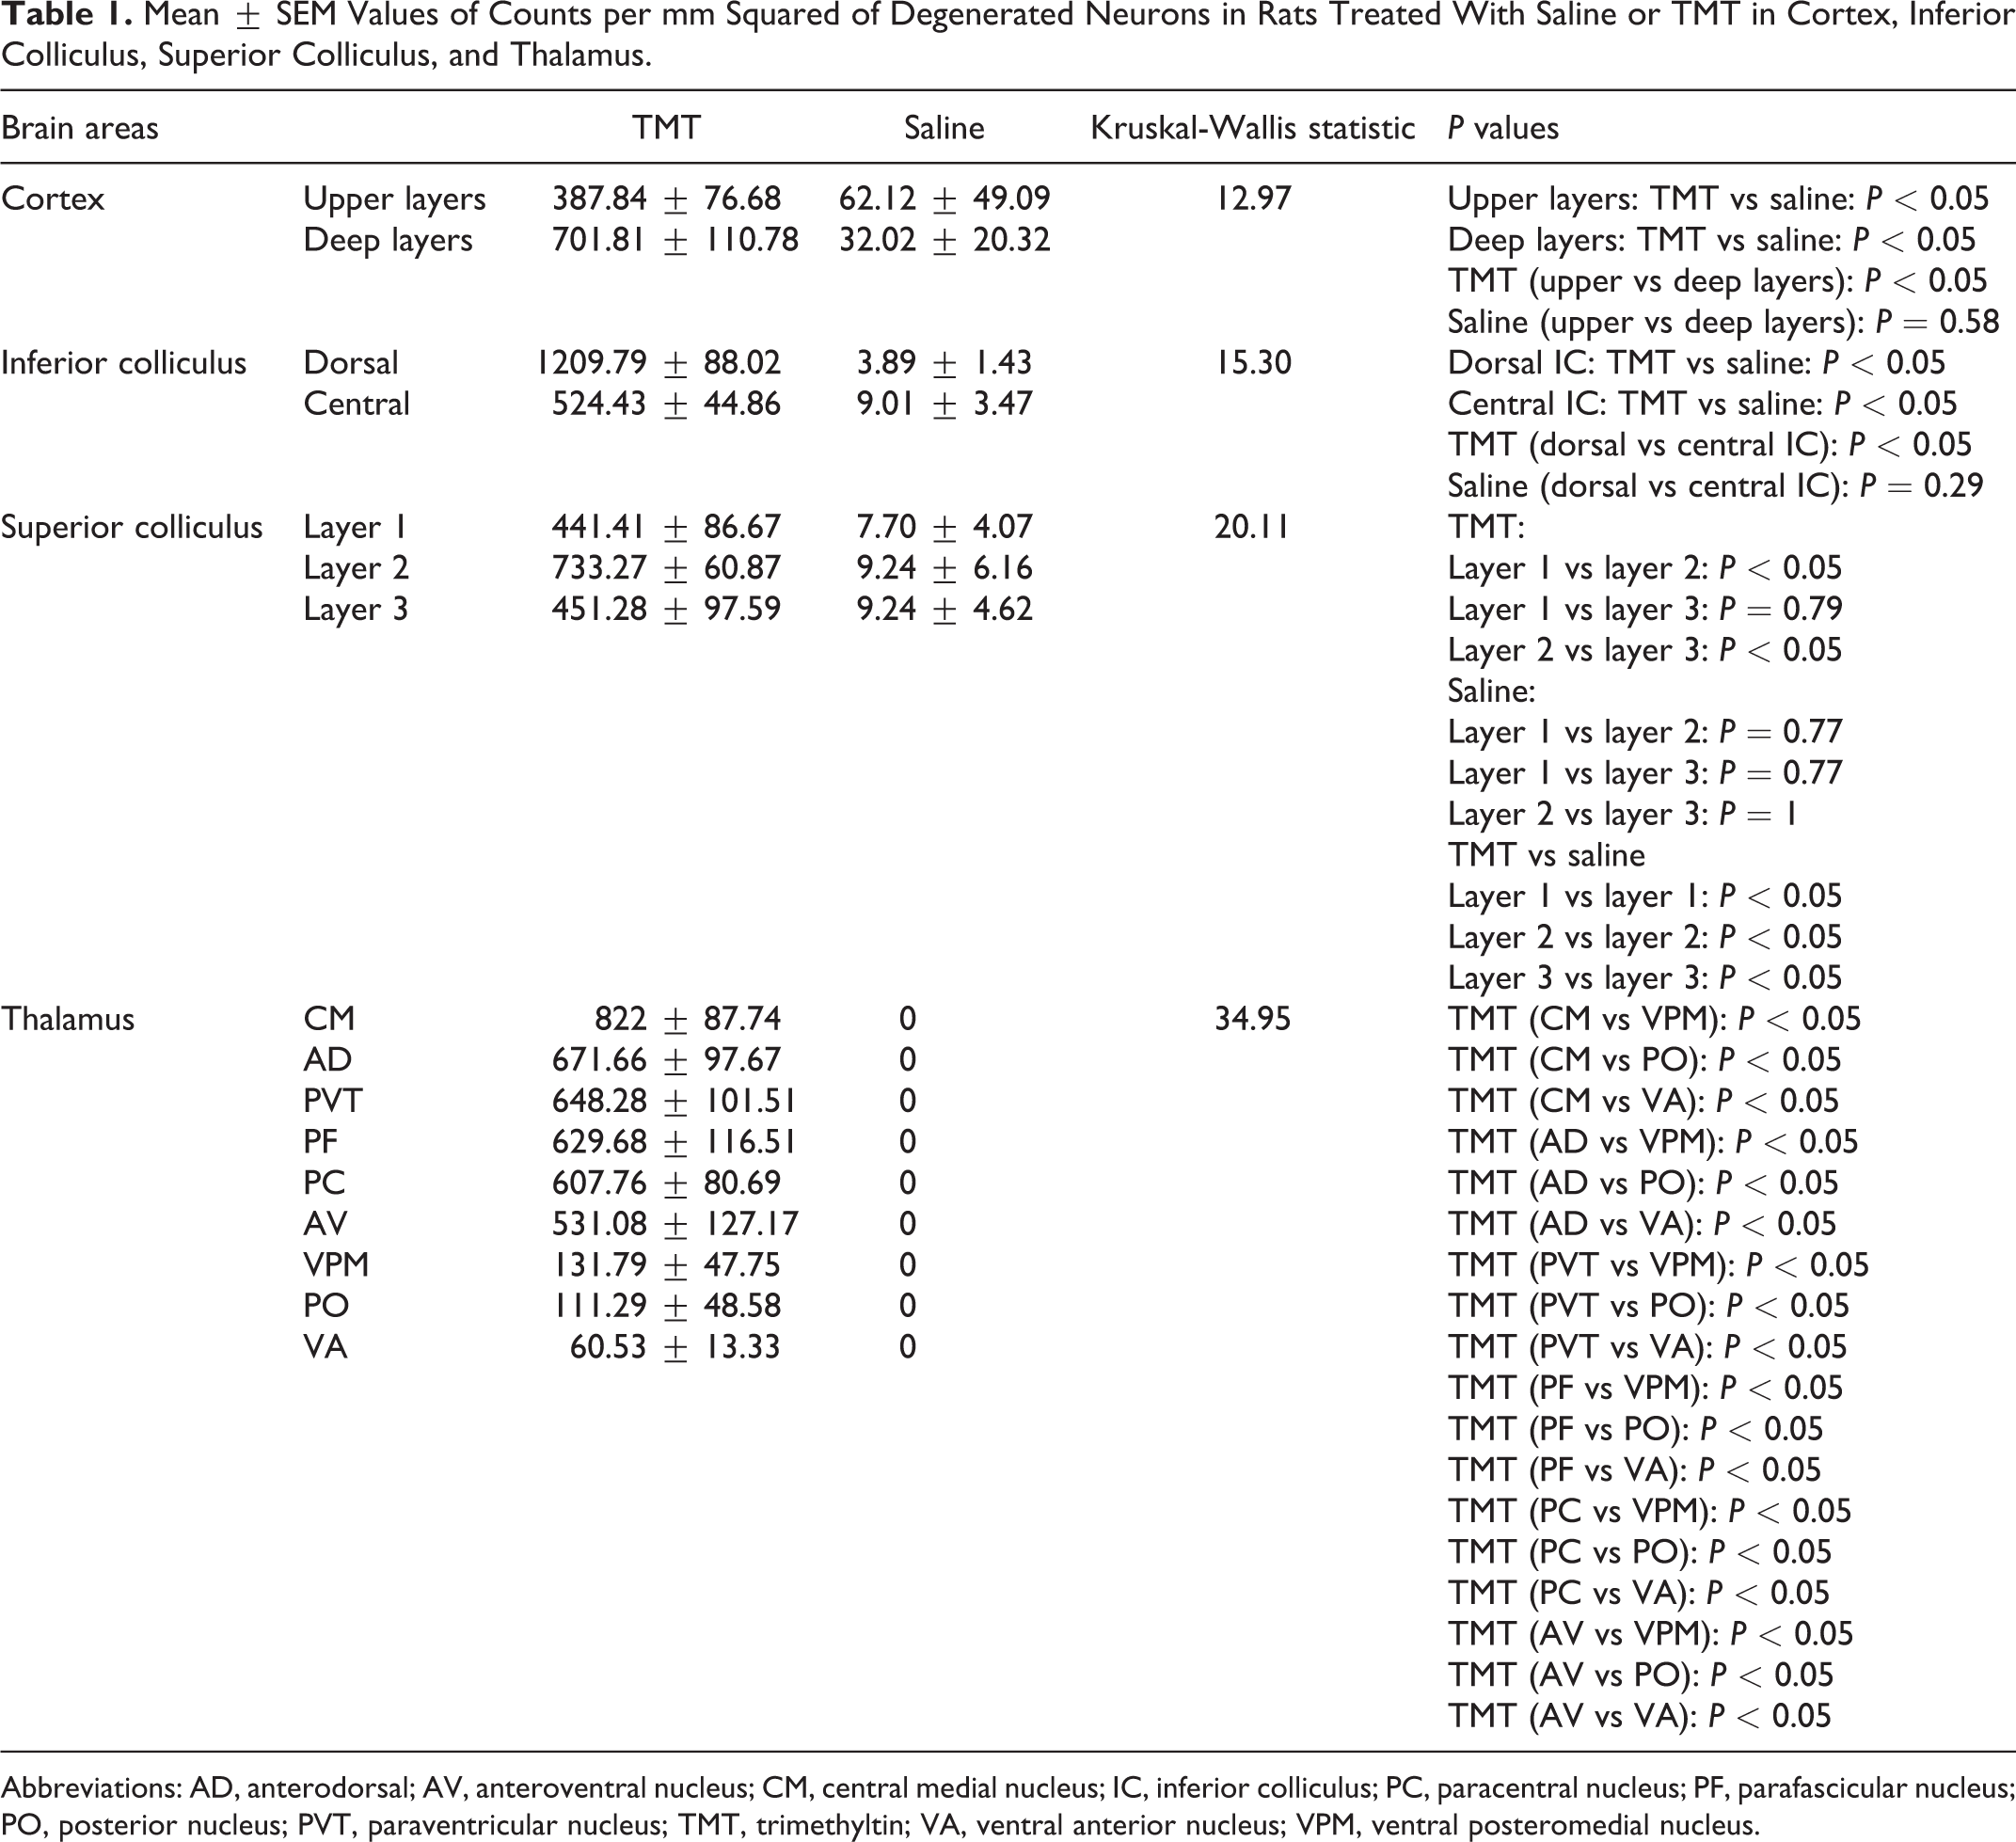
Abbreviations: AD, anterodorsal; AV, anteroventral nucleus; CM, central medial nucleus; IC, inferior colliculus; PC, paracentral nucleus; PF, parafascicular nucleus; PO, posterior nucleus; PVT, paraventricular nucleus; TMT, trimethyltin; VA, ventral anterior nucleus; VPM, ventral posteromedial nucleus.
Results
Qualitative Results
Severe toxicity was seen in various brain areas when animals were sacrificed at 3 and 7 days post-TMT administration due to health issues. Rats that survived until 14-, 21- and 35-day sacrifice times showed much less toxicity (Figure 1). Comparison of animals by dose (≤10 or >10 mg/kg) and time of sacrifice (≤7 or > 7 days) showed that the time of sacrifice was dependent on the dose (Fisher exact test P value = 0.0038).
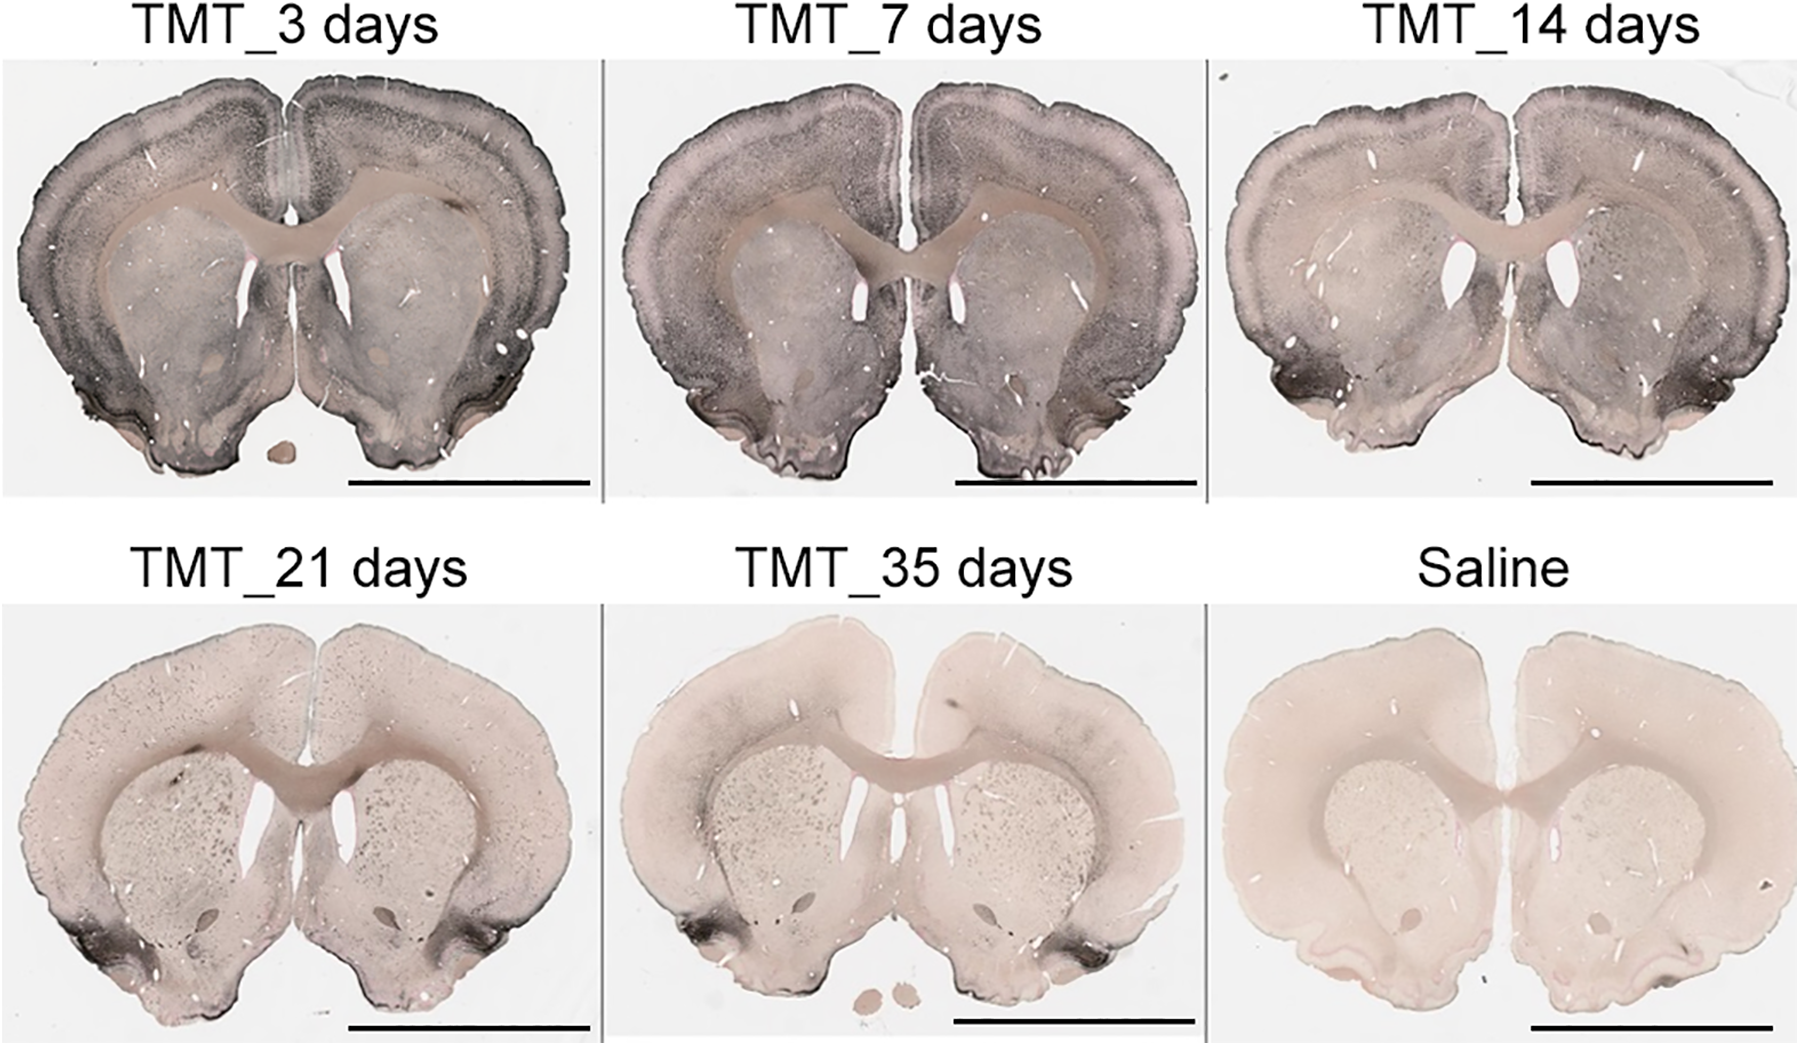
Representative silver-stained images of coronal brain sections of TMT-treated rats (dose = 10-12 mg/kg) sacrificed at 3, 7, 14, 21, and 35 days post-TMT treatment. Scale bar: 5 mm. TMT indicates trimethyltin.
For qualitative analysis of neurotoxicity in various brain areas, animals sacrificed at 3 and/or 7 days (dose = 10-12 mg/kg) post-TMT treatment were used. There were no qualitative differences between 10-12 mg/kg doses. Trimethyltin-induced toxicity was primarily observed in the following brain areas:
Hippocampus
The pyramidal cell layer of the hippocampus showed very prominent degeneration in TMT-treated animals. There was more damage in the CA1 region than in the dentate gyrus (Figure 2A).
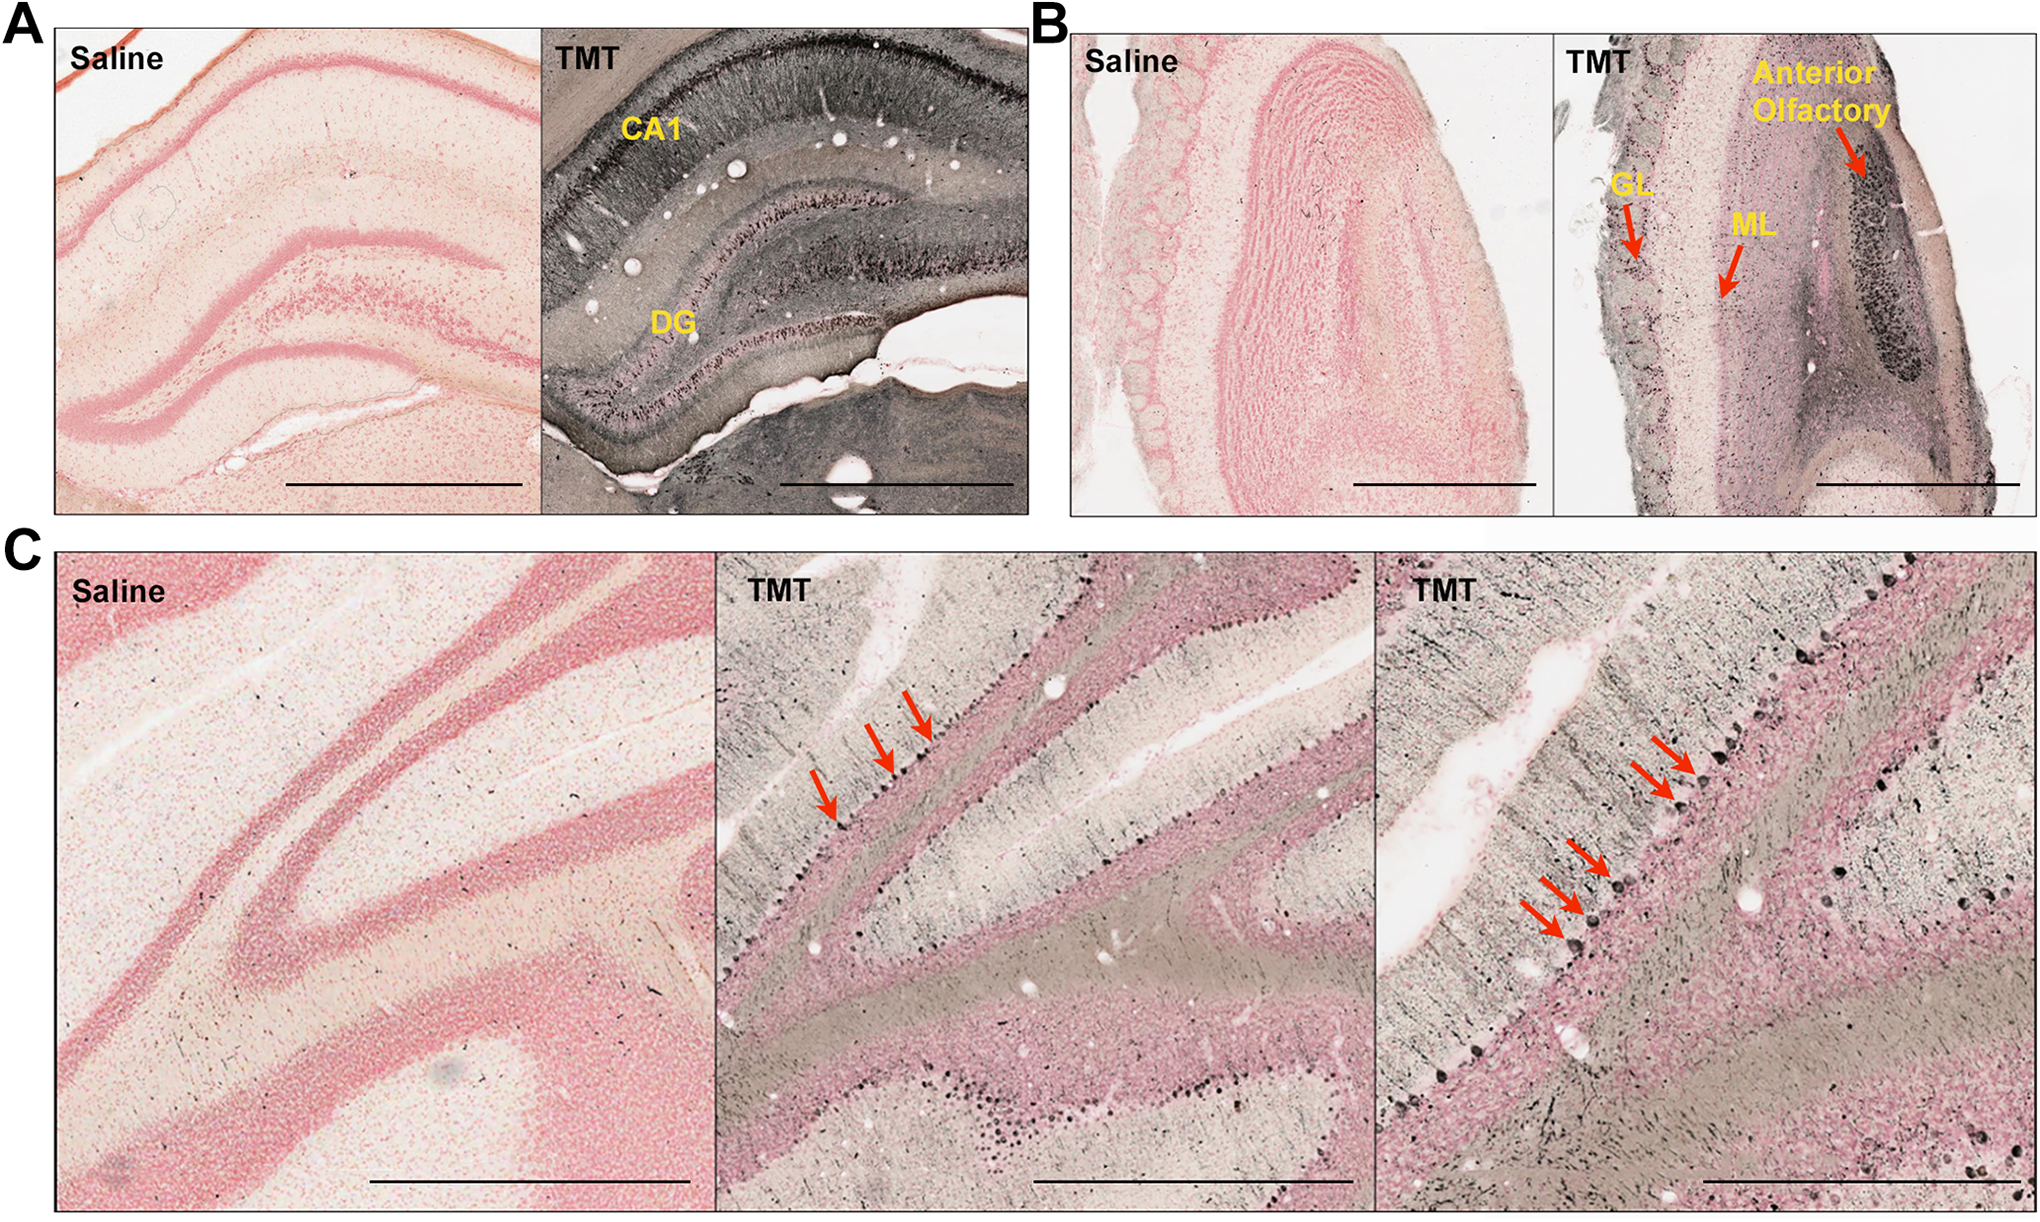
Representative silver-stained images of coronal brain sections of TMT-treated rats (dose = 10-12 mg/kg) showing specific neurodegeneration. A, Hippocampus. B, Olfactory area. C, Cerebellum (red arrows show degenerated Purkinje cells). CA, cornu ammonis; DG, dentate gyrus; GL, glomerular layer; ML, mitral cell layer. Scale bar: 1 mm in A, B, C left, and C middle panels; 500 µm in C right panel. TMT, trimethyltin
Olfactory area
The mitral cell layer, glomerular cell layer, and anterior olfactory nucleus showed marked degeneration in the olfactory region (Figure 2B). In the mitral cell layer, mitral cells have large cell bodies and long secondary dendrites which extend to the deeper layers of the external plexiform layers. Tufted cells have smaller cell bodies compared to mitral cells and are mainly present in the external plexiform layer. Tufted cells were less affected by TMT because the external plexiform layer showed less degeneration than the mitral cell layer.
Cerebellum
Extensive damage of the Purkinje cells was observed in the cerebellar sections, indicating their increased vulnerability to TMT (Figure 2C).
Pontine nucleus, mammillary nucleus, and hypoglossal nucleus degeneration
The pontine nucleus (Figure 3A), mammillary nucleus (Figure 3B), and hypoglossal nucleus (Figure 3D) showed severe damage in TMT-treated rats.
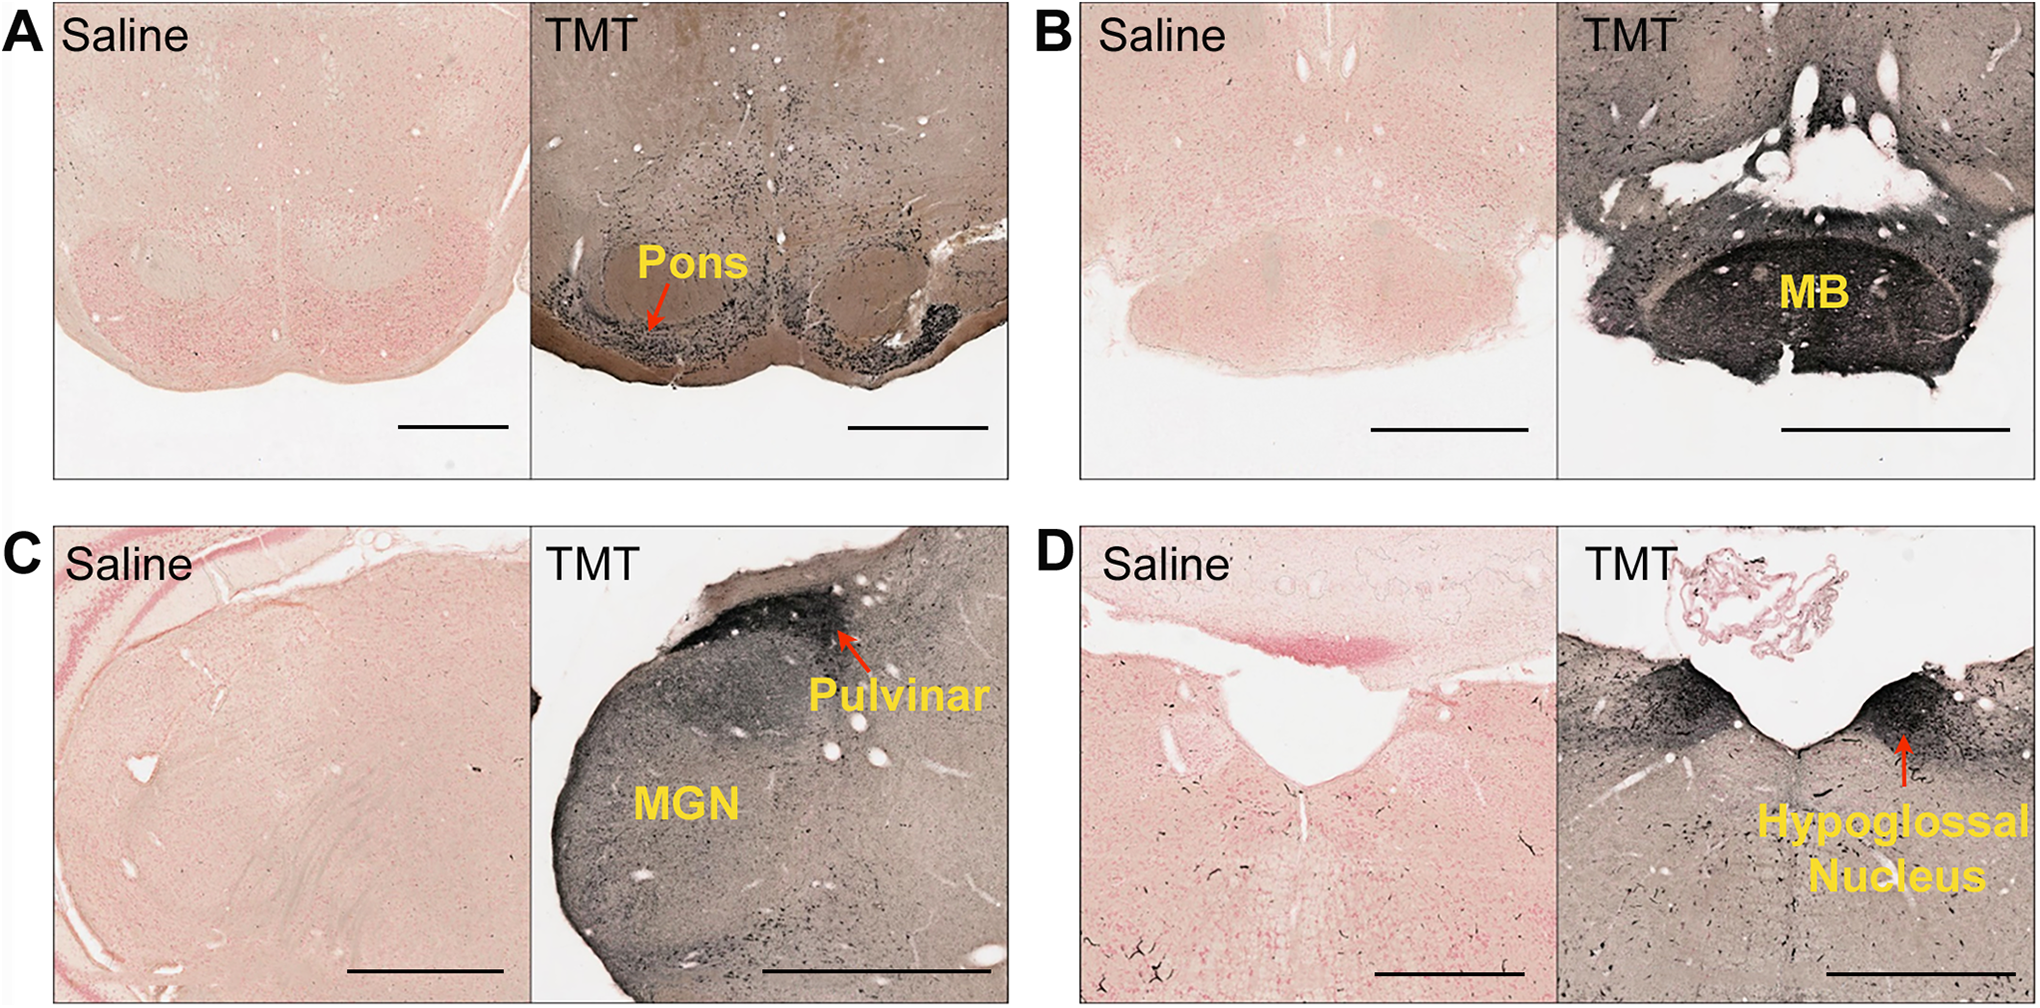
Representative silver-stained images of coronal brain sections of TMT-treated rats (dose = 10-12 mg/kg) showing specific neurodegeneration. A, Pontine nuclei. B, Mammillary nucleus (MB). C, Pulvinar and medial geniculate nucleus (MGN). D, Hypoglossal nucleus. Scale bar: 1 mm. MB indicates mammillary body; TMT, trimethyltin.
Layer-specific toxicity in the cortex
An extensive degree of specificity was observed in the neurotoxicity induced by TMT. Various layers of the cortex were differentially affected. Superficial layers such as layers 1 and 2/3 (Figure 4C) were not as severely affected as other layers in the motor and somatosensory cortices. Maximum degeneration was observed in the deeper layers such as layers 5/6 (Figure 4C). This laminar pattern of degeneration was observed throughout the cortex. Layer specificity was also seen in posterior cortical regions such as the entorhinal and visual cortices where the secondary visual cortex was more sensitive to TMT than the primary visual cortex. Piriform and insular cortices also showed a laminar pattern of degeneration, but because there are not 6 layers in these areas, the pattern of degeneration was different from other cortical areas.
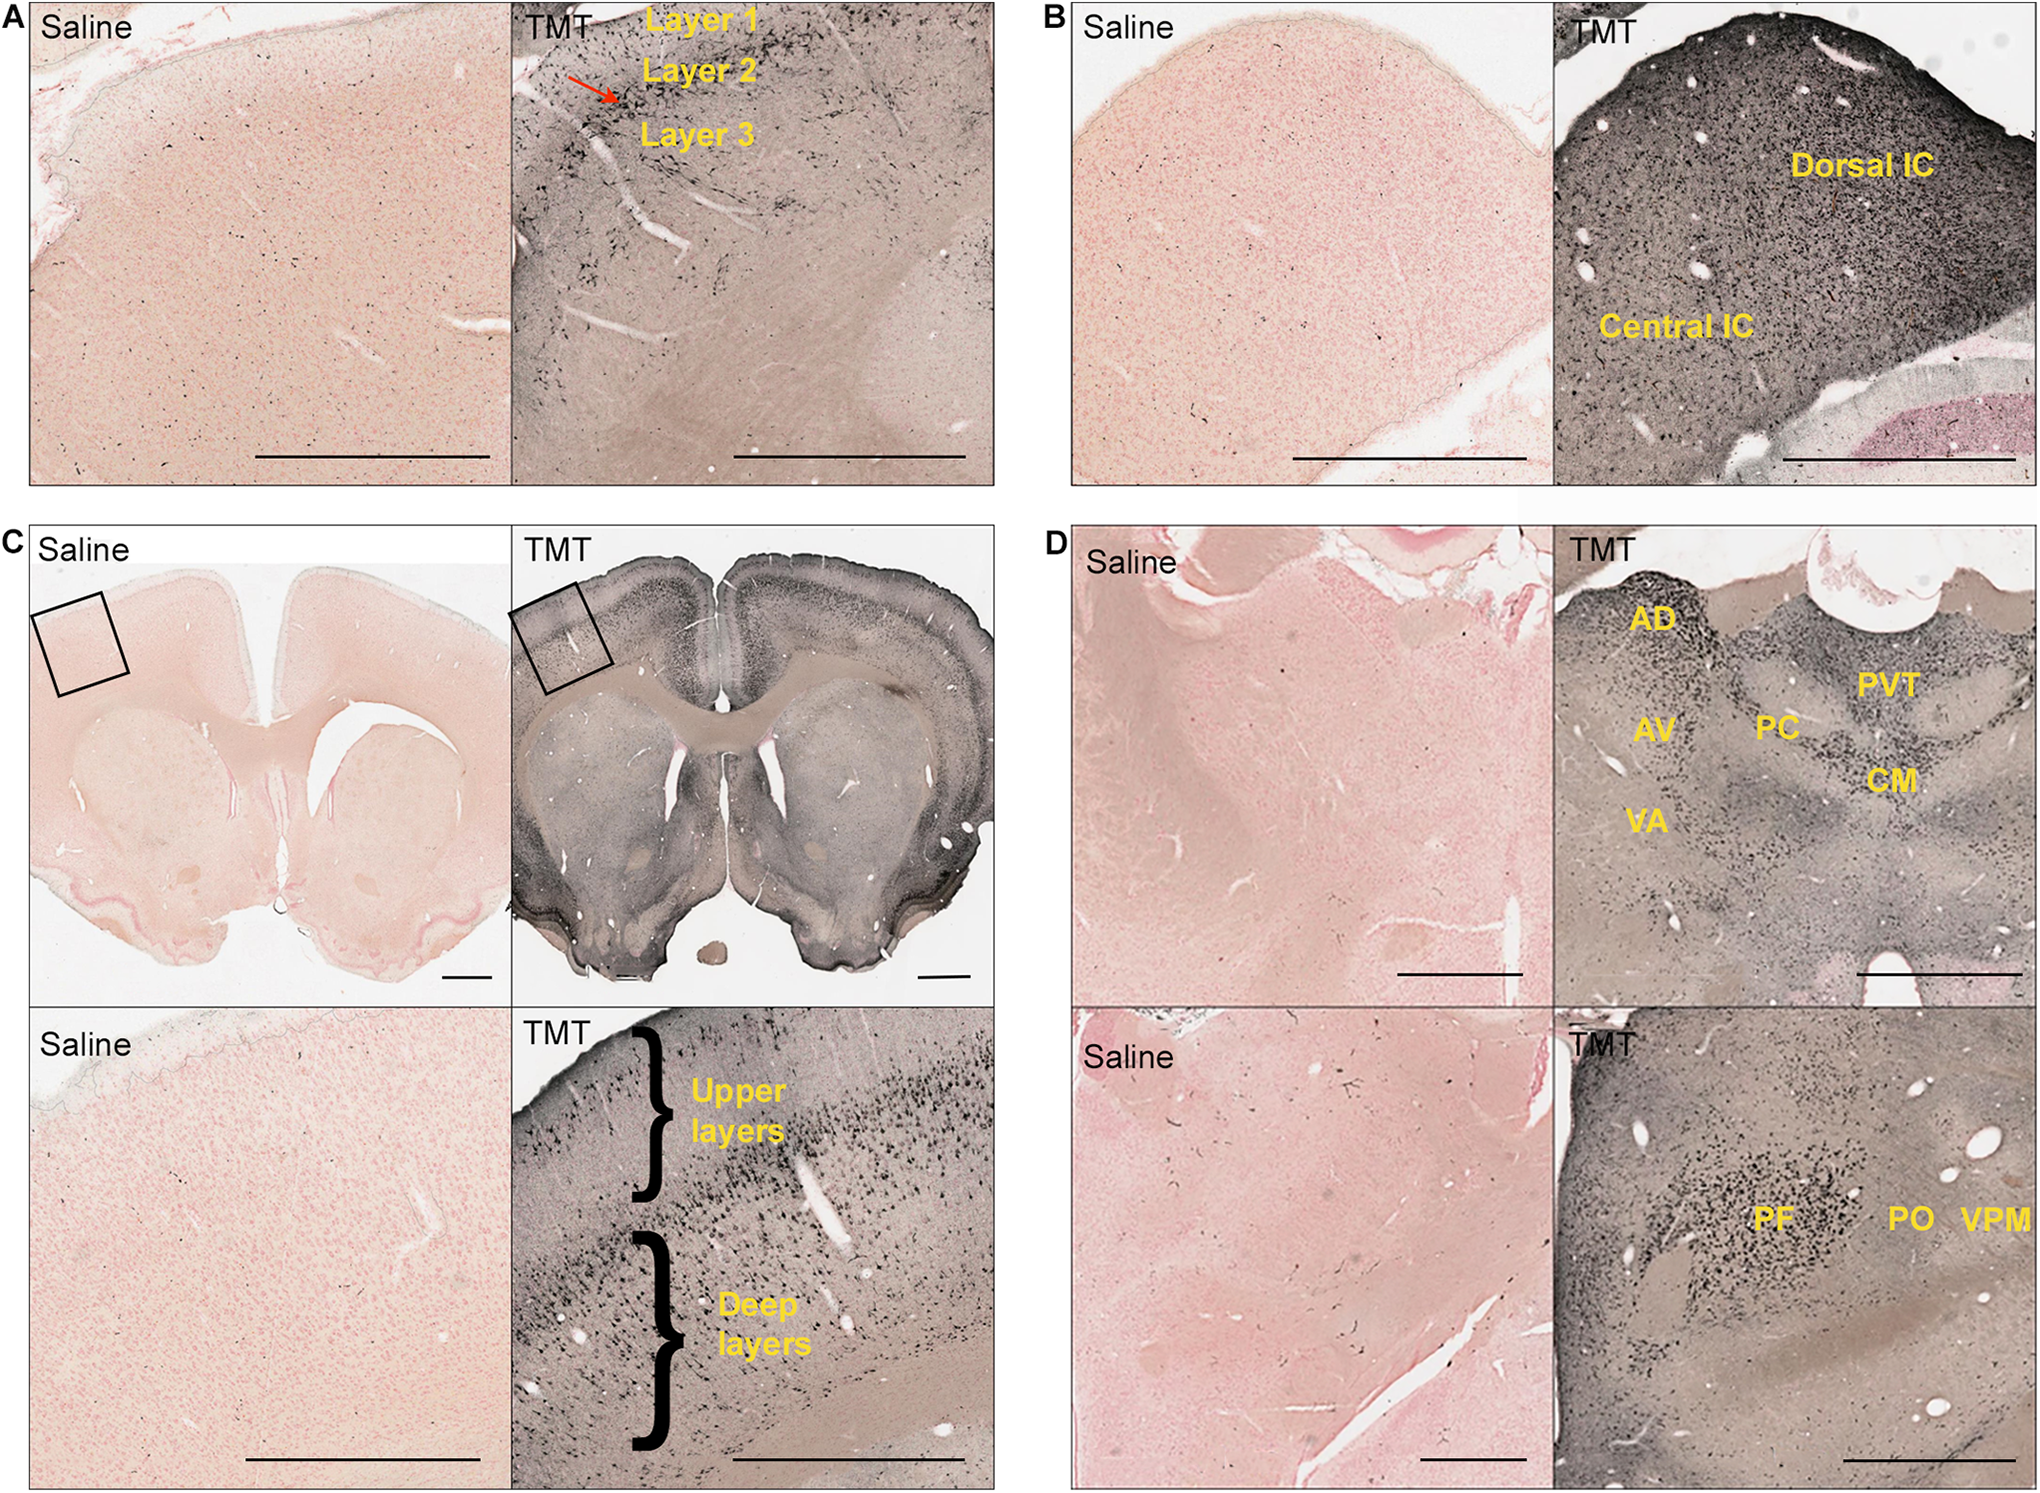
Representative silver-stained images of coronal brain sections of TMT-treated rats (dose = 10-12 mg/kg) showing specific neurodegeneration. A, Superior colliculus (red arrow shows degeneration in the optic layer of SC). B, Inferior colliculus. C, Cortex showing upper and deep layers. D, Thalamus. Scale bar: 1 mm. AD indicates anterodorsal nucleus; AV, anteroventral nucleus; CM, central medial nucleus; PC, paracentral nucleus; PF, parafascicular nucleus; PO, posterior nucleus; PVT, paraventricular nucleus; TMT, trimethyltin; VA, ventral anterior nucleus; VPM, ventral posteromedial nucleus.
Region-specific toxicity in the superior and inferior colliculus
The optic region in the superior colliculus showed greater degeneration than other brain areas in TMT-treated rats (Figure 4A). Differences in degeneration within the inferior colliculus were observed, with the dorsal colliculus showing more degeneration than the central inferior colliculus (Figure 4B).
Thalamus
Midline and intralaminar thalamic nuclei showed extensive damage due to TMT treatment (Figure 4D). Distinct damage to the pulvinar nucleus (Figure 3C), the medial geniculate body (Figure 3C), and the anterior thalamus (Figure 4D) was observed. Nuclei such as the posterior thalamic nucleus, ventral posteromedial thalamic nucleus, ventromedial thalamic nucleus, and ventral posterolateral thalamic nucleus were spared or exhibited minimal degeneration which demonstrated selective vulnerability within the thalamus (Figure 4D).
Quantification results
Quantification of damage was carried out for 4 brain structures: superior colliculus, inferior colliculus, cortex, and thalamus. For quantitative analysis of neurotoxicity, animals sacrificed at 3 and/or 7 days (dose = 10-12 mg/kg) post-TMT treatment were used. Figure 5 shows degenerating neurons colored in green after images were labeled based on a color thresholding method. Layer 2 of the superior colliculus, which is considered the optic layer, showed significantly greater degeneration compared to layers above and below (Figure 5A). The inferior colliculus showed greater degeneration in the dorsal area compared to the central area (Figure 5B, Table 1). Similarly, quantification of cortical layers suggested a greater number of degenerating neurons in the superficial layers compared to the deeper layers (Figure 5C, Table 1). Quantification of various thalamic nuclei showed more degeneration in midline nuclei and the intralaminar region (Figure 5D, Table 1).
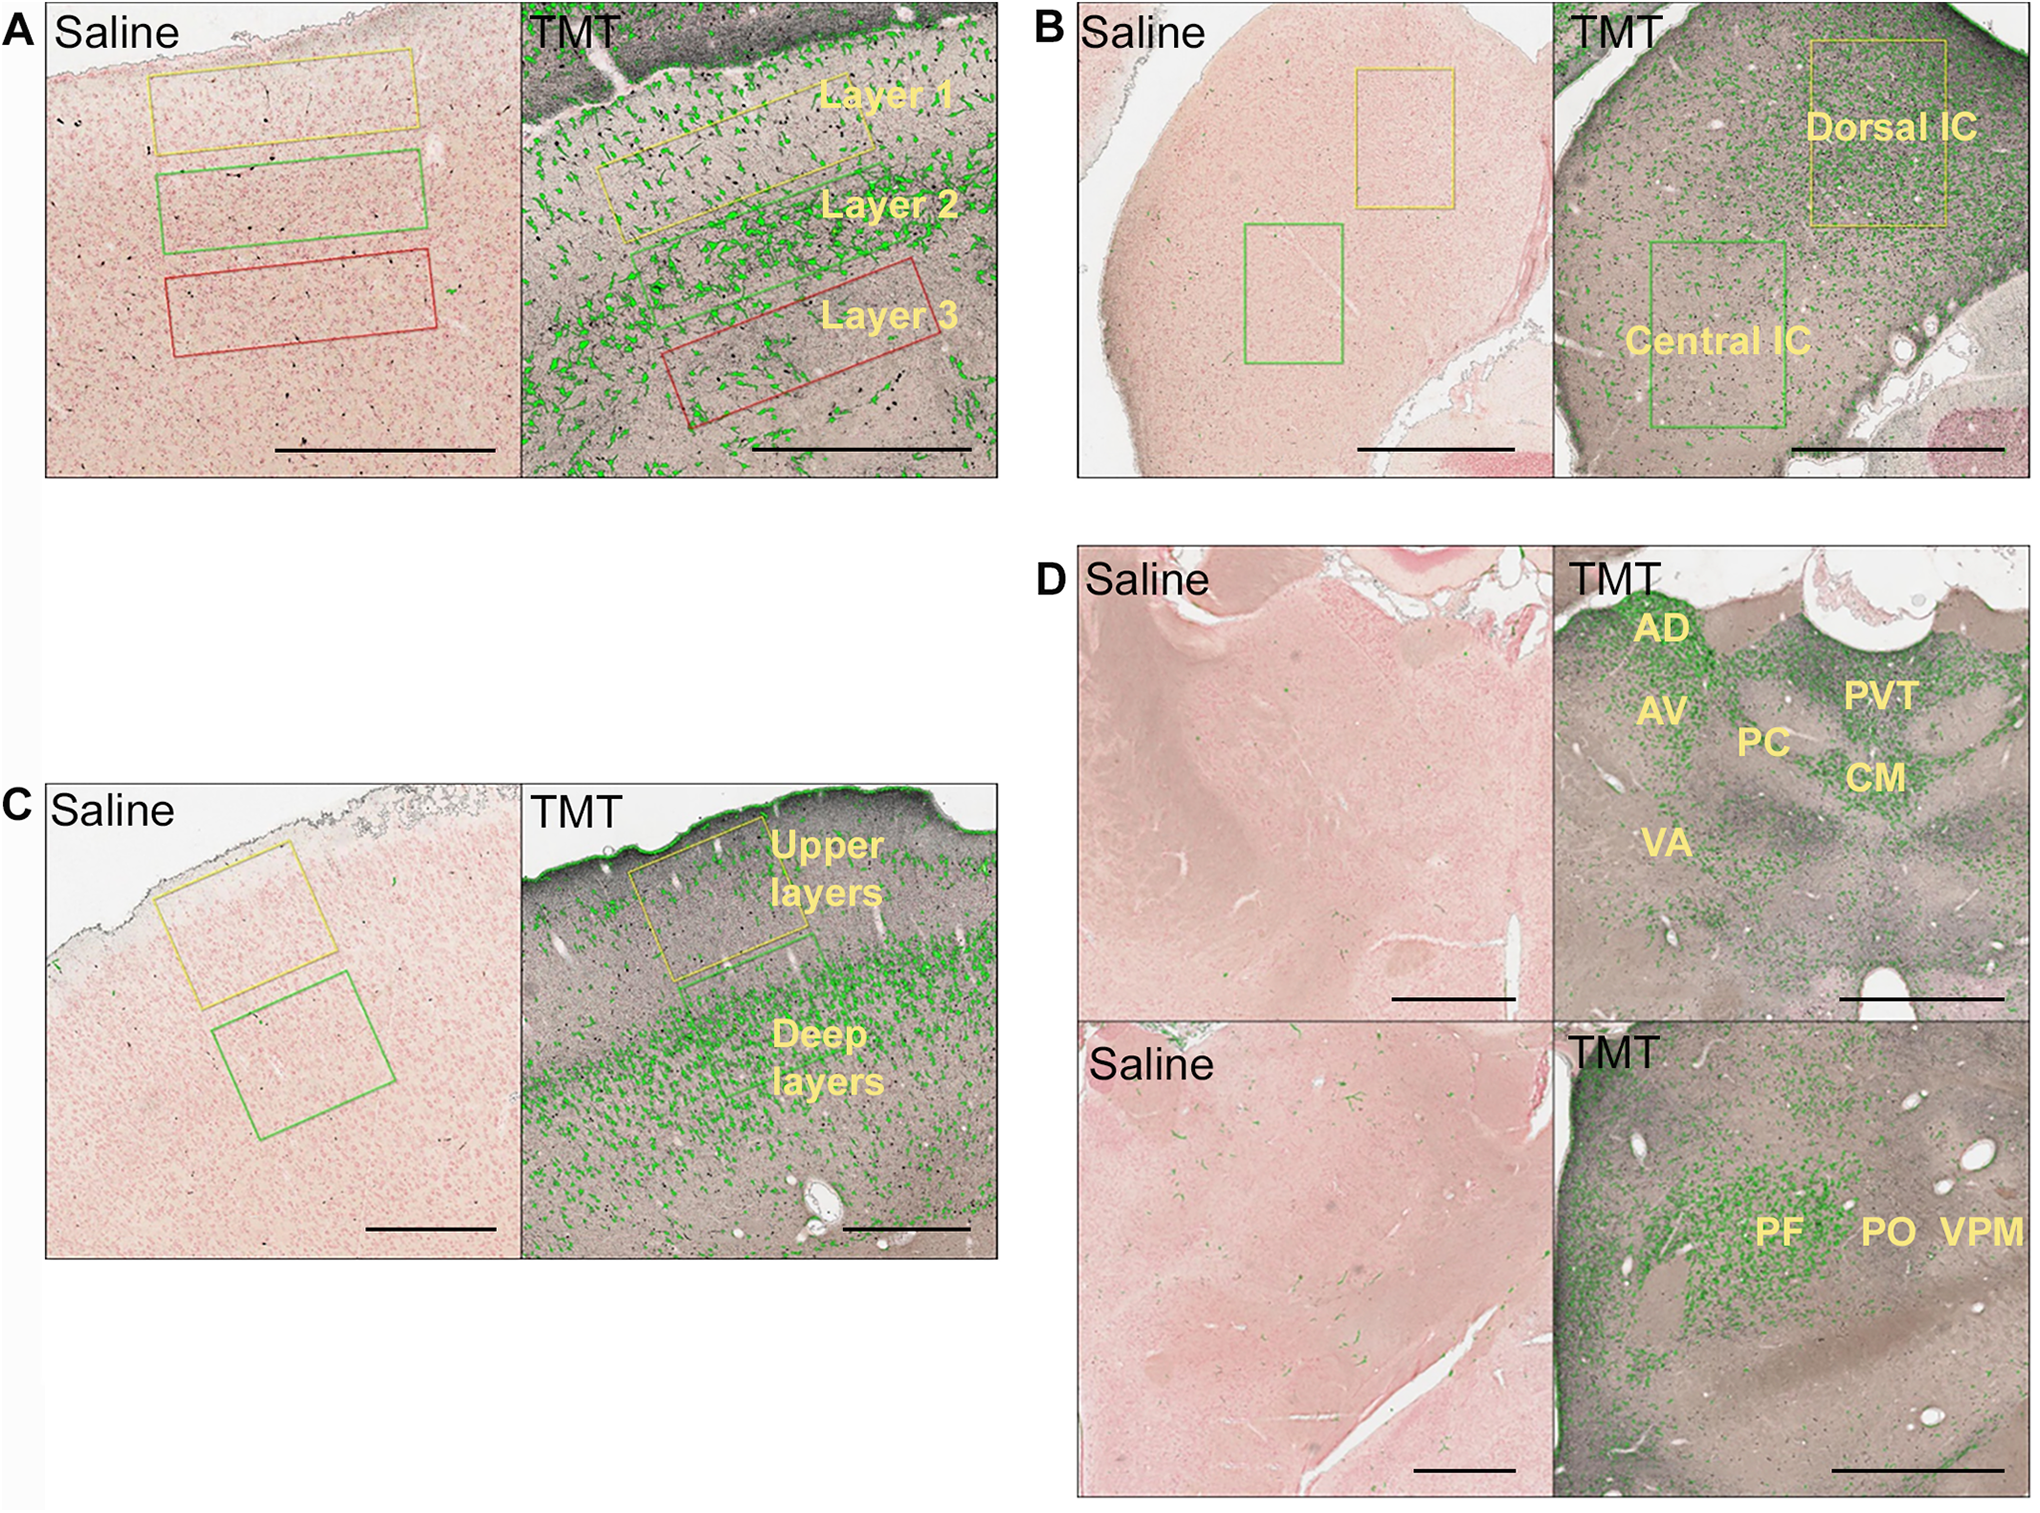
Representative image showing quantification of neuronal damage in silver-stained brain sections of TMT-treated rats (dose = 10-12 mg/kg). Degenerating neurons are colored green after labeling based on color thresholding. A, Superior colliculus showing layers 1, 2, and 3. B, Dorsal and central inferior colliculus. C, Upper and deep layers in the cortex. D, Quantification of different thalamic nuclei. Scale bar: 1 mm in B and D; 500 µm in A and C. AD indicates anterodorsal nucleus; AV, anteroventral nucleus; CM, central medial nucleus; PC, paracentral nucleus; PF, parafascicular nucleus; PO, posterior nucleus; PVT, paraventricular nucleus; TMT, trimethyltin; VA, ventral anterior nucleus; VPM, ventral posteromedial nucleus.
The distribution of neuronal damage in TMT-treated rats among anatomical structures is shown in Figure 6. Layer 2 in the superior colliculus showed significantly more degeneration compared to layers 1 and 2 (Figure 6A, Table 1). The dorsal inferior colliculus showed significantly more degeneration compared to the central inferior colliculus (Figure 6B, Table 1). Upper and deep cortical layers showed different degeneration patterns with the deep layers being more affected (Figure 6C, Table 1). Significantly more degeneration was observed in the intralaminar and midline thalamic nuclei such as the paraventricular nucleus (PVT), central medial nucleus (CM), paracentral nucleus (PC), parafascicular nucleus (PF), anterodorsal (AD), and anteroventral (AV) nucleus (Figure 6D) compared to the ventral posterior nucleus (VPM), posterior nucleus (PO), and ventral anterior (VA) nucleus (Figure 6D, Table 1).
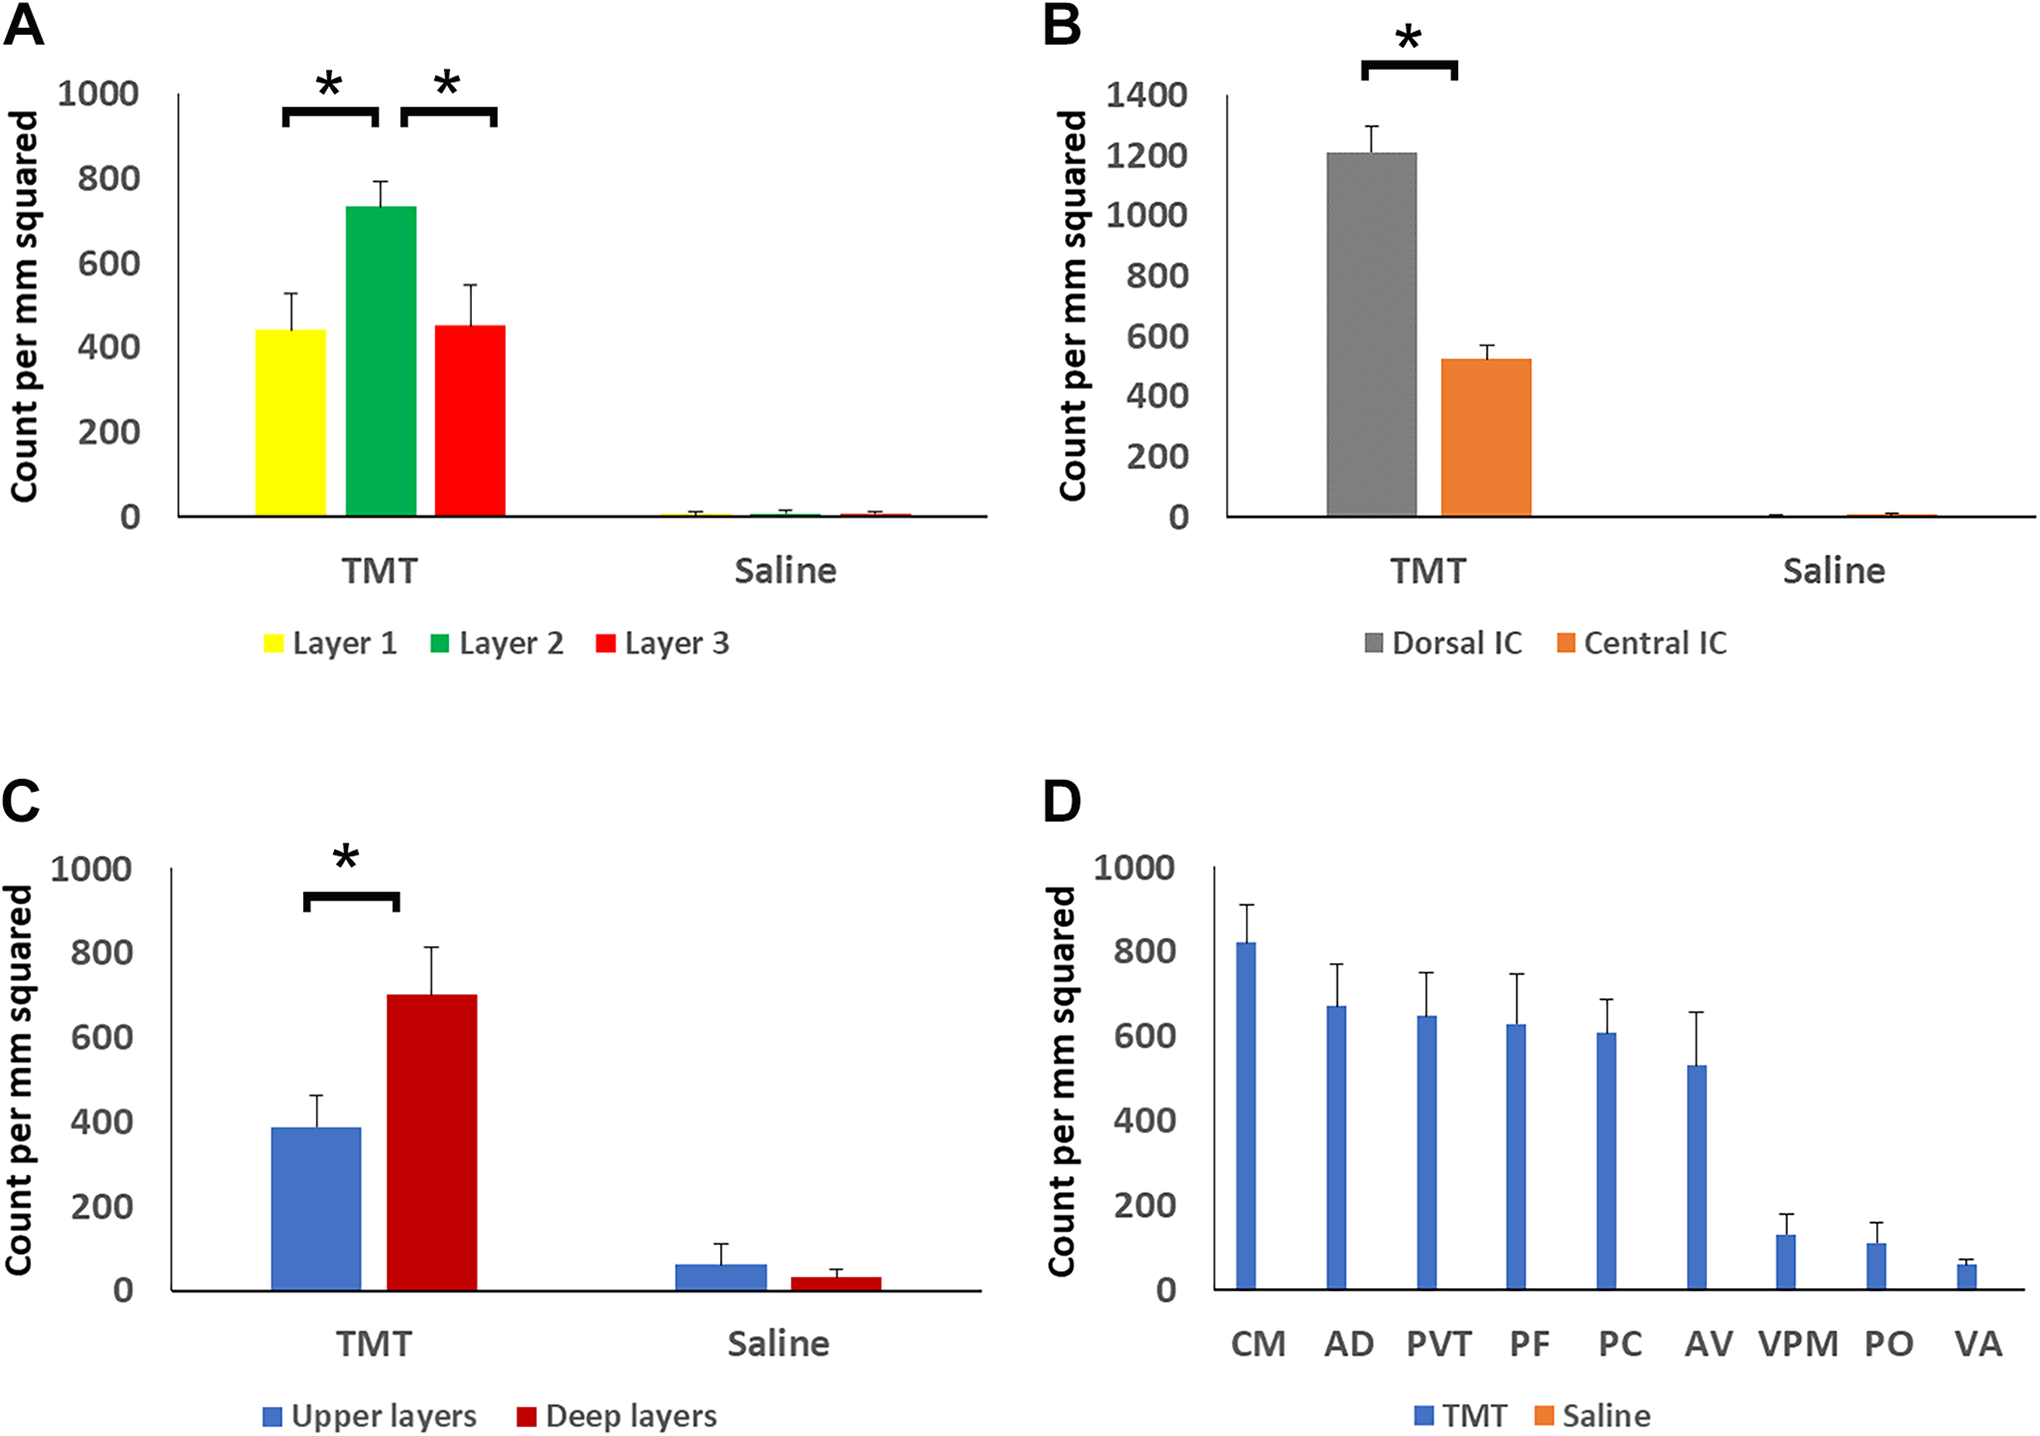
Quantitative analysis of neuronal damage in silver-stained brain sections of TMT-treated rats (dose = 10-12 mg/kg) in different anatomical structures. A, Layer 2 of the superior colliculus exhibited significantly more degeneration than layers 1 or 3. B, The dorsal inferior colliculus showed significantly more degeneration than the central inferior colliculus. C, Deep layers of the cortex were significantly more damaged compared to the upper layers. D, Quantification of different thalamic nuclei showing degeneration of intralaminar and midline nuclei. Error bars reflect standard error and significance was set at P < 0.05. AD indicates anterodorsal nucleus; AV, anteroventral nucleus; CM, central medial nucleus; PC, paracentral nucleus; PF, parafascicular nucleus; PO, posterior nucleus; PVT, paraventricular nucleus; TMT, trimethyltin; VA, ventral anterior nucleus; VPM, ventral posteromedial nucleus.
Discussion
The present study demonstrates extensive neurotoxicity in rats treated with TMT. Qualitatively, extensive degeneration was observed in various brain areas, including the olfactory region, hippocampus, amygdala, and cortex as was shown in earlier studies.10,24 Differential degeneration was apparent within structures such as the cortex, superior colliculus, inferior colliculus, and thalamus. Thus, quantification of toxicity within these regions was performed to provide more insight into the degeneration pattern and network vulnerability.
Laminar Differences in Cortex
The current study described differences in the severity of neurodegeneration in different layers of the cortex, and the quantitative results (Figures 5 and 6) demonstrate greater degeneration in deeper layers such as 5/6 compared to more superficial layers. A similar pattern of degeneration was reported by Balaban et al 10 in a qualitative study. Those authors attributed this layered pattern of degeneration—especially in the somatosensory cortex—to degeneration taking place at the VPL and VPM nucleus level of the thalamus. In the current study, the VPM and VPL were not as severely degenerated as other thalamic nuclei. Our quantification results also demonstrated less degeneration in the VPM compared to other nuclei such as AD, AV, PF, CM, and PC. Thus, it is difficult to comment on the role of the VPL and VPM in TMT treatment-induced laminar differences seen in the cortex.
Olfactory Region
The olfactory region is very important in characterizing TMT toxicity because a very clear distinction can be made between degenerated neurons in the mitral cell layer and anterior thalamus. The mitral cell layer has extensive synaptic endings in the glomerular cell layer, and these endings were observed to be degenerated in TMT-treated animals. Mitral cells and cells in the anterior olfactory nucleus consist of neurons with more extensive dendritic trees and synaptic connections which may increase their vulnerability to TMT.
Intralaminar and Midline Thalamic Nuclei
Our qualitative (Figure 4) and quantitative results (Figures 5 and 6) suggest that midline thalamic nuclei—specifically the PVT and intralaminar nuclei, which include the CM, CL, PCN, and PF—all showed extensive damage. The intralaminar nuclei show projections into layers 5 and 6 of all cortical areas. 25 The PVT of the midline thalamus receives inputs from layer 6 of the cortex. 26 Other thalamic nuclei such as the VM, PO, VPM, and VPL showed much less or were spared from TMT toxicity. This suggests that TMT selectively affects specific thalamic nuclei as well as regions where their projections reach.
Differences in Dorsal and Central Inferior Colliculus
Qualitative (Figure 4) and quantitative results (Figures 5 and 6) suggest toxicity differences in the dorsal cortex and the central nucleus of the inferior colliculus. The dorsal cortex shows extensive degeneration compared to the central nucleus. The dorsal cortex contains 3 layers consisting primarily of small- and medium-sized neurons and not only receives ascending inputs but also descending projections. It is influenced by descending projections from layers 5/6 of the cortex.27-31 The dorsal cortex also receives ascending inputs. Inputs from the thalamus are mainly GABAergic. Distribution of calbindin and calretinin has been found to be more localized in the dorsal and external inferior colliculi.31-34 There is considerable heterogeneity of neuronal shapes in the dorsal cortex. The dorsal and external inferior colliculus contains 20% to 25% GABAergic neurons. 35 Large GABAergic neurons in the inferior colliculus project to the superior colliculus and medial geniculate body in the thalamus36-39; these areas were selectively affected by TMT (Figure 7A). Large GABAergic neurons in the dorsal inferior colliculus were found to have lower membrane resistance. 40 Since the inferior colliculus–medial geniculate pathway was significantly affected by TMT, these large GABAergic neurons may be affected more by TMT, but further studies are required to confirm this observation.
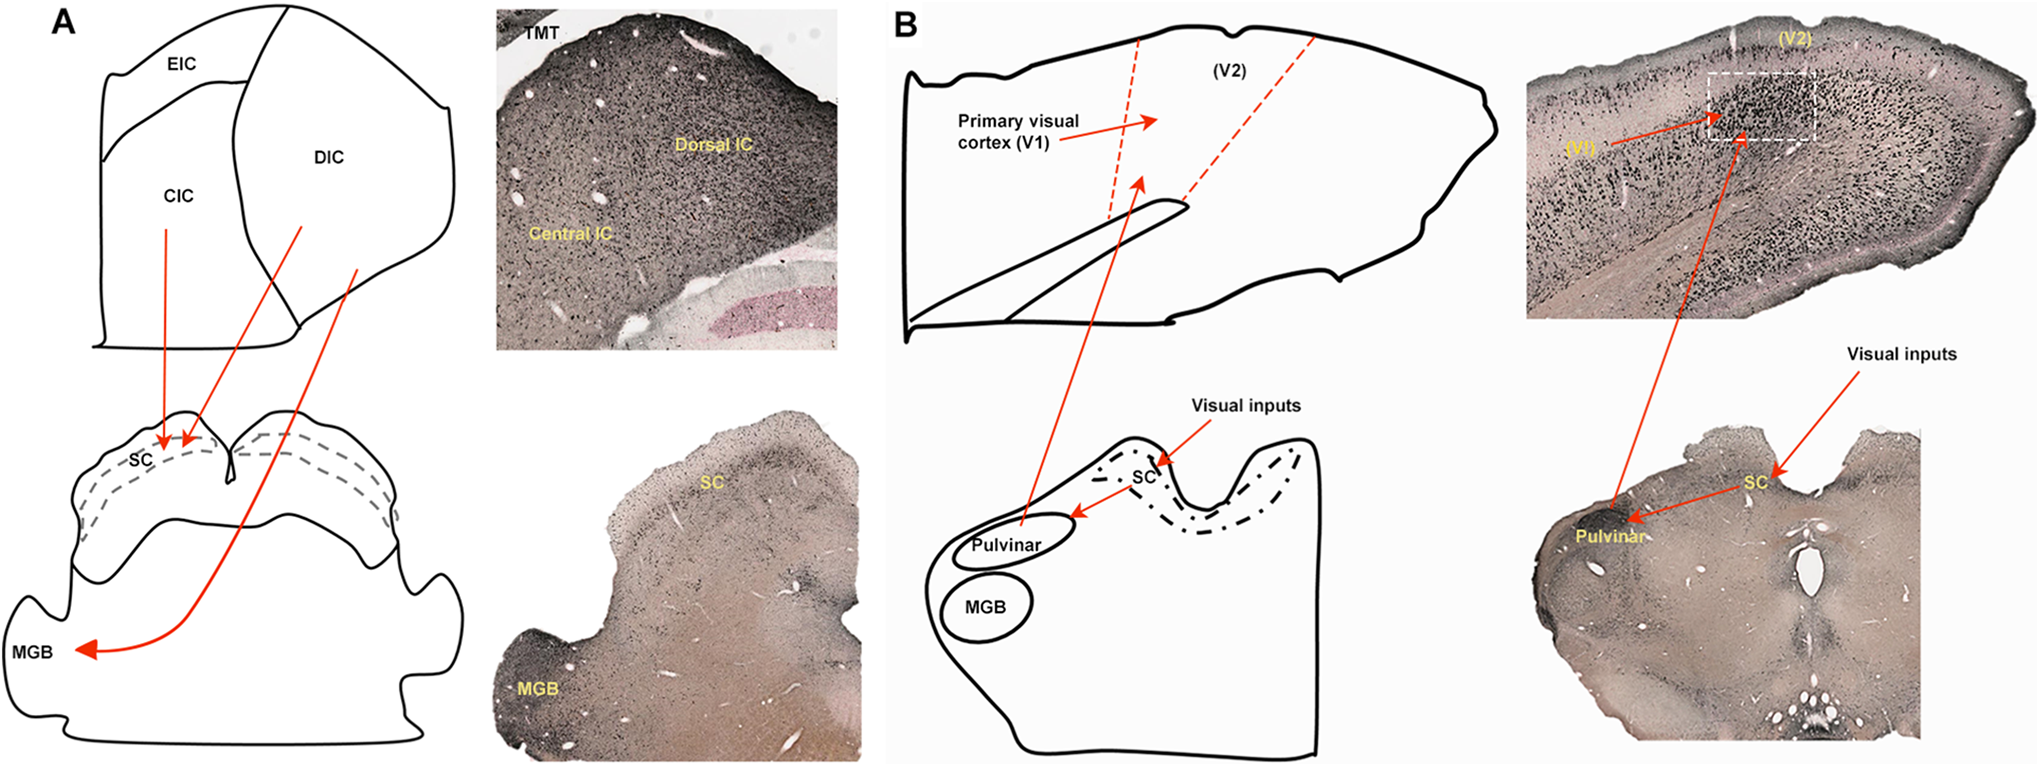
A, Descending projections (red arrows) from the inferior colliculus to the SC and MGB. B, Extrageniculate system affected by TMT (dose = 10-12 mg/kg). CIC indicates central inferior colliculus; DIC, Dorsal inferior colliculus; EIC, exterior inferior colliculus; MGB, medial geniculate body; SC, superior colliculus; TMT, trimethyltin; V2, secondary visual cortex.
Extrageniculate System Degeneration
The findings of the present study suggest selective TMT-induced degeneration in an extrageniculate system. In this extrageniculate system, visual inputs from the eye reach the superior colliculus which sends projections to the pulvinar. The pulvinar contains GABAergic neurons, and these pulvinar neurons have extensive widely distributed dendritic arborizations.41,42 The pulvinar projects to the secondary visual cortex which also receives inputs from the primary visual cortex. Trimethyltin-treated rats show degeneration in the pulvinar and visual cortices (Figure 7B). Interestingly, the pattern of degeneration is different in the primary and secondary visual cortex; the secondary visual cortex shows more degeneration.
Our quantitative results (Figures 5 and 6) show that there was a greater degeneration in the optic layer (layer 2) of the superior colliculus compared to layer 1 and layer 3. The optic layer has been reported to contain GABAergic neurons at high density, 43 which also express calbindin. 44 This layer is part of the extrageniculate system 45 ; degeneration of this layer and the distinct degeneration of the pulvinar supports our observation of selective TMT-induced degeneration of the extrageniculate system.
Cerebellum, Pons, and Mammillary Body
Within the cerebellum, the selective degeneration of Purkinje cells is interesting. Purkinje cells are GABAergic projection neurons, 46 which have extensive dendritic arborizations with extensive spines on all aspects of the dendrites. Purkinje cells are the only output cell type in the cerebellum; they send out inhibitory signals. Purkinje cells express the calcium-binding protein calbindin, 47 and thus, this characteristic may be relevant to the specific vulnerability of these cells to TMT toxicity. The cerebellum is connected to the cerebrum through the pons and mammillary body, 48 which connects with the pons and anterior thalamic areas.48,49 In this study, these areas show extensive degeneration suggesting that connected areas can also be damaged.
Cortico-Ponto-Cerebellar Circuit
Layer 5 of the cortex has projections that reach the cerebellum via the pontine nuclei. Findings presented here demonstrate TMT toxicity in cortical layers 5/6, pontine nuclei, and cerebellar Purkinje cells (Figure 8). This projection system (cerebro-pontine-cerebellar) seems to be specifically affected by TMT toxicity. Our results indicated that intralaminar and midline thalamic nuclei were the main areas which integrate with this projection system, and other thalamic nuclei were spared or minimally involved.
Of the brain areas most affected by TMT toxicity, the cerebro-ponto-cerebellar pathway (Figure 9) appears to be the most vulnerable neuronal network. Brain areas connected to the main nodes of this circuitry were also severely damaged by TMT.
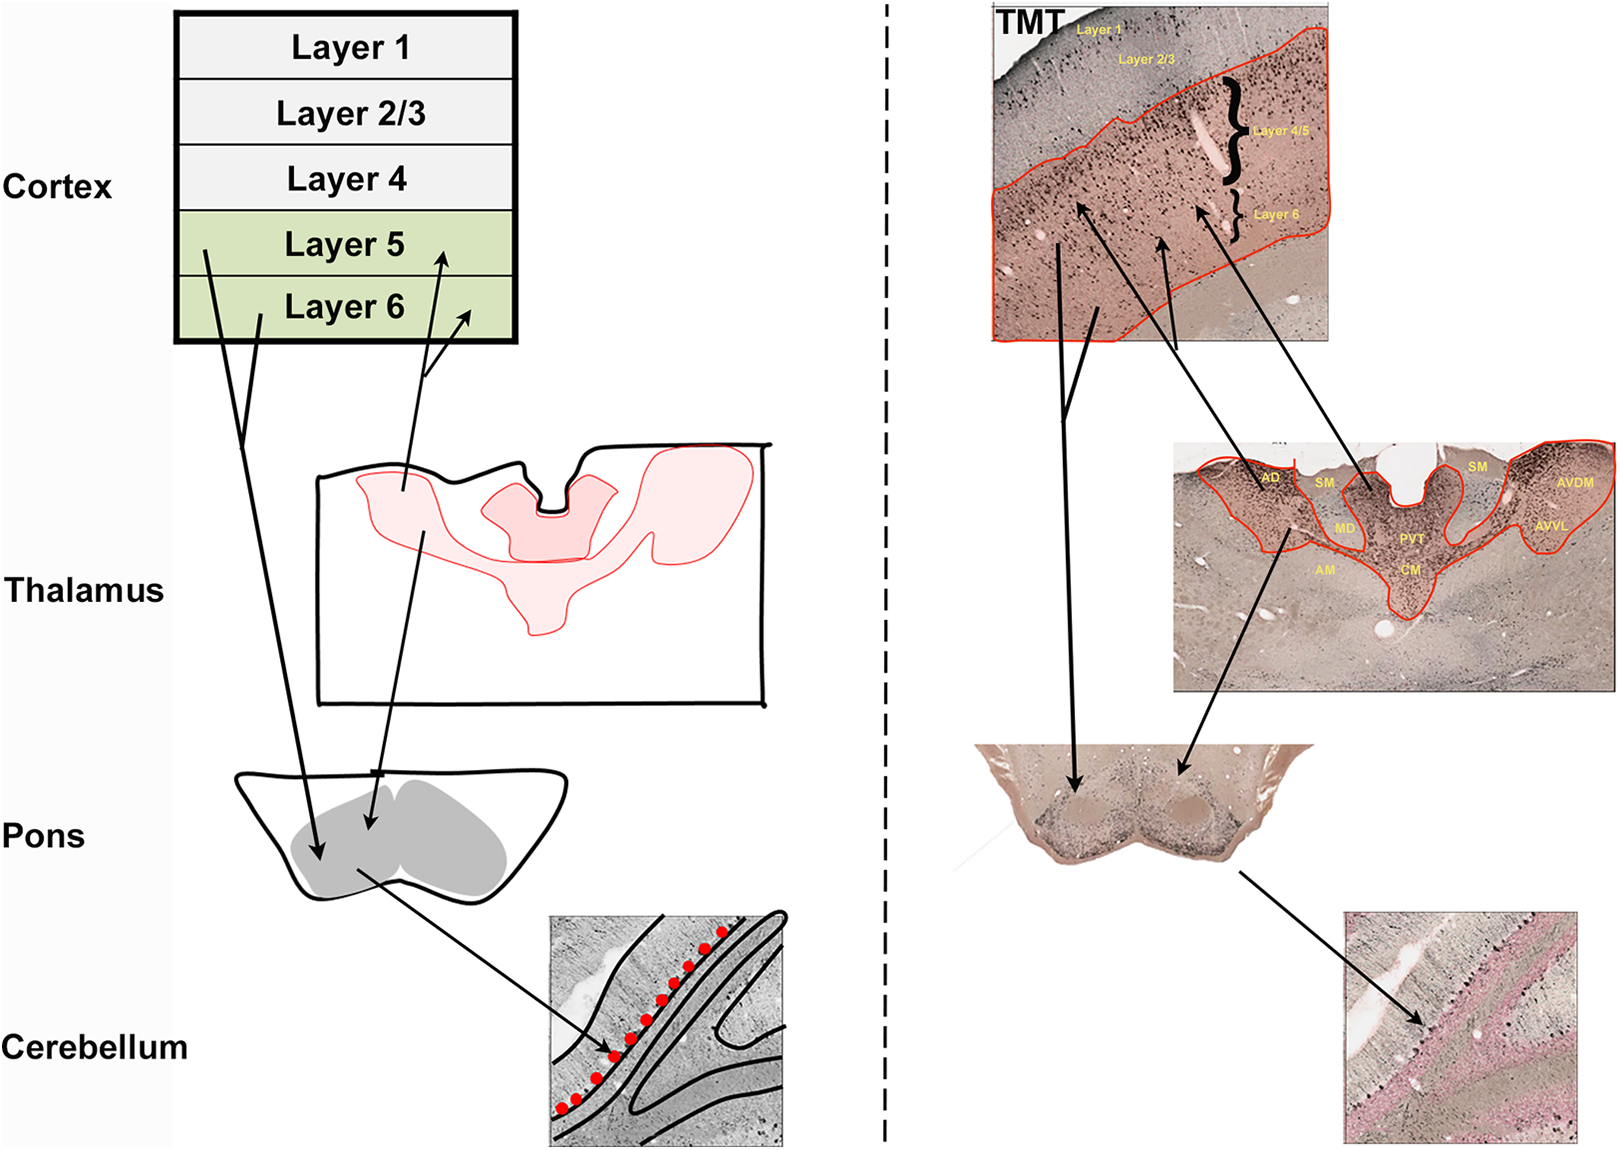
Cerebro-pontine-cerebellar system affected by TMT toxicity (dose = 10-12 mg/kg). Left panel show schematic representation of the connections (black arrows) between cortex, thalamus, pons, and cerebellum. Right panel show toxicity in cortex, thalamus, pons, and cerebellum in TMT-treated rat brain. TMT indicates trimethyltin.
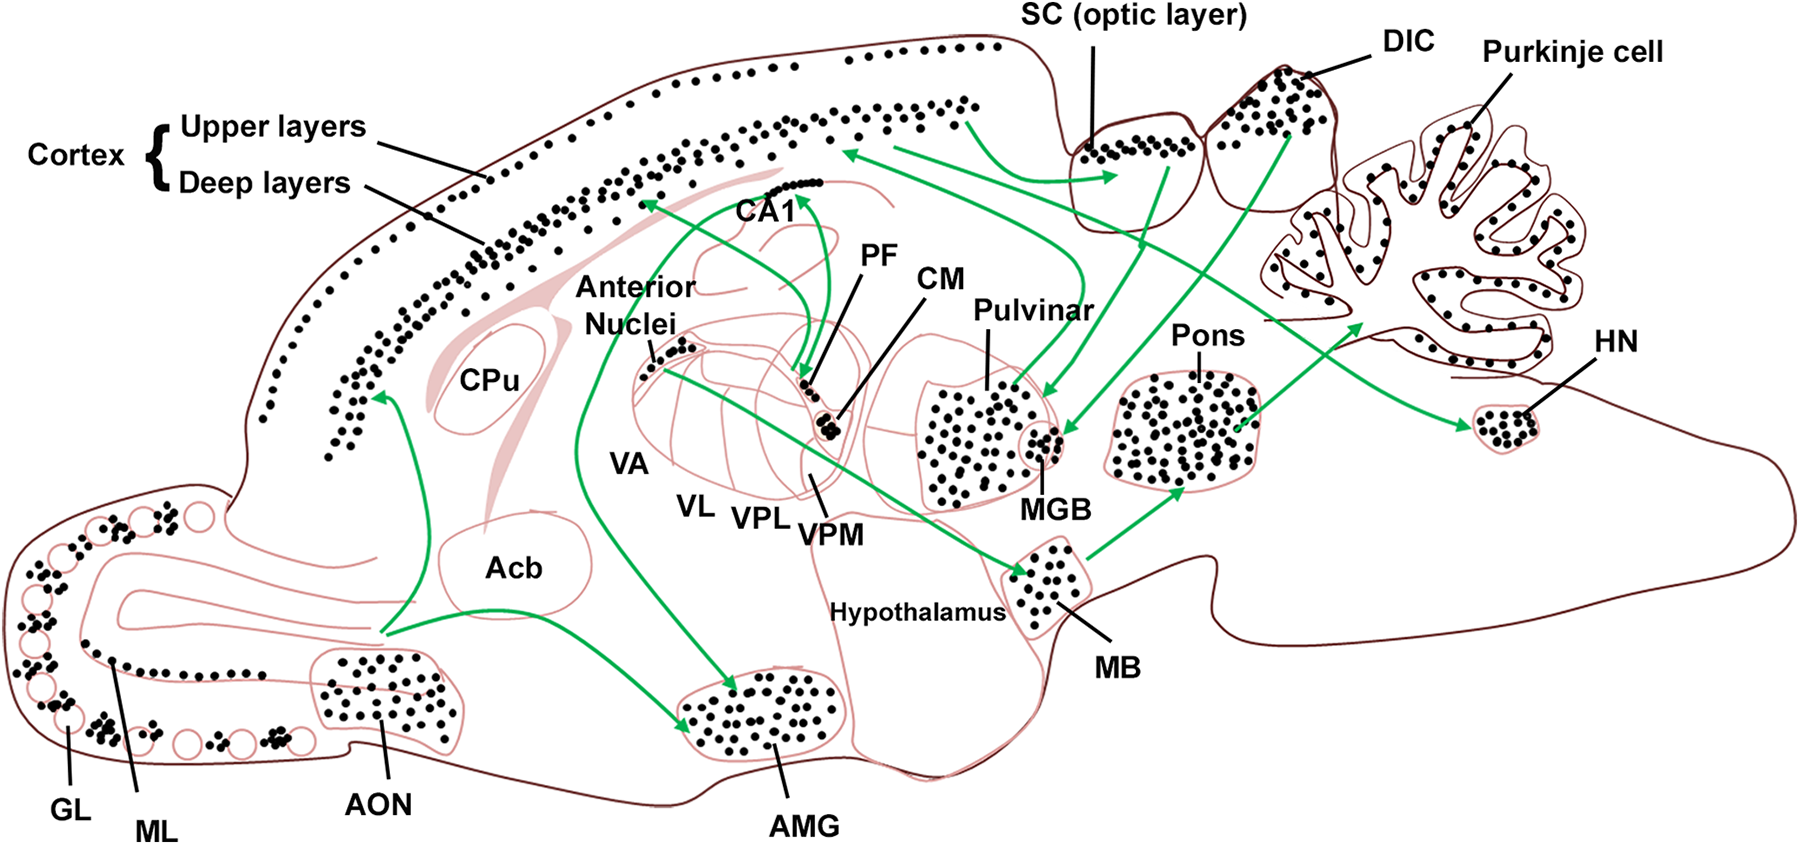
Schematic representation of the rat brain depicting regions severely affected by TMT toxicity (dose = 10-12 mg/kg). Green arrows show connections between different areas in the brain. Black dotted regions show areas which were severely affected by TMT toxicity. Acb indicates nucleus accumbens; AMG, amygdala; AON, anterior olfactory nucleus; CM, central medial nucleus; CPu, caudate putamen; DIC, dorsal inferior colliculus; GL, glomerular layer; HN, hypoglossal nucleus; MGB, medial geniculate body; PF, parafascicular nucleus; SC, superior colliculus; TMT, trimethyltin; VA, ventral anterior nucleus; VL, ventral lateral nucleus; VPL, ventral posterolateral nucleus; VPM, ventral posteromedial nucleus.
Relevance of Neuronal Types/Neuronal Physiological Properties/Neurotransmitters in TMT Toxicity
Are one or more specific neuron characteristics (size, shape, transmitter, or receptor type), brain circuitry, or a combination of these features key contributor(s) for cell susceptibility to TMT-induced neurotoxicity? Purkinje cells 46 and the pontine nucleus 50 both contain GABAergic neurons. Mitral cells are under inhibitory control, 51 the claustrum exerts an inhibitory role on the cortex, 52 and the dorsal inferior colliculus has GABAergic projections to the SC and MGB.35,36 These areas are severely affected by TMT. Large GABAergic inhibitory currents have been reported in pyramidal cells in the hippocampus, 53 and a very distinctive feature of TMT toxicity is the degeneration of pyramidal cells in the hippocampus. 19 Our current findings suggest that TMT is more toxic to projection neurons—mainly pyramidal neurons that have extensive dendritic arborizations and spines. Such neurons are extensively branched (ie, have large receptive fields), exhibiting apical dendrites with large numbers of spines and a single axon. Spiny neurons seem unaffected by TMT. Layers 5/6 of the cortex, the mitral cell layer, anterior olfactory, and neurons in the claustrum contain pyramidal neurons and are affected by TMT. Purkinje cells are also large neurons with extensive spiny dendrites. Pyramidal neurons with such extensive dendritic projections appear to be very sensitive to TMT; thus, this characteristic could be one of the factors contributing to layer susceptibility to TMT toxicity. Regions that are rich in pyramidal neurons appear to be more sensitive and vulnerable to TMT than regions that do not contain large numbers of pyramidal neurons. Neurons expressing the calcium-binding protein calbindin may also be highly sensitive to TMT. It has been reported that hippocampal neurons containing calbindin are selectively degenerated by TMT.54,55 The expression of calbindin is known to occur in Purkinje cells,56,57 the dorsal inferior colliculus, 58 layers 2/3 and 5/6 in the cortex, 59 superior colliculus,44,60 and claustrum. 61 Most of these structures showed extensive damage in this study suggesting that neurons expressing calbindin are specifically susceptible to TMT toxicity.
Here, quantification of neurotoxicity was measured using a digital pathology approach which has some limitations. Although this approach reduces bias and increases accuracy when compared to manual counting of degenerated neurons, it is very time-consuming and thus limits the number of observations per treatment group. This could lead to subsampling of histological images and to variation. This approach does not provide 3-dimensional information because the counting of the degenerated neurons is performed on a 2-dimensional representation of the neurons. Because this approach is based on parameters such as stain color, optical density, and object size, the possibility of artifacts such as degenerated neurites being counted may add to total estimates of the toxicity. We also observed some minor differences in the pattern of toxicity after TMT treatment as compared to some of the previous studies,10,62-66 which could be because of slight differences in the TMT dosages given to animals in those studies.
Conclusion
Our results indicate extensive and widespread damage to the rat brain after systemic administration of TMT. Several brain areas were found to be severely affected, and variability was observed between animals receiving similar doses of TMT. Various brain regions showed different patterns of TMT-induced toxicity. The present findings suggest that TMT affects the cerebro-ponto-cerebellar pathway in the brain, indicating network vulnerability in this pathway. A specific extrageniculate pathway was also affected by TMT. Projection pyramidal neurons with extensive dendritic arborizations and spines with inhibitory influence which also express that the calcium-binding protein calbindin appears to be highly vulnerable to TMT toxicity. However, further studies are needed to confirm this hypothesis.
Footnotes
Authors’ Note
The information in these materials is not a formal dissemination of information by FDA and does not represent Agency position or policy.
Author Contribution
Srivastava, A. contributed to conception and design, contributed to acquisition, drafted manuscript, and critically revised manuscript. Liachenko, S. contributed to design, contributed to acquisition, analysis, and interpretation and critically revised manuscript. Sarkar, S. contributed to acquisition and critically revised manuscript. Paule, M. contributed to design and critically revised manuscript. Sadovova, N. contributed to acquisition and critically revised manuscript. Hanig, J.P. contributed to conception and design; acquisition, analysis, and interpretation; drafted manuscript; and critically revised manuscript. All authors gave final approval and agree to be accountable for all aspects of work ensuring integrity and accuracy.
Declaration of Conflicting Interests
The author(s) declared no potential conflicts of interest with respect to the research, authorship, and/or publication of this article.
Funding
The author(s) disclosed receipt of the following financial support for the research, authorship, and/or publication of this article: FDA—Center for Drug Evaluation & Research (CDER) Critical Path Program, CDER Office of Testing & Research, and National Center for Toxicological Research/FDA. This work was supported by the National Center for Toxicological Research (NCTR) and Center for Drug Evaluation and Research (CDER) of the U.S. Food and Drug Administration (FDA), NCTR protocol E0741801.