
Abstract
As regulators of homeostasis, astrocytes undergo morphological changes after injury to limit the insult in central nervous system (CNS). Trimethyltin (TMT) is a known neurotoxicant that induces reactive astrogliosis in rat CNS. To evaluate the degree of reactive astrogliosis, the assessment relies on manual counting or semiquantitative scoring. We hypothesized that deep learning algorithm could be used to identify the grade of reactive astrogliosis in immunoperoxidase-stained sections in a quantitative manner. The astrocyte algorithm was created using a commercial supervised deep learning platform and the used training set consisted of 940 astrocytes manually annotated from hippocampus and cortex. Glial fibrillary acidic protein-labeled brain sections of rat TMT model were analyzed for astrocytes with the trained algorithm. Algorithm was able to count the number of individual cells, cell areas, and circumferences. The astrocyte algorithm identified astrocytes with varying sizes from immunostained sections with high confidence. Algorithm analysis data revealed a novel morphometric marker based on cell area and circumference. This marker correlated with the time-dependent progression of the neurotoxic profile of TMT. This study highlights the potential of using novel deep learning-based image analysis tools in neurotoxicity and pharmacology studies.
Keywords
Introduction
Astrocytes are star-shaped glial cells in the brain and spinal cord. 1 There are around 40 to 50 billion glial cells in the human brain, of which astrocytes constitute 20% to 40%, 1 depending on the region. Astrocytes react to neuronal insults by changing to a reactive form, a response known as reactive astrogliosis or reactive astrocytosis.2,3 This reaction is delineated morphologically as increased branching and hypertrophy of astrocyte bodies, which is best visualized by immunohistochemistry (IHC).
Reactive astrogliosis is a distinctive feature in several neurodegenerative disorders, such as in Huntington’s and Parkinson’s diseases, as well in various brain pathologies, namely, traumatic brain injury, epilepsy, and stroke.4-6
With the expanding knowledge of the neurodegenerative diseases, diagnostic demands have increased over the recent years. This reflects as an increased workflow for pathologists due to mounting number of analyses and new staining methods to be evaluated. 7 As the pathological review is done by independent individuals, it is prone to human errors, creating interobserver and intraobserver bias to the results,4,8 Therefore, there is a great need for highly reproducible quantitative histopathological data analysis method, that could also be used for statistical analysis.8,9
In the past, different machine learning programs have been used for cell quantification. However, for identification of complex features, such as for the morphology of astrocytes, the accuracy in detection has been limited due to their heterogeneous shape and size.4,10,11 The common method to acquire the number of astrocytes on a histology slide, is by using an optical fractionator,12,13 but this method requires additional equipment and software. As only small areas are manually counted, rather than whole tissue section, the result is depending on estimations.
For advanced morphological determination of astrocytes, the cells can be tagged with immunofluorescent labels. Immunofluorescent signal is then recorded and analyzed with different softwares and scripts.14-16 However, immunofluorescent labeling has several practical disadvantages, such as different tissue processing techniques, need for specific equipment and bleaching. There is a need for an analysis method based on routine stained samples that would take into account the color and contrast gradients, quantity, and morphological features of desired subject.
Immunoperoxidase staining has inherited variability that causes color and intensity variation and unspecific immunoperoxidase labeling. These factors limit the use of conventional image analysis tools that convert signals in the image to binary data, creating inaccurate results. 17
To overcome the above challenges, the rapidly developing deep learning algorithms are promising solutions. Optimally, the strengths of deep learning are the elimination of human error, increased reproducibility, and speeding up the analysis to a fraction of the time compared to analysis produced by trained pathologist. 18 Deep learning algorithm consists of multiple interlaced layers, each having its own individual function, and thus, algorithms can efficiently and diversely detect shapes, colors, and patterns from supplied data. 19 Previous reported astrocyte segmentation tools, to our knowledge, are unable to produce histomorphometric data of the individual astrocytes.4,14,20
In the current study, we present an algorithm for the quantification and morphometric analysis of glial fibrillary acidic protein (GFAP) immunolabelled astrocytes in brain tissue sections from rats with trimethyltin (TMT)-induced neurotoxicity. For algorithm creation, Aiforia (Aiforia Technologies, Helsinki, Finland), a cloud-based supervised deep learning platform was used. The astrocyte algorithm was trained using rat, mouse and dog, and further confirmed using rat brain samples. The accuracy of the algorithm was evaluated and compared to pathologist assessment.
Materials and Methods
Trimethyltin hydrochloride-induced neurotoxic brain injury female Wistar Hannover rats, aged 9 months, were obtained from Harlan Netherlands B.V.. Rats were maintained in the animal facility in open cages at 22°C ± 3°C, 55% ± 15% humidity, with a 12-hour light-dark cycle, fed a standard rodent diet (Altromin 1324P, Feedcon Oy, Helsinki, Finland), and supplied with tap water ad libitum. Rats were habituated to cages in dose groups and were acclimated for 8 days. To induce neurotoxicity, rats were given a single intraperitoneal injection of TMT hydrochloride (7 mg/kg) (Cas 56-24-6, Avantor, Helsinki, Finland). The dose level was selected based on previous studies where neurotoxicity was shown.21,22 Rats were sacrificed at 4, 6, and 8 days postdosing (n = 6, 10, 10) to follow the advancing toxic injury. Control rats (n = 5) received a similar volume of vehicle (0.9% NaCl) intraperitoneally and were sacrificed 8 days postdosing. Experiments were conducted in conformity with the Finnish regulations and the Directive 2010/63/EU of the European Parliament on the protection of animals used for scientific purposes. Animal experiments and the protocols were approved by the National Animal Experiment Board of Finland (ELLA, license no. ESAVI/299/0.4.10.07/2016).
Tissue Preparation and Histology
Animals were sacrificed under isoflurane anesthesia. The skull was removed dorsally from foramen magnum until frontal bone and the brain was removed in toto. A coronal section of the brain from the right hemisphere at the level of hippocampus was selected for further processing (Supplemental Figure S1A). The tissue samples were fixed in 10% neutral-buffered formalin solution for 5 days. The formalin-fixed samples were then embedded in paraffin and were sectioned at 4 µm in thickness and stained with hematoxylin and eosin (H&E) for morphological examination.
Immunohistochemistry
Four micrometer thick sections (2/slide) were obtained from the formalin-fixed paraffin blocks of each sample. Slides were deparaffinized, rehydrated in an alcohol series, and rinsed in distilled water. Heat-induced antigen retrieval was performed using a 10 mM citrate buffer (pH 6) for 20 minutes at 99°C. Endogenous peroxidase was blocked by immersion in 3% hydrogen peroxide for 10 minutes, and protein blockage was performed using phosphate-buffered saline with 10% bovine serum albumin. Primary antibovine GFAP rabbit polyclonal antibody (1:10,000, Cat# Z0334, Agilent, Santa Clara, California, USA), previously extensively used for labeling of rodent and canine tissues,23-26 was incubated at room temperature for 60 minutes. Secondary antibody polymer HRP (goat antirabbit/mouse immunoglobulin E (IgE), Cat# K5007, Agilent, Santa Clara, California, USA) was incubated for 30 minutes at room temperature. The immunoreaction was visualized with the liquid DAB+ substrate (Cat# K5007, Agilent, Santa Clara, California, USA) and counterstained with Harris hematoxylin. Training and analysis data sets were run in two individual batches for GFAP IHC.
Image Acquisition
Digital images of the sections were acquired using 3DHistech Pannoramic Midi automated digital slide scanner with Plan-Apochromatic 40X objective (3DHistech Ltd., Budapest, Hungary). Acquired MRXS files were then compressed and uploaded to the Aiforia with Aiforia Connector.
Algorithm and Software
Glial fibrillary acidic protein immunolabelled slides were used for the development of a deep learning algorithm for astrocyte identification. Aiforia Create platform, provided by Aiforia Technologies Ltd., was selected due to its ability to extract morphometric data from analyses efficiently.
To create the algorithm, a separate data set containing total of 62 GFAP-immunolabelled brain slides were used for annotation and algorithm training. The training data set consisted of 25 rat slides from the TMT study, specifically sectioned and labeled for the training, with additional 31 mouse and 6 beagle dog brain tissue slides, obtained from the tissue archive of the Orion Pharma. Archived tissue samples were preserved as paraffin blocks and were from either pharmacological or toxicological studies (Supplemental Table S1). Additional mouse and dog samples were included to the training data set to improve the accuracy of the algorithm, by having heterogenicity in astrocyte sizes, shade, and level of branching. Archived samples were only used for training, not for validation or analysis. Nine hundred forty generic-shaped astrocytes were manually annotated by following the exact shape of the cell with a surrounding line (Figure 1). To accurately evaluate cellular changes, only astrocytes with visible soma, were included in the annotations. Perivascular areas were commonly positive for GFAP labeling, likely due to astrocytic endfeets surrounding the blood vessel. Varying degree of positive immunolabelling was observed in small fibers and incomplete astrocytes. These positive labels were annotated as negative signals.
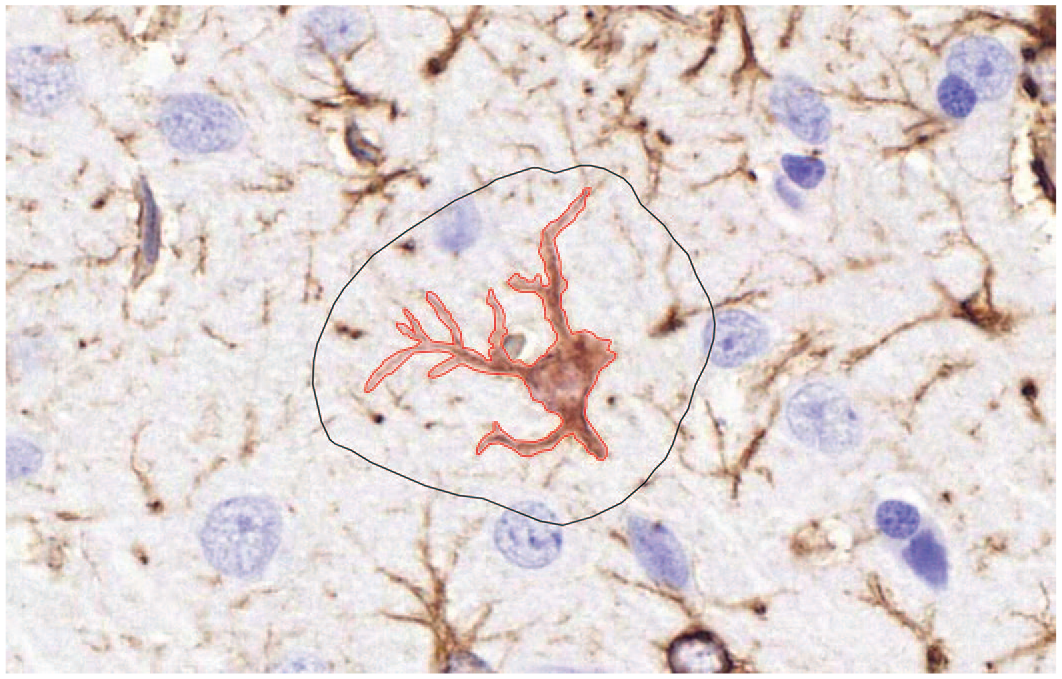
Rat brain, coronal section, GFAP (IHC): Example of an annotation. Black line determinates training area and the red line surrounds a positive signal (astrocyte). Original scan 40X. GFAP indicates glial fibrillary acidic protein; IHC, immunohistochemistry.
Astrocyte annotations of TMT-treated, nontreated, and archived GFAP-labeled brain sections were done by a single trained expert in a nonblinded manner. The algorithm development process is portrayed in Supplemental Figure S2. In the result evaluation phase, ground truth was evaluated and agreed between four experts.
To test the algorithm, from separate analysis data set, hippocampal regions of 31 slides were manually drawn as regions of interest (ROI) (Supplemental Figure S1B). This anatomical location was selected due to its well-defined histoanatomical borders and due to the hippocampal targeting toxic profile of TMT. 27 Selection of the hippocampal ROI ensures that a similar area is always analyzed in each animal (1 ROI/animal). Accuracy of the algorithm was tested by visually inspecting the results of the analyzed slides. Final algorithm was achieved with 15,000 iterations. By default, the deep learning platform produces a broad list of output metrics (Supplemental Data S1 and Figure S3).
Data Filtering and Statistical Analysis
Analyses were imported to RStudio (RStudio, Boston, United States). This algorithm was set to identify and segment the complex cell structure of an astrocyte, focusing on the hallmark of reactive astrogliosis, cellular hypertrophy. Therefore, from analysis, findings with area under 25 µm² were excluded, so that, the data included only intact astrocytes (Supplemental Figure S4). This approach was selected to prevent counting disconnected processes as individual cells, possibly originating from adjacent astrocyte. The threshold value was chosen by visual evaluation of analysis results.
Mean values and 95% confidence intervals were calculated for the area, circumference, and for the ratio of area to circumference of individual cells for each group. Linear mixed model and analysis of variance (ANOVA) model were used for the analysis of the data of control group and treatment days 4-8. Model-based contrasts were estimated between days and the corresponding t-tests were applied in the assessment of statistical significance. To assess the change of the area/circumference-ratio, R² value was calculated.
Results
Verification of TMT Hydrochloride-Induced Neurotoxic Brain Injury
During the inlife phase, a decline in general condition (weight loss, hunched back, and piloerection) and neurological signs (aggressive behavior, going in circles, pushing wood chips, and paraparesis) were observed. Due to weight decrease and several wounds and injuries, 5 animals were terminated for reaching humane endpoint. From the 6 days postdosing group, 1 animal was sacrificed at day 4 and two at day 6 prior the scheduled necropsy. From the 8 days postdosing group, 1 animal was sacrificed at day 4 and one at day 6. These animals were not included to the dataset.
On histopathological examination of the H&E-stained brain sections, an advancing neuronal degeneration was observed. Trimethyltin-induced neurotoxicity was characterized by marked acute multifocal neuronal degeneration/necrosis, resulting in extensive cell loss, localized to auditory cortex and hippocampus. In auditory cortex, the neuronal degeneration was restricted to pyramidal neurons, extending diffusely through the auditory cortex. In hippocampus, the Ammon’s horn CA1 pyramidal neurons were the most severely affected (Figure 2), with only few scattered degenerative neurons in CA2 and in the dentate gyrus. In all neuroanatomical locations, the soma of the affected neurons was severely shrunken and the cytoplasm condensed and hypereosinophilic. The morphology of the nucleus ranged from severe pyknosis to karyorrhexis and karyolysis.
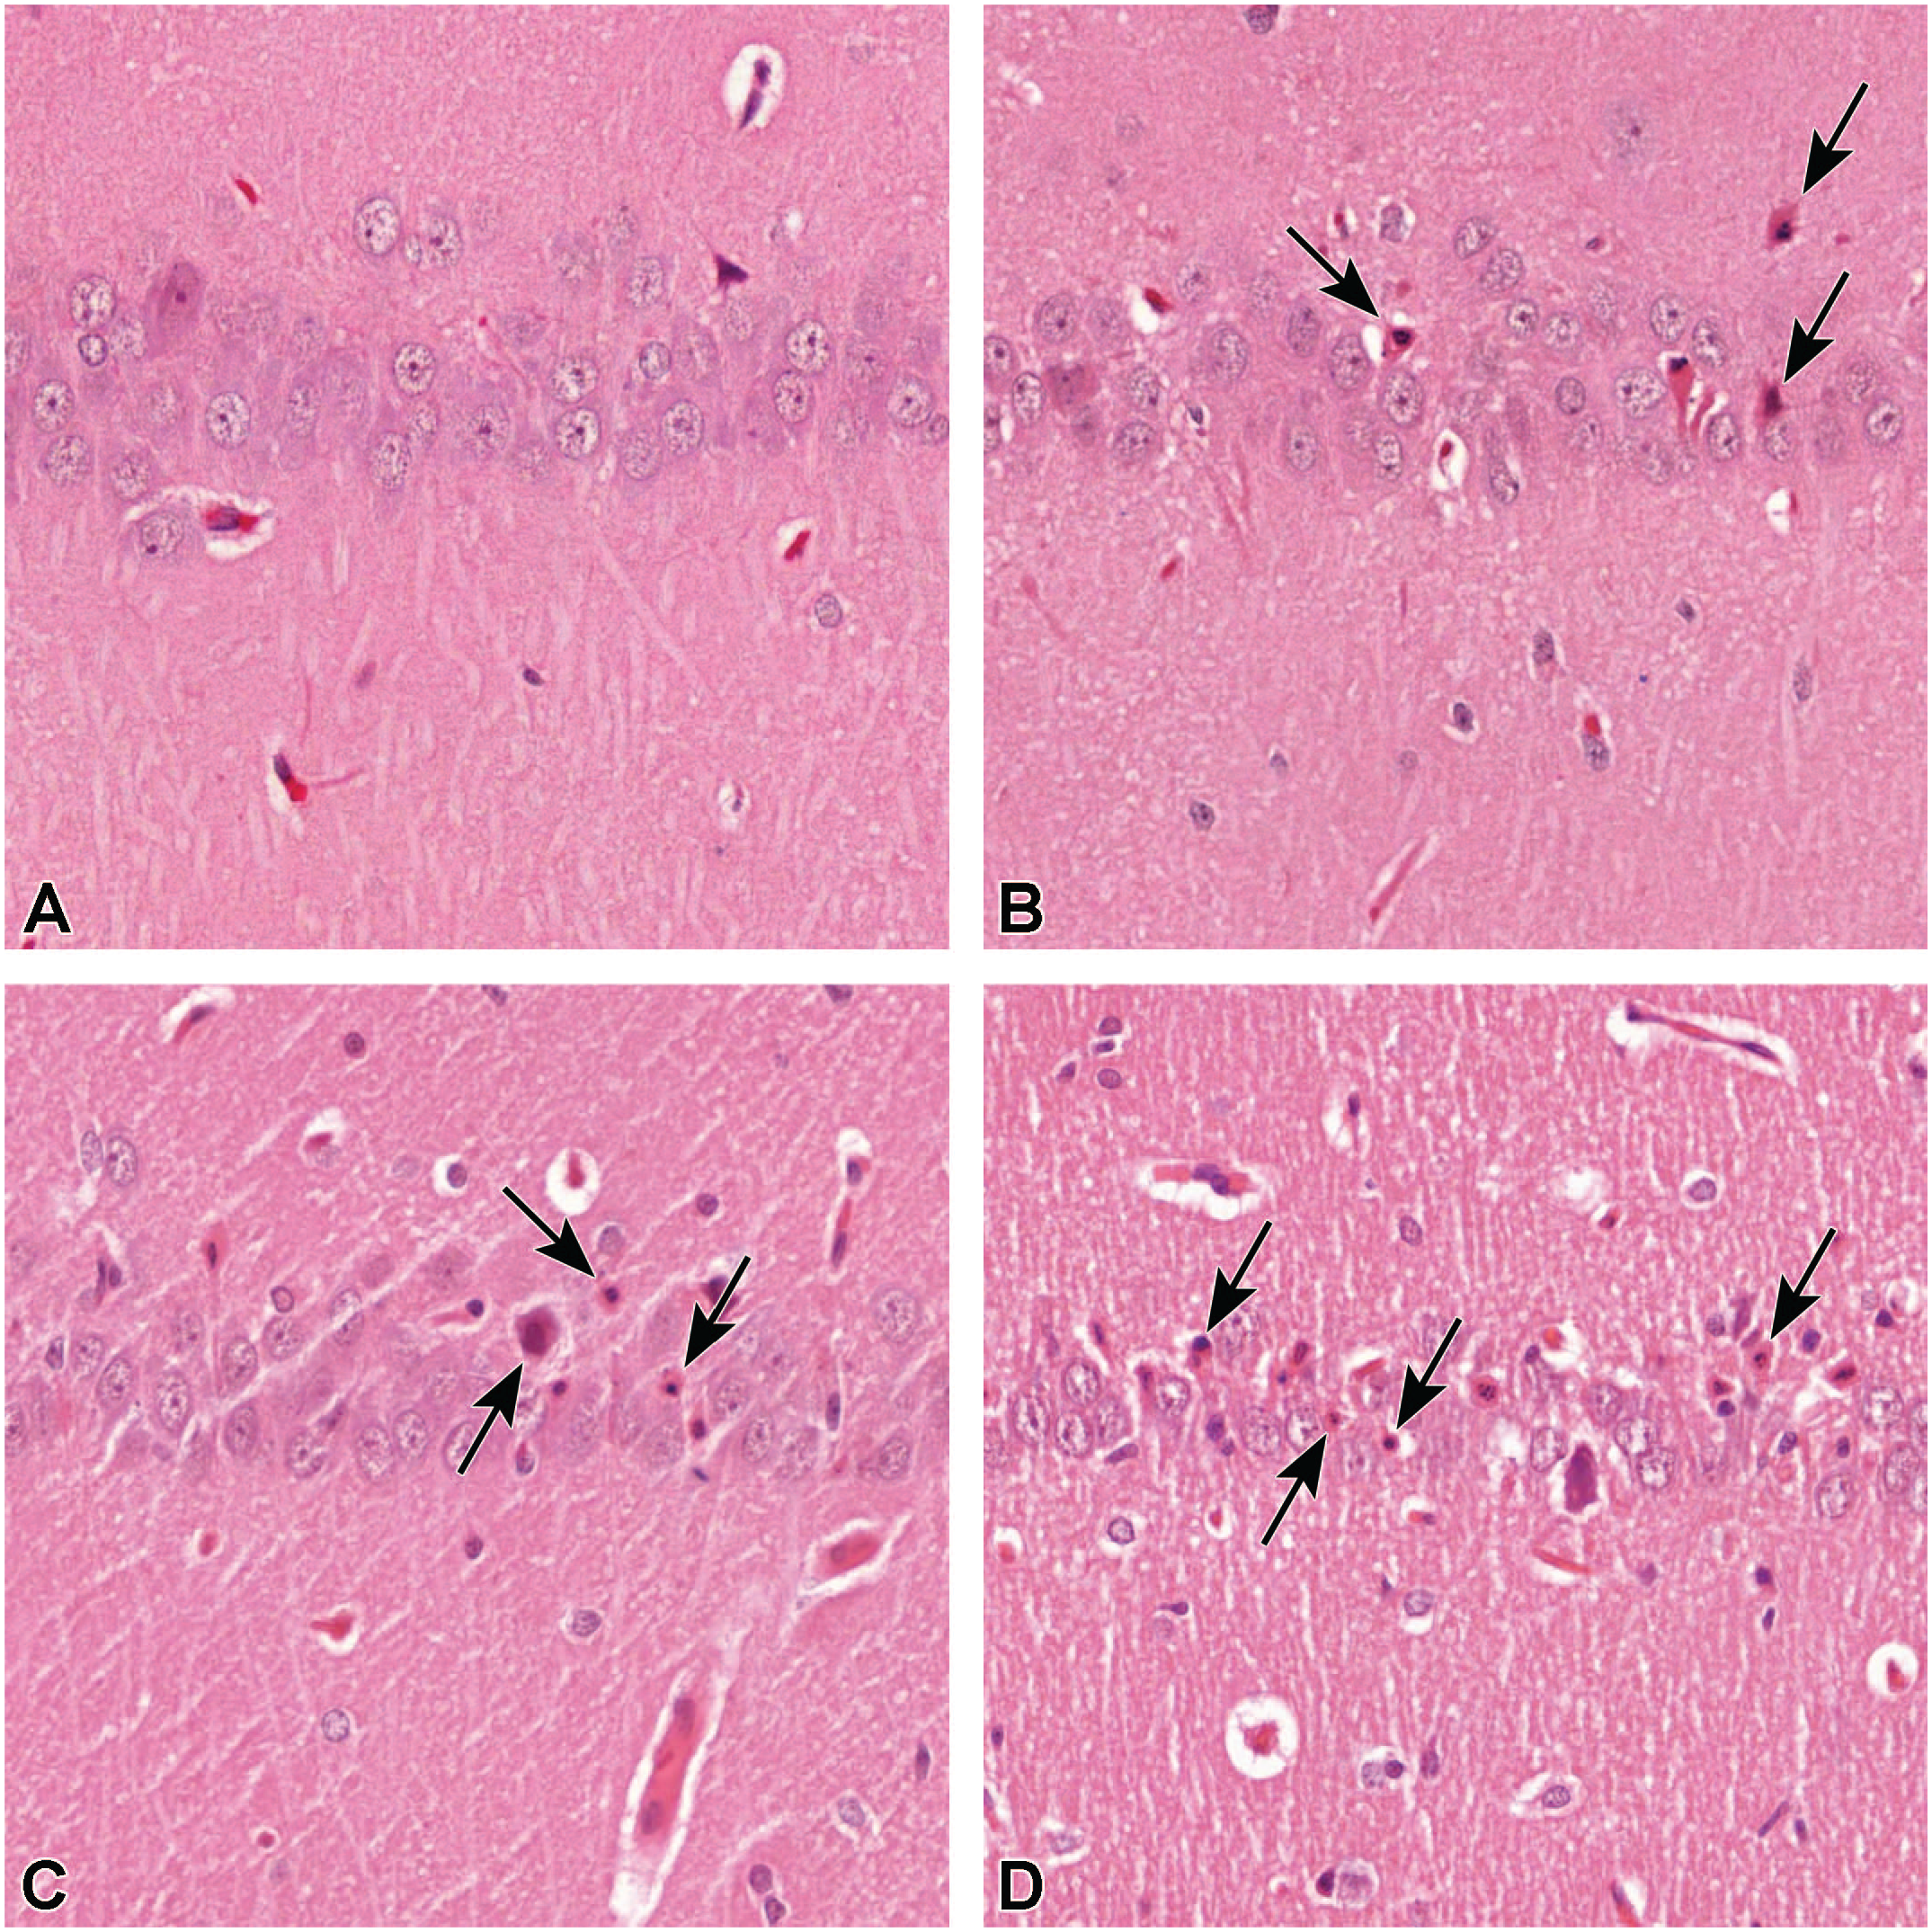
Rat brain, hippocampus, Ammon’s horn, CA1. TMT induces marked acute progressive neurotoxicity resulting in multifocal neuronal degeneration/necrosis in hippocampus. In control animals (A), sacrificed at day 8, no neurotoxicity is observed. In days 4 (B), 6 (C), and 8 (D), a progressive increase in the number of degenerative/necrotic neurons is observed (black arrows). H&E staining, original scan, 40X. TMT indicates trimethyltin.
At day 8, neuronal degeneration was at its severest. In hippocampus, the neuronal loss and degeneration appeared to progress over time, whereas in the auditory cortex, the longest timepoint (day 8) was clearly the most severe, while at days 4 and 6, the severity of neuronal degeneration appeared similar.
Astrocyte Identification by IHC
Reactive astrogliosis, identified as positive GFAP labeling, was associated with the same brain areas as the neuronal degeneration. Yet, in hippocampus, reactive astrogliosis was prominent not only around CA1 neurons (Figure 3), but extended throughout the Ammon’s horn. Reactive astrogliosis was also marked around dentate gyrus. Reactive astrogliosis was observed in all TMT-treated animals in all timepoints. At the longest timepoint (8 days), reactive astrogliosis was most severe (Figure 3D). In the earlier timepoints (4 and 6 days postdosing), no marked difference in severity grade was observed between the groups.
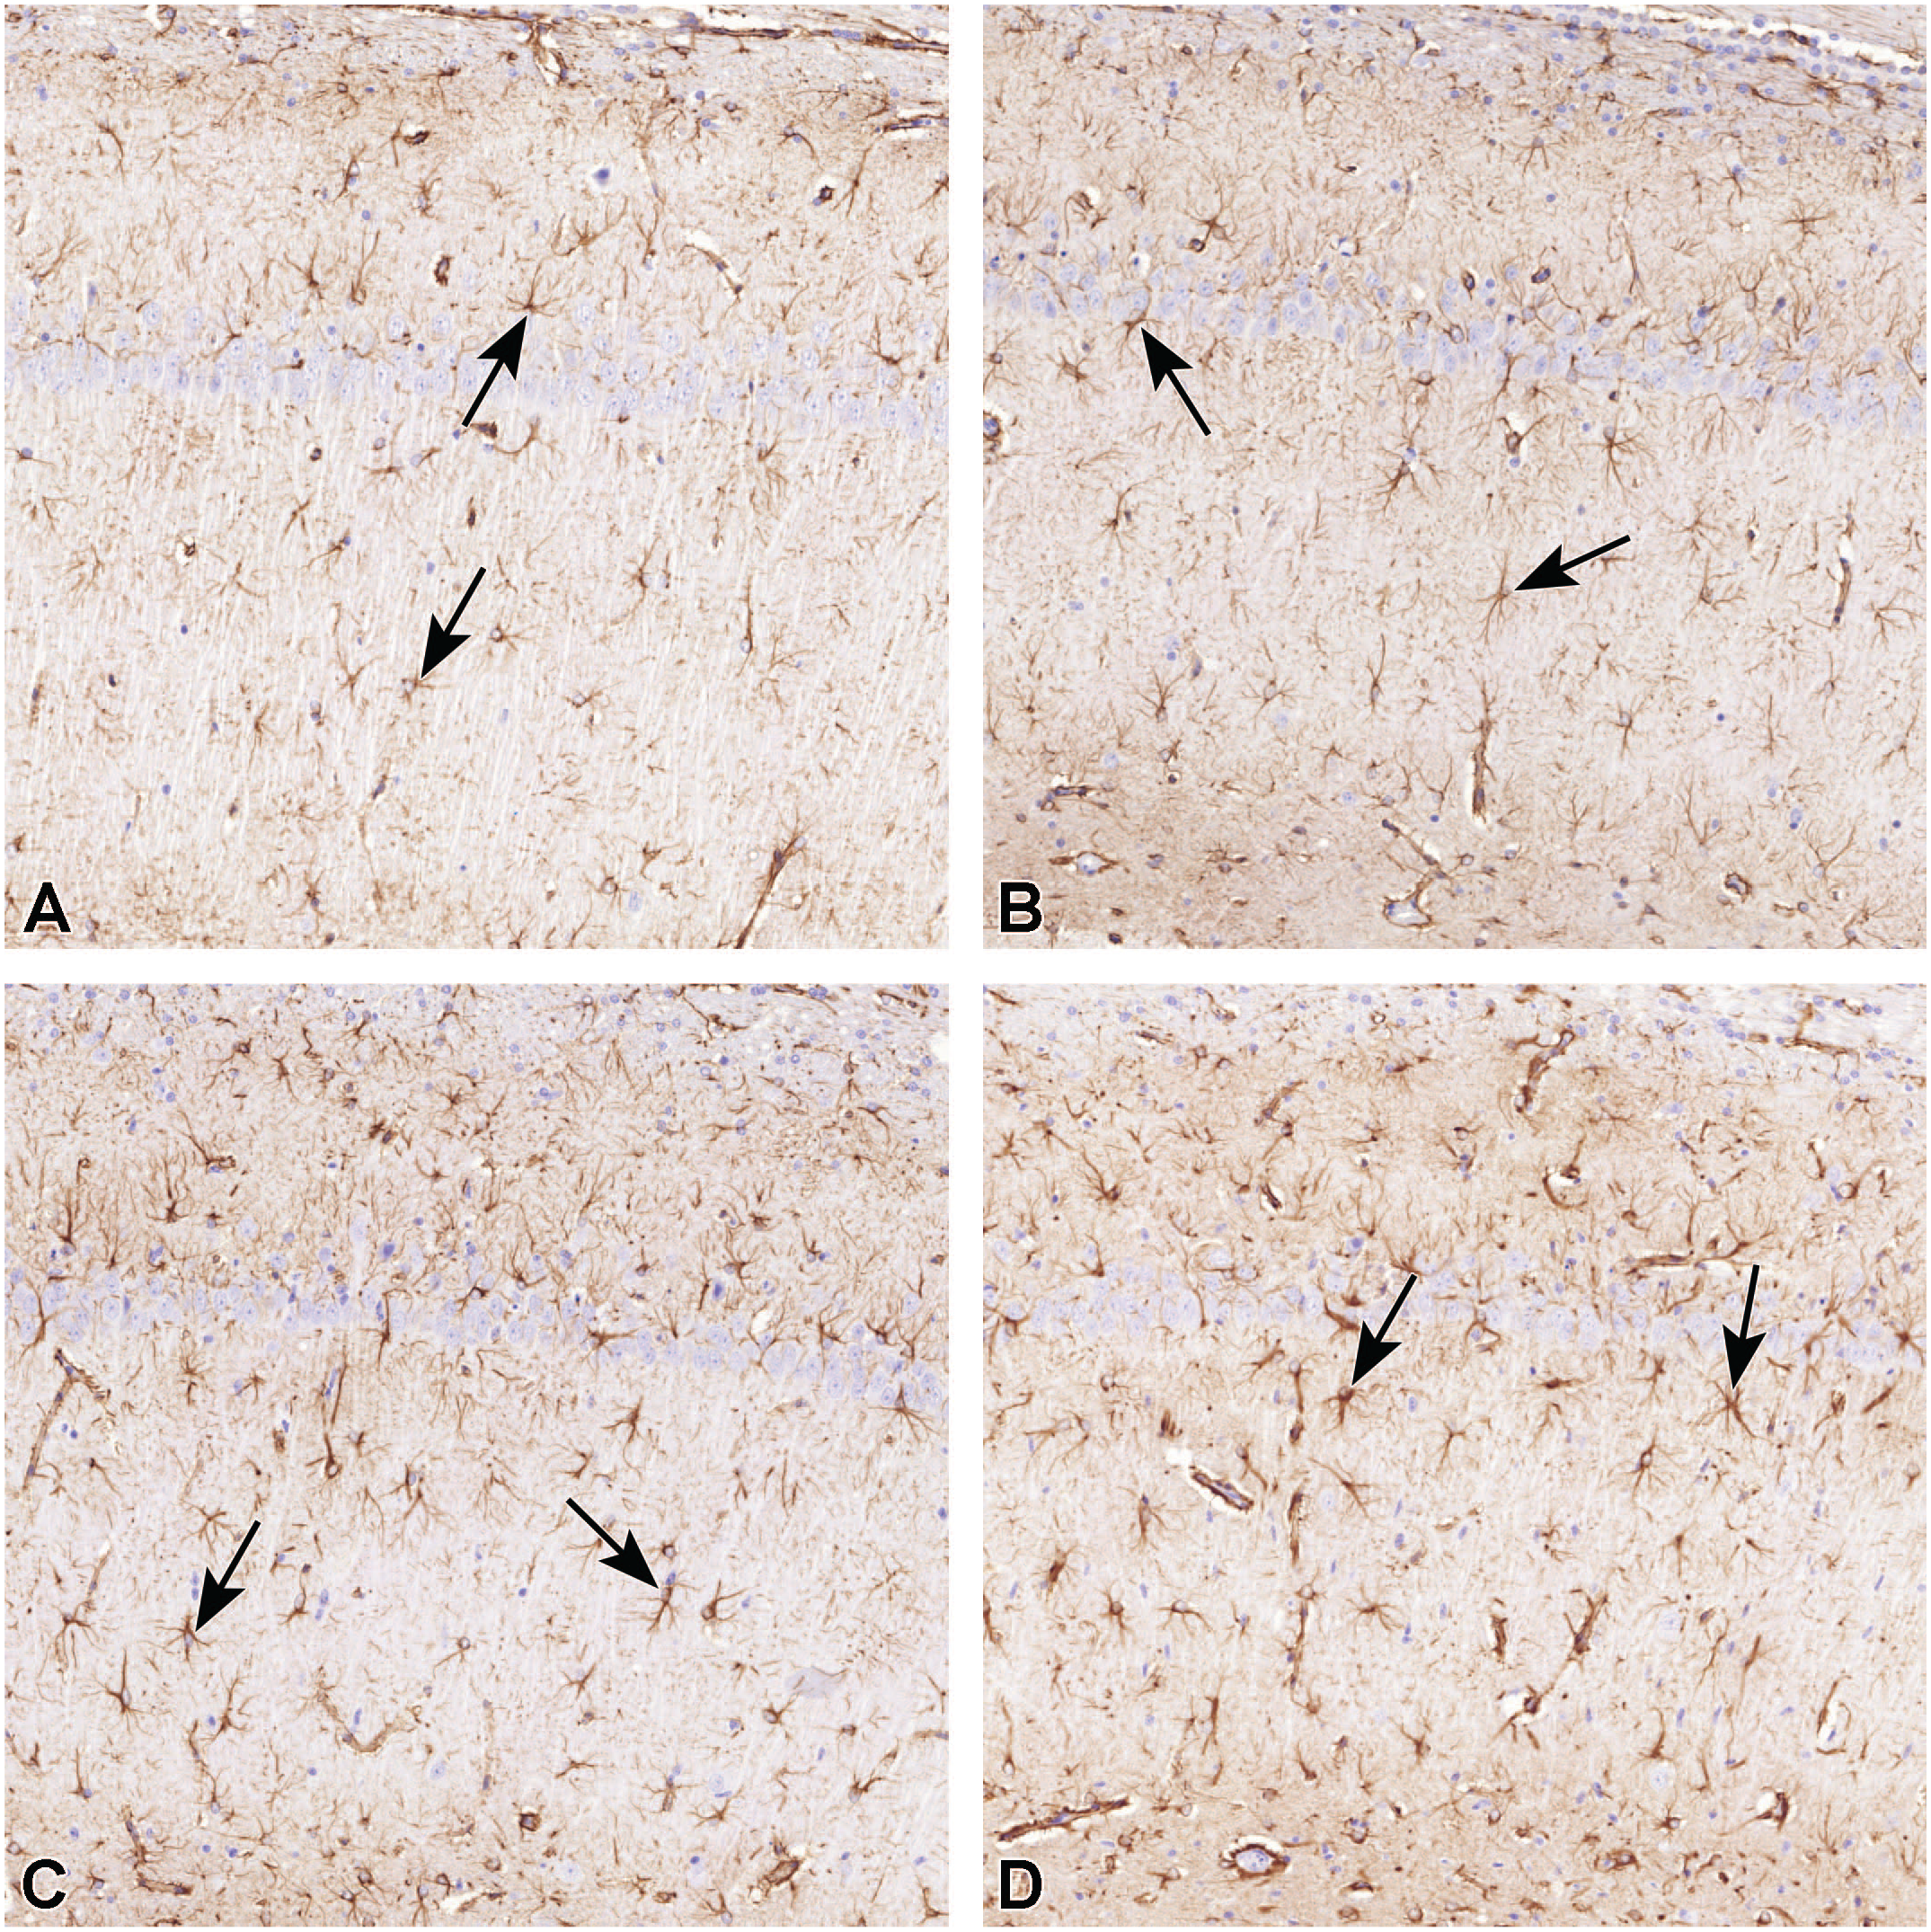
Rat brain, hippocampus, Ammon’s horn, CA1. Representative micrographs of GFAP-labeled astrocytes in TMT-induced progressive neurotoxicity. In control animals (A), GFAP-positive cells are a characterized by small, condensely labeled soma and few, slender processes. In days 4 (B), 6 (C), and 8 (D), the number of GFAP-positive cells increase, and they become hypertrophic with numerous, thick processes. Representative astrocytes are marked with arrows. GFAP labeling, original scan, 40X. GFAP indicates glial fibrillary acidic protein; TMT, trimethyltin.
Astrocyte Identification by the Deep Learning Algorithm
The astrocyte algorithm was able to create an overlay, which followed the outlines of the complete astrocytes very precisely, including the soma and the thin processes (Figure 4). Algorithm was able to exclude blood vessels with astrocytic endfeet from the results. The analysis time varied from 2 to 5 minutes per region of interest.
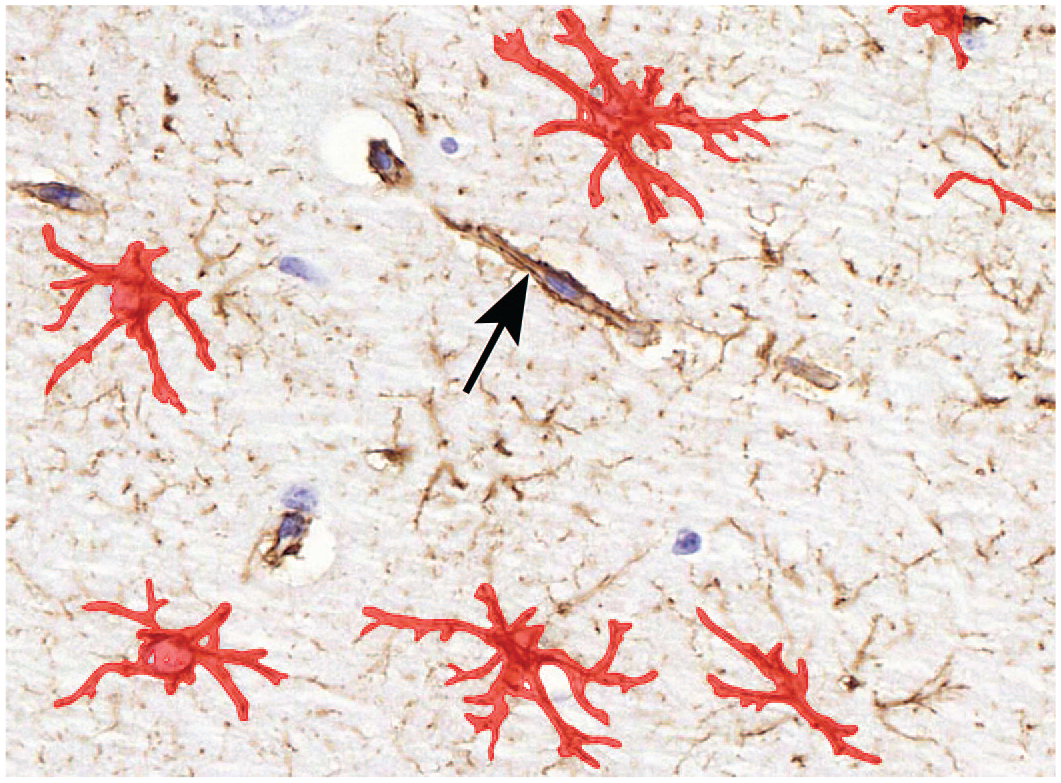
Visual representation of algorithm analysis result. Red overlay portrays the detected astrocytes. The excluded blood vessel is marked with an arrow. Original scan, 40X.
Morphometric Changes in Astrocytes Between Treatment Groups
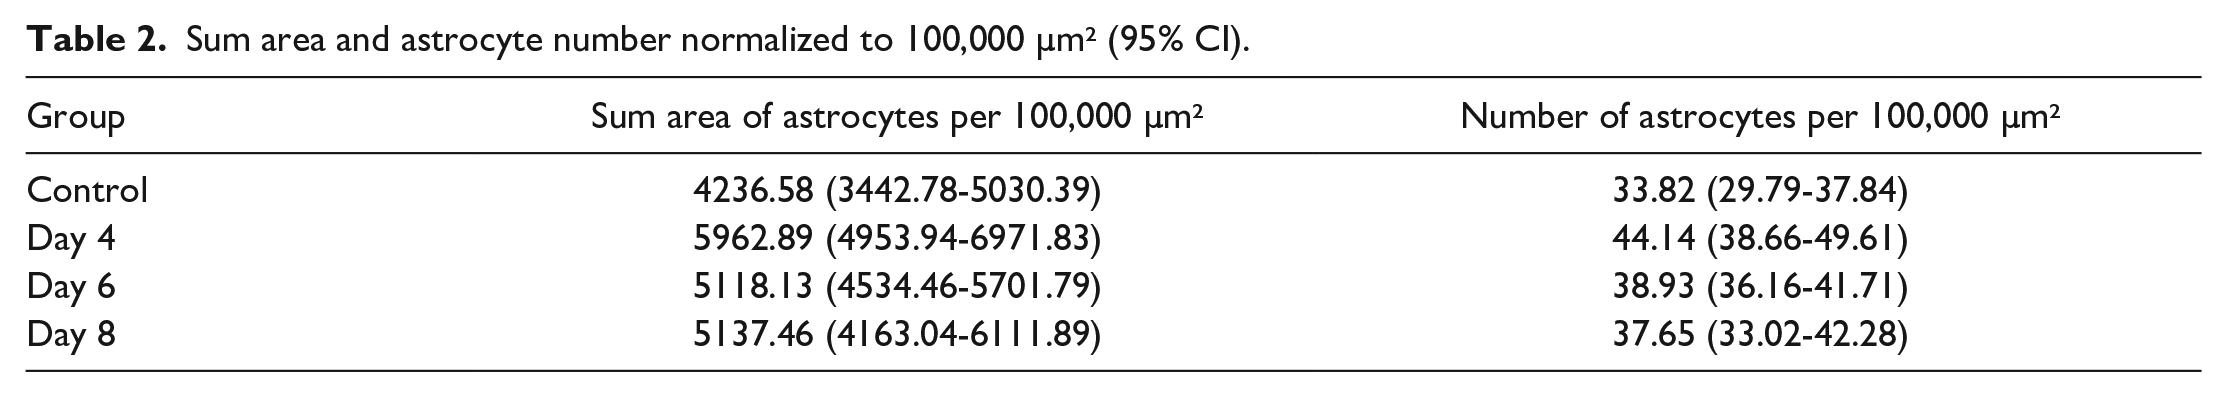
As an output, the algorithm produced morphometric data of individual astrocytes; area and circumference measured along the branching processes. Mean area of individual astrocytes were significantly higher in the treated groups compared to control group (Table 1). Astrocyte circumference also increased nonsignificantly after TMT treatment (Table 1). Neither of these parameters increased in a time-dependent manner. For astrocytic total sum area, and number of astrocytes, values were normalized to 100,000 µm² of brain tissue area to remove tissue size variability (Table 2). Sum area and the number of astrocytes were higher in treated groups compared to the control group. However, no time course response was seen with these measured variables. The analyzed variables peaked at day 4, with the exception of mean area of individual astrocytes, which was at its highest at day 8.
Morphometry of individual astrocytes (95% CI).
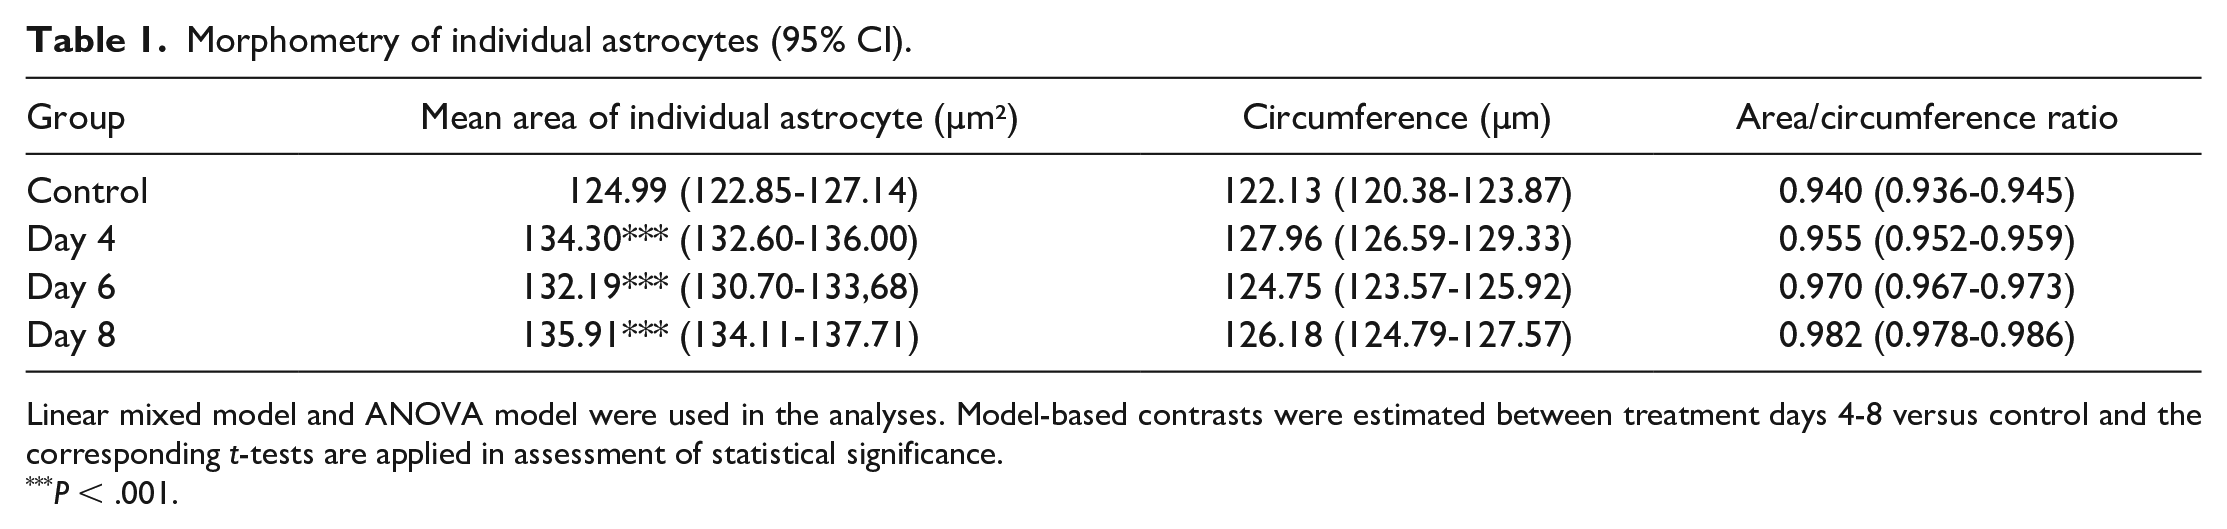
Linear mixed model and ANOVA model were used in the analyses. Model-based contrasts were estimated between treatment days 4-8 versus control and the corresponding t-tests are applied in assessment of statistical significance.
P < .001.
Sum area and astrocyte number normalized to 100,000 µm² (95% CI).
However, the area to circumference ratio of individual astrocytes was increased in treated groups in a time-dependent manner (Table 1). This increase in the ratio resulted in a linear time course response (R² = 0.976; Figure 5).
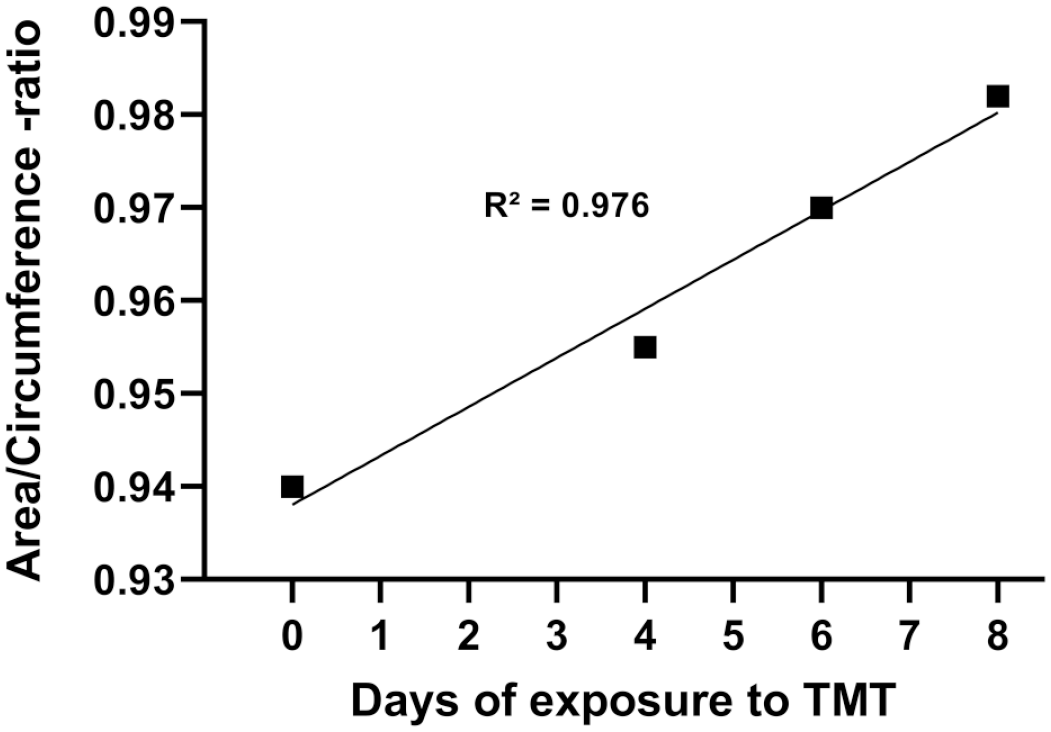
Area/circumference ratio of individual astrocytes in rat hippocampus. Control animal (n = 5) received vehicle and were sacrificed at day 8. Treated rats received a single dose of TMT (7 mg/kg, i.p.) and were sacrificed at day 4 (n = 6), day 6 (n = 7), and day 8 (n = 8). Highly significant linear increase (P < .0122) was seen between groups, with R-squared value of 0.976. The number of astrocytes analyzed exceeds 10,000 in each timepoint.
Discussion
The TMT-induced rat neurotoxicity model can be used to study neurodegeneration with an acute onset of behavioral changes and histopathological lesions in the brain, mainly in hippocampal region. 28 Trimethyltin induces robust neuronal loss and reactive astrogliosis, and reactive astrogliosis is considered as a hallmark of the advancing neurotoxicity. 21 In drug development, reactive astrogliosis is evaluated as a sign of neurotoxicity in toxicological studies. On the other hand, reduction of reactive astrogliosis can be used as a marker for pharmacological efficacy of neuroprotective drug candidates. Current method to evaluate reactive astrogliosis relies on manual counting of individual astrocytes, which is highly time-consuming, tedious and prone to intraobserver and interobserver biases.
To our best of knowledge, no robust segmentation tools for astrocytes from immunoperoxidase-stained sections have been previously reported. Our goal was to produce a deep learning algorithm, capable of identifying individual astrocytes and extracting morphometric data. In the analysis, we focused on hippocampal region, based on the literature of the toxicity profile of TMT.
With the algorithm reported here, it was possible to accurately identify and segmentate individual astrocytes from GFAP-immunolabelled sections. In brain tissue, astrocyte interacts with a variety of cell types with their processes that penetrate the tissue in three dimensional manner. 29 In a two-dimensional section, these processes can be seen as disconnected fibers. Initially, algorithm identified small GFAP immunopositive fibers with varying confidence from the brain tissue. To accurately evaluate, and to avoid multiplex counting of individual astrocytes, we trained the algorithm to exclude disconnected processes and vascular endfeet. After iterative algorithm training, only intact astrocytes were counted.
Reactive astrogliosis is considered to involve dynamic changes in protein synthesis, hypertrophy and in severe cases, proliferation, and scar formation. 30 Following neurotoxic insult, increased expression of GFAP is considered to be a hallmark of the reactive astrocyte phenotype. This upregulation can be visualized by an increase in GFAP-positive astrocytes in labeled brain sections. Therefore, we selected mean area and circumference of individual astrocytes, and the sum of area and number of these cells combined as measured outputs from the data.
We expected that GFAP-positive cell number and astrocytic hypertrophy would increase in a time-dependent manner after neurotoxic insult. This, however, was not reflected to the measured raw data. A significant increase in individual astrocyte area, and a nonsignificant increase in individual cell circumference and the number of astrocytes was observed in TMT-treated animals (Tables 1 and 2), but without a time course response. In this TMT model, the data generated by the algorithm indicate that the peak of the astrocyte reactivity would occur at day 4, likely due to the rapid induction of GFAP protein expression. 28 At this timepoint, the total area, number, and circumference of the astrocytes were at their highest. Thereafter, the number of positive signals declined slightly (Table 2), albeit a moderate increase in mean area of individual astrocytes (Table 1). The decline in astrocyte number and total cell area suggest that the peak of protein synthesis has been bypassed and fewer cells are recognized as positive, while the cells that do remain positive, may appear larger. It must be noted that only one ROI/animal was analyzed and it cannot confirmed that this one 2-dimensional section is representative of the entire hippocampus.
Intriguingly, the astrocyte area/circumference ratio increased in a time-dependent manner. The metrical circumference of the cell increases along the increased branching of the astrocytic processes, while cell area increases when the cell becomes hypertrophied and plumb with thicker processes. Thus, an increase in the ratio is an indicator of astrocytic reactivity, where the volume of the cell increases more rapidly than the circumference (Figure 6). Consequently, in this TMT-induced neurotoxicity model, reactive astrogliosis is reflected not only as rapid branching of astrocytic processes, but also as fast dynamic expansion of the cytosolic compartment. As portrayed in Figure 6, this unspecific temporal change in astrocyte morphology can be detected qualitatively, if sufficient comparison examples are available. However, metrical data are required for consistent analysis of this morphometric marker of astrocyte reactivity. Without a robust segmentation tool, like presented here, generation of such data is not possible. This parameter, to our knowledge, has not been measured of astrocytes previously. Further studies are needed to elucidate the biological relevance of this novel morphometric marker.
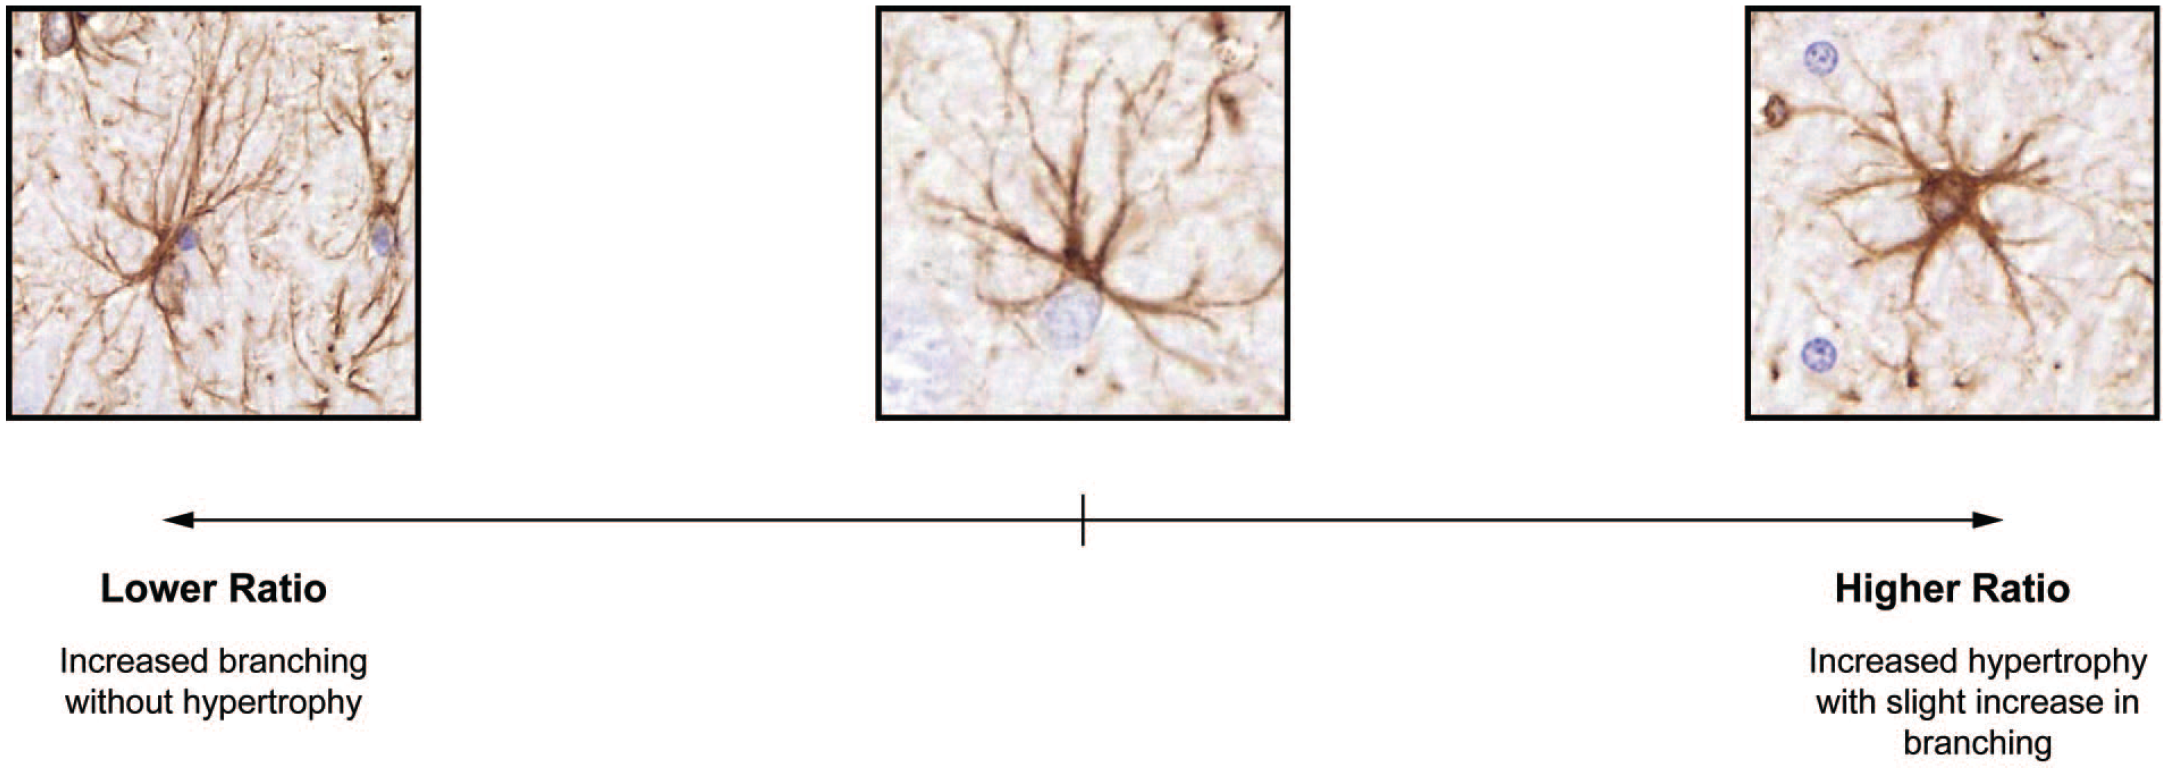
Visual example of the change in astrocyte area/circumference ratio. Representative micrographs display changing astrocyte cell area and circumference upon reactive astrogliosis. The middle micrograph shows an astrocyte with minimal branching and hypertrophy. On the left, an astrocyte with increased branching reflected as long, slender processes, is portraited (high circumference, low area). On the right, a cell with distinctly hypertrophic soma and thick processes is presented (medium circumference, high area).
Previous astrocyte analysis methods are based on fluorescent-stained samples, which require immediate scanning and specialized equipment. Even though fluorescent labeling provides high specificity and enables the use of multiple labels, progressive bleaching, even during the scanning process, may reduce the intensity of positive signal compared to background. Also due the progressive fluorescent bleaching of the samples, any further imaging of the samples is not possible. Immunoperoxidase-stained samples are suitable for long-term storage and can be re-evaluated, making them also more suitable for regulatory studies. The algorithm reported here, showcases that the emerging deep learning image analysis algorithms are promising tools to accurately and consistently segment and identify complex features, and extract detailed morphometric data.
While algorithms rely on human annotation and training, knowledge of the personnel and background can act as a source of bias in algorithm development phase. To overcome possible interobserver bias in algorithm training, golden truth for algorithm development should be agreed among group of experts, increasing the robustness of the developed algorithm. However, there are slight visual and dimensional differences in cell morphology across species, aggravating the accuracy with which algorithm identifies the desired objects. To enable cross-species identification, additional adaptive training is required. However, based on authors’ experience, these types of adaptive trainings require some additional annotations and few iterative trainings.
In conclusion, the segmentation algorithm was developed and trained to identify astrocytes from immunoperoxidase-stained brain sections of Wistar Hannover rats. Algorithm was capable of segmenting complete astrocytes with high accuracy and repeatability, while excluding disconnected processes. This precise segmentation provided robust and highly sensitive set of datapoints, which enabled accurate tracking of progressing neurotoxicity. In addition, area/circumference ratio of individual astrocyte was tentatively identified as a novel potential morphometric marker to evaluate progression of reactive astrogliosis.
Supplemental Material
sj-docx-1-tpx-10.1177_01926233221124497 – Supplemental material for Deep Learning–Based Segmentation of Morphologically Distinct Rat Hippocampal Reactive Astrocytes After Trimethyltin Exposure
Supplemental material, sj-docx-1-tpx-10.1177_01926233221124497 for Deep Learning–Based Segmentation of Morphologically Distinct Rat Hippocampal Reactive Astrocytes After Trimethyltin Exposure by Miika Vuorimaa, Ilona Kareinen, Petri Toivanen, Stefan Karlsson and Saku Ruohonen in Toxicologic Pathology
Supplemental Material
sj-tif-4-tpx-10.1177_01926233221124497 – Supplemental material for Deep Learning–Based Segmentation of Morphologically Distinct Rat Hippocampal Reactive Astrocytes After Trimethyltin Exposure
Supplemental material, sj-tif-4-tpx-10.1177_01926233221124497 for Deep Learning–Based Segmentation of Morphologically Distinct Rat Hippocampal Reactive Astrocytes After Trimethyltin Exposure by Miika Vuorimaa, Ilona Kareinen, Petri Toivanen, Stefan Karlsson and Saku Ruohonen in Toxicologic Pathology
Supplemental Material
sj-tif-5-tpx-10.1177_01926233221124497 – Supplemental material for Deep Learning–Based Segmentation of Morphologically Distinct Rat Hippocampal Reactive Astrocytes After Trimethyltin Exposure
Supplemental material, sj-tif-5-tpx-10.1177_01926233221124497 for Deep Learning–Based Segmentation of Morphologically Distinct Rat Hippocampal Reactive Astrocytes After Trimethyltin Exposure by Miika Vuorimaa, Ilona Kareinen, Petri Toivanen, Stefan Karlsson and Saku Ruohonen in Toxicologic Pathology
Supplemental Material
sj-tif-6-tpx-10.1177_01926233221124497 – Supplemental material for Deep Learning–Based Segmentation of Morphologically Distinct Rat Hippocampal Reactive Astrocytes After Trimethyltin Exposure
Supplemental material, sj-tif-6-tpx-10.1177_01926233221124497 for Deep Learning–Based Segmentation of Morphologically Distinct Rat Hippocampal Reactive Astrocytes After Trimethyltin Exposure by Miika Vuorimaa, Ilona Kareinen, Petri Toivanen, Stefan Karlsson and Saku Ruohonen in Toxicologic Pathology
Supplemental Material
sj-tif-7-tpx-10.1177_01926233221124497 – Supplemental material for Deep Learning–Based Segmentation of Morphologically Distinct Rat Hippocampal Reactive Astrocytes After Trimethyltin Exposure
Supplemental material, sj-tif-7-tpx-10.1177_01926233221124497 for Deep Learning–Based Segmentation of Morphologically Distinct Rat Hippocampal Reactive Astrocytes After Trimethyltin Exposure by Miika Vuorimaa, Ilona Kareinen, Petri Toivanen, Stefan Karlsson and Saku Ruohonen in Toxicologic Pathology
Supplemental Material
sj-xls-3-tpx-10.1177_01926233221124497 – Supplemental material for Deep Learning–Based Segmentation of Morphologically Distinct Rat Hippocampal Reactive Astrocytes After Trimethyltin Exposure
Supplemental material, sj-xls-3-tpx-10.1177_01926233221124497 for Deep Learning–Based Segmentation of Morphologically Distinct Rat Hippocampal Reactive Astrocytes After Trimethyltin Exposure by Miika Vuorimaa, Ilona Kareinen, Petri Toivanen, Stefan Karlsson and Saku Ruohonen in Toxicologic Pathology
Supplemental Material
sj-xlsx-2-tpx-10.1177_01926233221124497 – Supplemental material for Deep Learning–Based Segmentation of Morphologically Distinct Rat Hippocampal Reactive Astrocytes After Trimethyltin Exposure
Supplemental material, sj-xlsx-2-tpx-10.1177_01926233221124497 for Deep Learning–Based Segmentation of Morphologically Distinct Rat Hippocampal Reactive Astrocytes After Trimethyltin Exposure by Miika Vuorimaa, Ilona Kareinen, Petri Toivanen, Stefan Karlsson and Saku Ruohonen in Toxicologic Pathology
Footnotes
Acknowledgements
The authors thank Anne Takala for excellent technical assistance, and Sami Virtanen for statistical and data management support. Dr Anna Knuutila is thanked for technical support with the Aiforia platform. Sari Ketola and animal handlers are thanked for animal care and study conduction.
Declaration of Conflicting Interests
The author(s) declared the following potential conflicts of interest with respect to the research, authorship, and/or publication of this article: The algorithm is proprietary property of Aiforia Technologies Plc C and Orion Pharma Oy, and the details of the algorithm will not be enclosed. The author(s) declared no real, perceived or potential conflicts of interest with respect to the research, authorship, and/or publication of this article.
Funding
The author(s) received no financial support for the research, authorship, and/or publication of this article.
Data Accessibility
Raw data can be obtained from the corresponding author.
Supplemental Material
Supplemental material for this article is available online.
References
Supplementary Material
Please find the following supplemental material available below.
For Open Access articles published under a Creative Commons License, all supplemental material carries the same license as the article it is associated with.
For non-Open Access articles published, all supplemental material carries a non-exclusive license, and permission requests for re-use of supplemental material or any part of supplemental material shall be sent directly to the copyright owner as specified in the copyright notice associated with the article.