
Abstract
This study consisted of a qualitative and quantitative assessment of neuropathological changes in kainic acid (KA)–treated adult male rats. Rats were administered a single 10 mg/kg intraperitoneal injection of KA or the same volume of saline and sacrificed 24 or 48 hours posttreatment. Brains were collected, sectioned coronally (∼ 81 slices), and stained with amino cupric silver to reveal degenerative changes. For qualitative assessment of neural degeneration, sectioned material was evaluated by a board-certified pathologist, and the level of degeneration was graded based upon a 4-point scale. For measurement of quantitative neural degeneration in response to KA treatment, the HALO digital image analysis software tool was used. Quantitative measurements of specific regions within the brain were obtained from silver-stained tissue sections with quantitation based on stain color and optical density. This quantitative evaluation method identified degeneration primarily in the cerebral cortex, septal nuclei, amygdala, olfactory bulb, hippocampus, thalamus, and hypothalamus. The KA-produced neuronal degeneration in the cortex was primarily in the piriform, insular, rhinal, and cingulate areas. In the hippocampus, the dentate gyrus was found to be the most affected area. Our findings indicate global neurotoxicity due to KA treatment. Certain brain structures exhibited more degeneration than others, reflecting differential sensitivity or vulnerability of neurons to KA.
Introduction
Histopathological analysis of rat brain sections is the “gold standard” for the assessment of toxic effects of chemical agents on the brain. Studies investigating this type of brain injury mainly utilize qualitative or semiquantitative assessment scores based on visual evaluation of the severity of observed brain injury. 1,2 Computer-based digital image analysis is a robust quantitative method with desirable characteristics, including reduced bias, increased precision, and potential for automation. This allows for a quantification of brain injury that provides more insight into subtle changes induced by toxic agents when compared to qualitative methods. One of the approaches in digital image analysis that provides great accuracy and requires less time than traditional methods is the color thresholding method. This method is applied to the RGB (Red-Green-Blue) visual spectra of the imaged tissue. By manually determining threshold values, data from degenerated and unaffected areas can be extracted from the total tissue area and then further analyzed.
Quantitative neurotoxicity assessments using digital image analysis can significantly add to our understanding of selective degeneration in certain brain areas and its behavioral implications. It can also be very useful for regulatory objectives and drug development. It is well known that toxic compounds can differentially affect brain areas in terms of neuronal injury, often being region specific. Quantification of this type of damage could provide important information regarding the uniformity or nonuniformity of neurodegeneration caused by specific compounds. Precise quantification of global neurotoxicity could play a very important role in scenarios wherein pathologists report little or no toxicity, but additive global neurotoxicity may exist. It is important to determine how quantification in such cases will help to better understand the consequences of heretofore unidentified aspects of neurotoxicity.
The use of silver staining 3 for detecting neurodegeneration is a highly effective method for the assessment of neurotoxicity. It is a sensitive method characterized by a high signal-to-noise ratio. Degenerated neurons typically appear black after amino-cupric silver (AmCuAg) staining with minimal black coloration seen in normal healthy neurons, thus making it relatively easy to identify areas of degeneration. 4 Quantification of the silver-stained sections of brains treated with different neurotoxicants using digital image analysis could provide valuable additional information. To date, histopathological analysis of silver-stained tissue has been primarily qualitative; thus, digital image analysis to provide quantitative metrics of toxicity should provide significantly more insight into the nature and extent of neurotoxic damage.
In the present study, kainic acid (KA), a known neurotoxicant, 5 was administered to male rats, and quantitative evaluations of the extent of damage produced were determined in silver-stained brains. A primary goal of this study was to provide a comprehensive, global quantitative evaluation of kainate-induced neurotoxicity using color thresholding. Kainic acid affects cells with glutamatergic receptors, and its proposed toxic mechanism is thought to involve receptor-stimulated excitotoxicity. 6 -8 Kainic acid has been used as a tool to model aspects of epilepsy, 9 and its systemic administration has been shown to affect several areas in the brain, including septal nuclei, nucleus accumbens, hippocampus, amygdala, and the entorhinal cortex, where kainate receptors are in abundance. 10 -21 A quantitative evaluation of the extent of KA-induced toxicity in various brain areas is yet to be reported.
Materials and Methods
Animals and Drug Treatment
Sprague Dawley rats (66.6 ± 1.5 days, 360 ± 8.4 g, male; Charles River labs) were administered a single 10 mg/kg intraperitoneal (IP) dose of KA (CAS number: 487-79-6; n = 5) or saline (n = 3). At 24 or 48 hours post-dosing, animals were anesthetized with 5% isoflurane and transcardially perfused with 4% paraformaldehyde as described previously. 22 Saline-treated animals served as controls. A typical 12/12-hour day–night light cycle was used for animals. They were fed ad libitum on the standard rat chow diet. Animals were single housed in polypropylene cages. These cages were outfitted with ventilated-top isolators and natural wood chip bedding. Protocols regarding animal use were approved by Institutional Animal Care and Use Committee at the National Center for Toxicological Research (NCTR) and conducted in full accordance with the Public Health Service Policy on Humane Care and Use of Laboratory Animals.
Histology
For perfusion, 50 mL of Perfusion Wash, Super Reagent (EM Sciences, # 1222SK) was used, followed immediately by Perfusion Fix, Super Reagent (EM Sciences, # 1223SK). All reagents had heparin 1 U/mL. Perfusion was performed at room temperature and was gravity driven (reagent bottle at 1 m above the rat). Head was cut off and stored in Perfusion Fix super reagent for 24 to 48 hours. Then, the brain was removed from the skull and stored and shipped in phosphate-buffered saline. pH of all solutions was 7.2. Brains were incubated overnight in 20% glycerol and 2% dimethyl sulfoxide. The brains were then embedded in gelatin-based matrix using MultiBrain Technology (Neuroscience Associates, Inc) for coronal sectioning on American Optical 860 sliding microtome. Every eighth section was stained using AmCuAg (silver) stain. 3 Eighty-one serial coronal sections (40 μm) were used for histopathological analysis. The procedure was performed according to specifications given by Neuroscience Associates, Inc. 4
Qualitative Evaluation (Pathology Scoring for KA Toxicity)
The sections were evaluated using traditional neuropathology assessments consisting of 4-point grading system. 23 Silver-stained slides were analyzed by a pathologist trained in veterinary medicine and held an American college of veterinary pathologists certification (using a 4-point scale based on severity of brain degeneration: 1 [minimal], 2 [mild], 3 [moderate], 4 [marked], and ND = no degeneration]).
Section Digitization and Area Quantification
Stained sections were digitized using a whole-slide imaging instrument (Aperio ScanScope XT; Leica Biosystems) fitted with a 20×/0.75 Plan Apo objective lens (Olympus). Quantitative analyses of the pathological changes associated with single IP injections of KA were performed using a tissue classification and area quantification method based on stain color and optical density as provided in the HALO image analysis software (HALO 2.0, Indica labs; Figure 1).
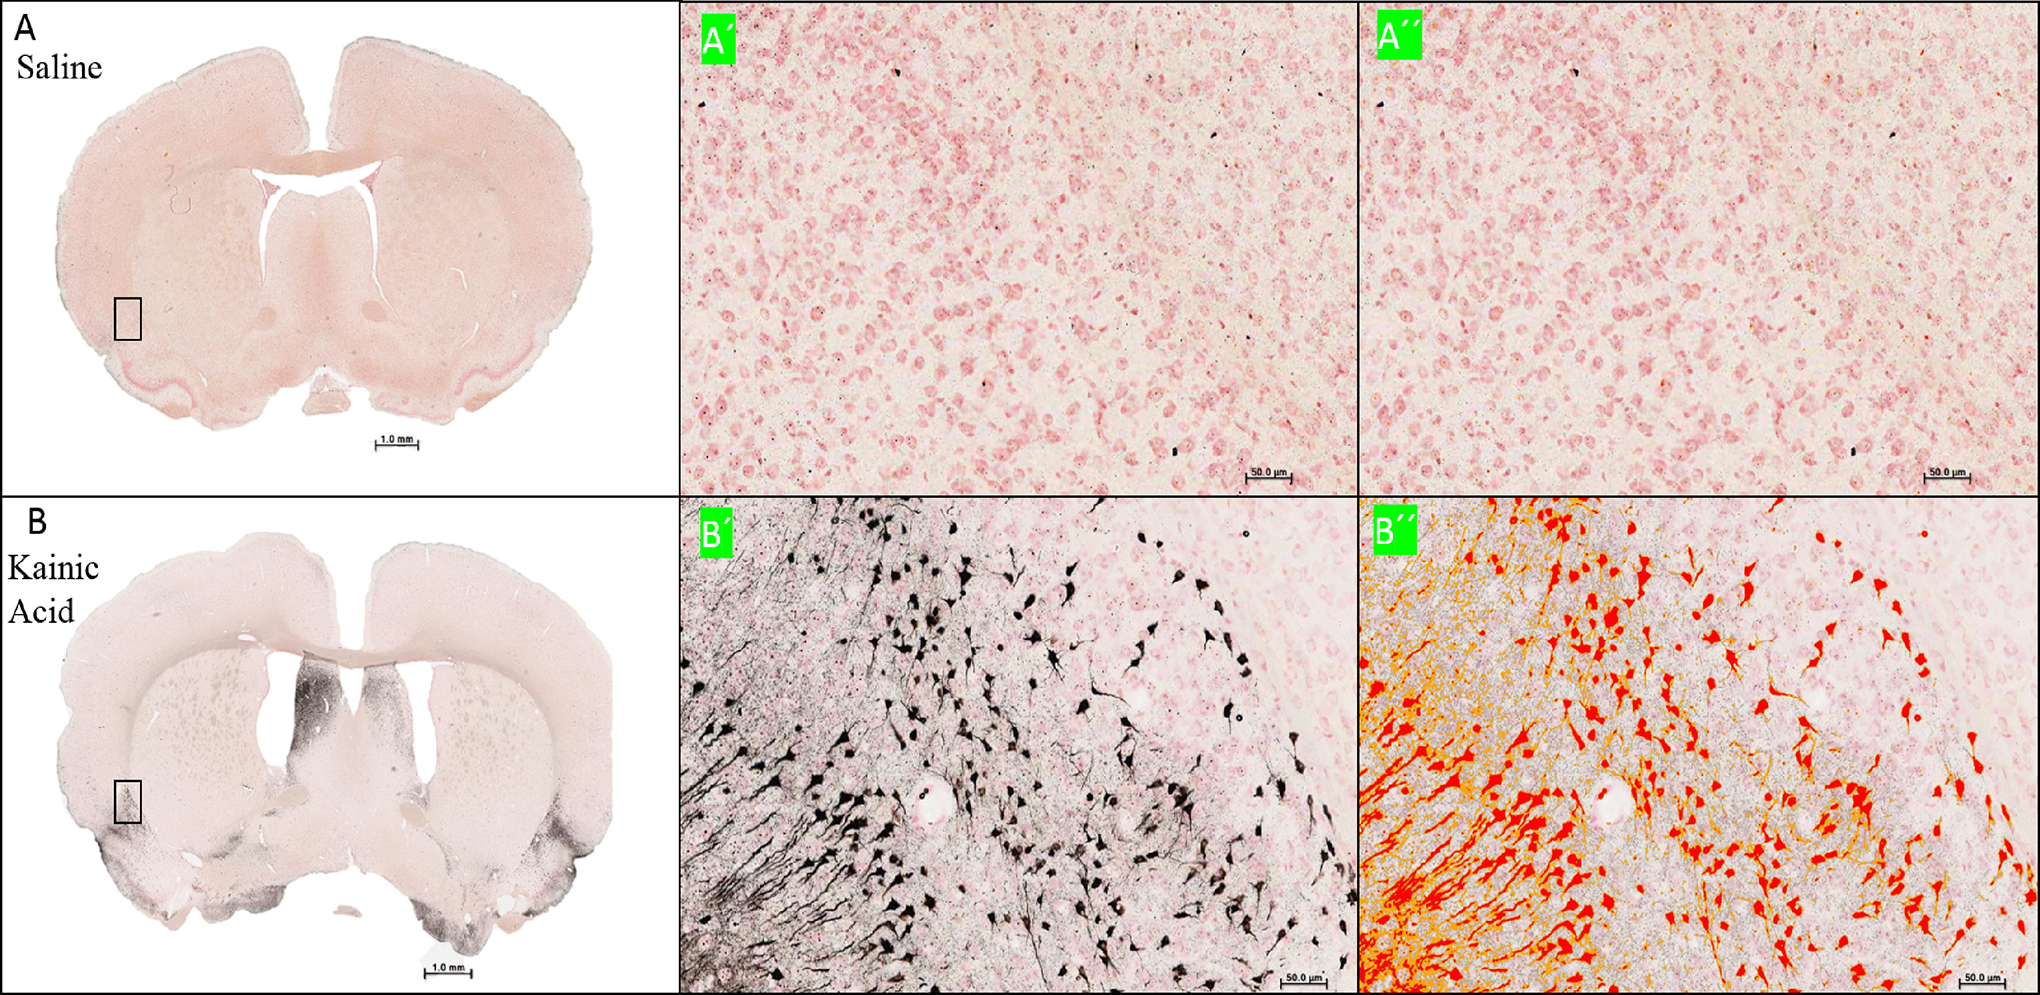
Representative original scanning image of amino-cupric silver staining acquired with Aperio ScanScope XT for saline- (A) and kainic acid–(B) treated rats. A color markup overlay produced by the HALO image analysis platform (HALO 2.0, Indica labs) shows intensity ranges for the amino-cupric silver (black) (A´ and B´) stain shown here as red (A´´ and B´´).
Sections corresponding to different regions of the brain were chosen from 81 digitized coronal sections stained with AmCuAg. Annotation layers were traced for the different brain structures (Figure 2), and an area quantification method was applied to these loci to measure the percentage of degeneration within the demarcated structure. For each section, the software calculated the total area and silver-stained area. The percentage of tissue area stained, representing degeneration, was calculated for each section. Mann-Whitney nonparametric test was performed to determine statistical significance between KA-treated and saline-treated animals. Figure 3 shows all sections corresponding to the cerebral cortex from a representative KA-treated animal after the color annotation algorithm applied to it.
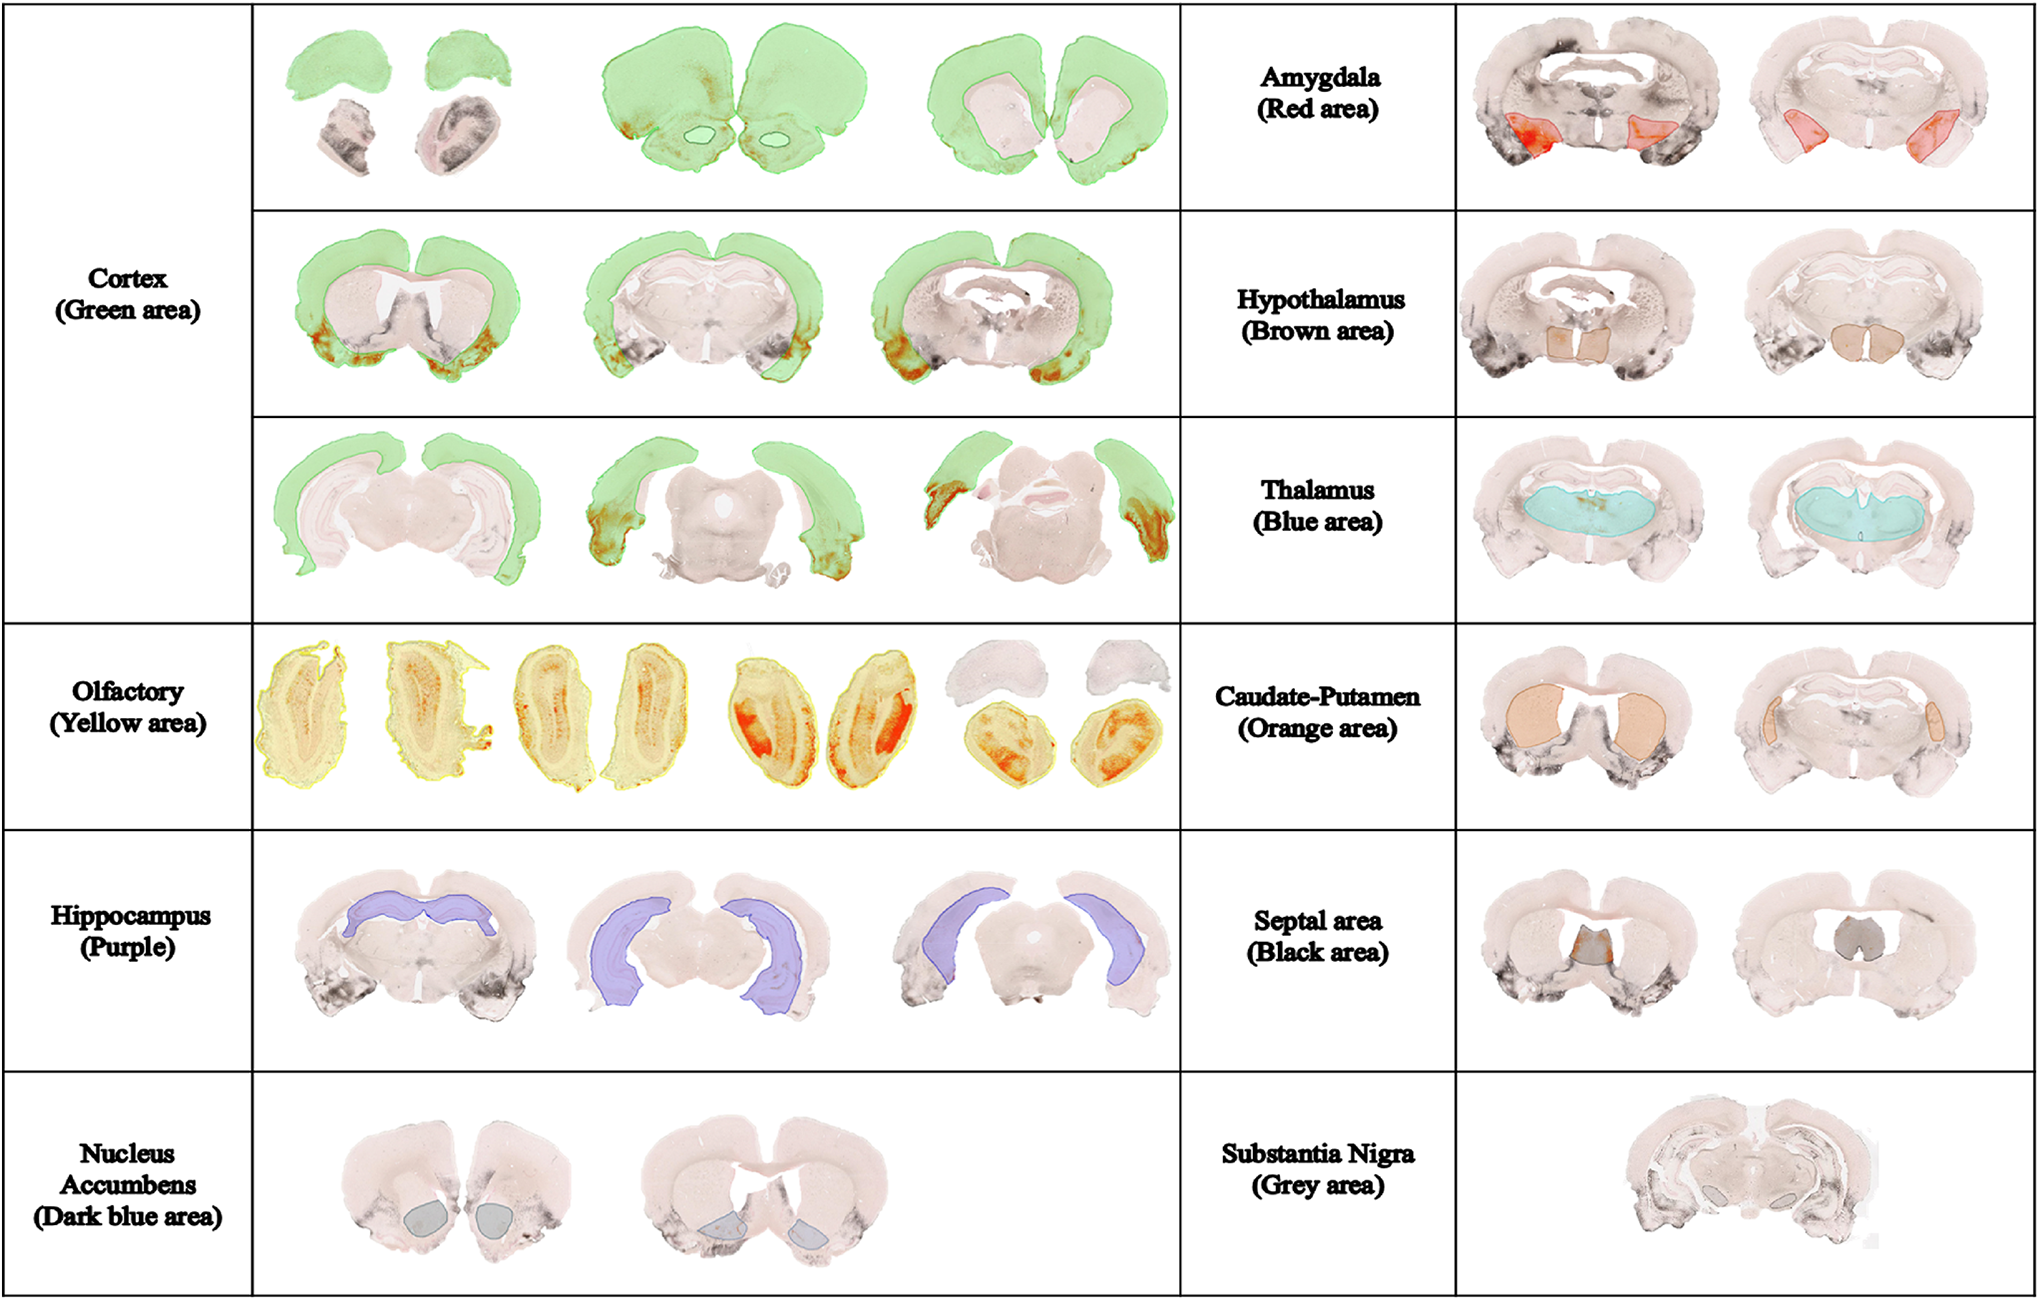
Representative images of brain regions that were quantified. Annotation layers traced for the brain regions—Cerebral cortex (green): Bregma (6.12 mm to −9.00 mm), Interaural (15.12 mm to 0.00 mm); Olfactory (yellow): Bregma (7.56 to 3.72 mm), Interaural (16.56 to 12.72 mm); Hippocampus (purple): Bregma (−1.92 to −8.40 mm), Interaural (7.08 to 0.60 mm); Nucleus Accumbens (dark blue): Bregma (2.76 to 0.84 mm); Interaural (11.76 to 9.84 mm); Amygdala (red): Bregma: (−1.20 to −3.84 mm), Interaural (7.80 to 5.16 mm); Hypothalamus (brown): Bregma (−0.96 to −4.80), Interaural (8.04 to 4.20 mm); Thalamus (blue): Bregma (−1.20 to −6.48 mm), Interaural (7.80 to 2.52 mm); Caudate–Putamen (orange): Bregma (2.52 to −3.48), Interaural (11.52 to 5.52 mm); Septal nuclei (black): Bregma (2.16 to −0.36), Interaural (11.16 to 8.64 mm); and Substantia Nigra (gray): Bregma (−4.56 to −6.12), Interaural (4.44 to 2.88 mm) are highlighted.
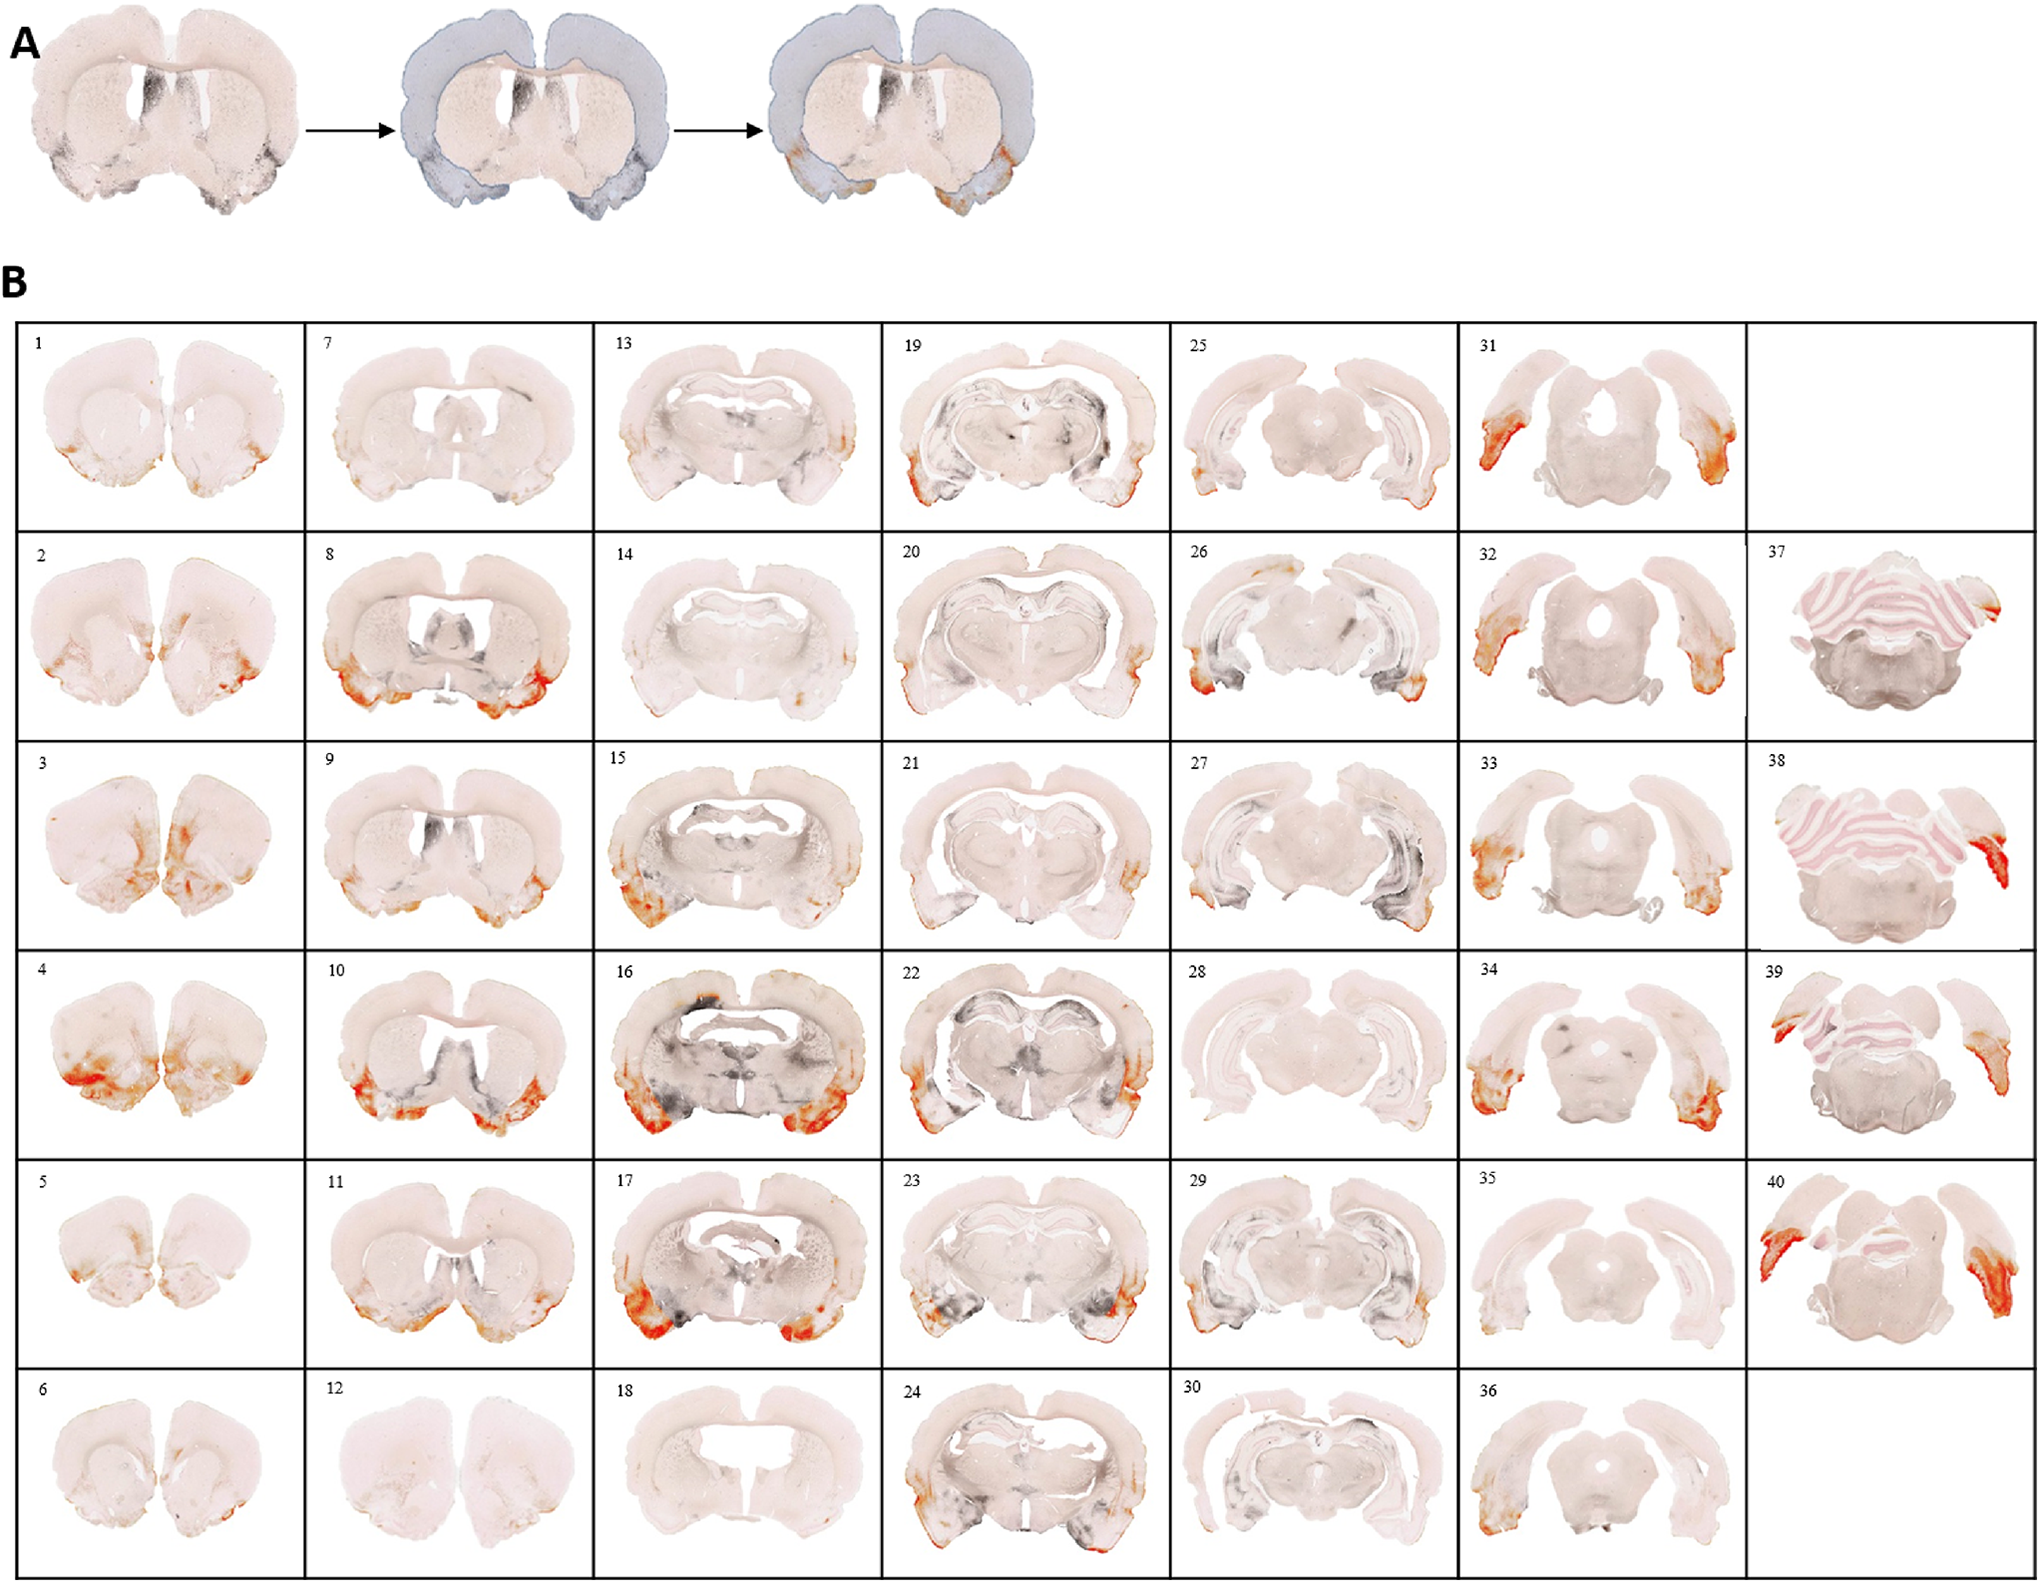
A, Representative image showing annotation layer for cerebral cortex and cortical degeneration in a kainic acid (KA)–treated rat (red) after area quantification. B, Representative images from a KA-treated rat showing all sections corresponding to the cortical region (Interaural: 11.28 mm, Bregma: 2.28 mm to Interaural: 0.00 mm, Bregma: −9.00 mm) and degenerated area (red) in the cerebral cortex. Degenerated area outside the cerebral cortex (black) was not annotated or quantified.
Results
Qualitative Histopathology Scoring
Neuronal degeneration was visualized by staining with an AmCuAg stain in both KA- and saline-treated animals. Kainic acid exerted global toxicity involving multiple brain structures, whereas qualitative histopathology scores indicated there was no silver deposition in saline-treated animals (Figure 4). The extent of degeneration due to KA neurotoxicity appears to be asymmetrical when same regions were compared in 2 hemispheres in an animal.
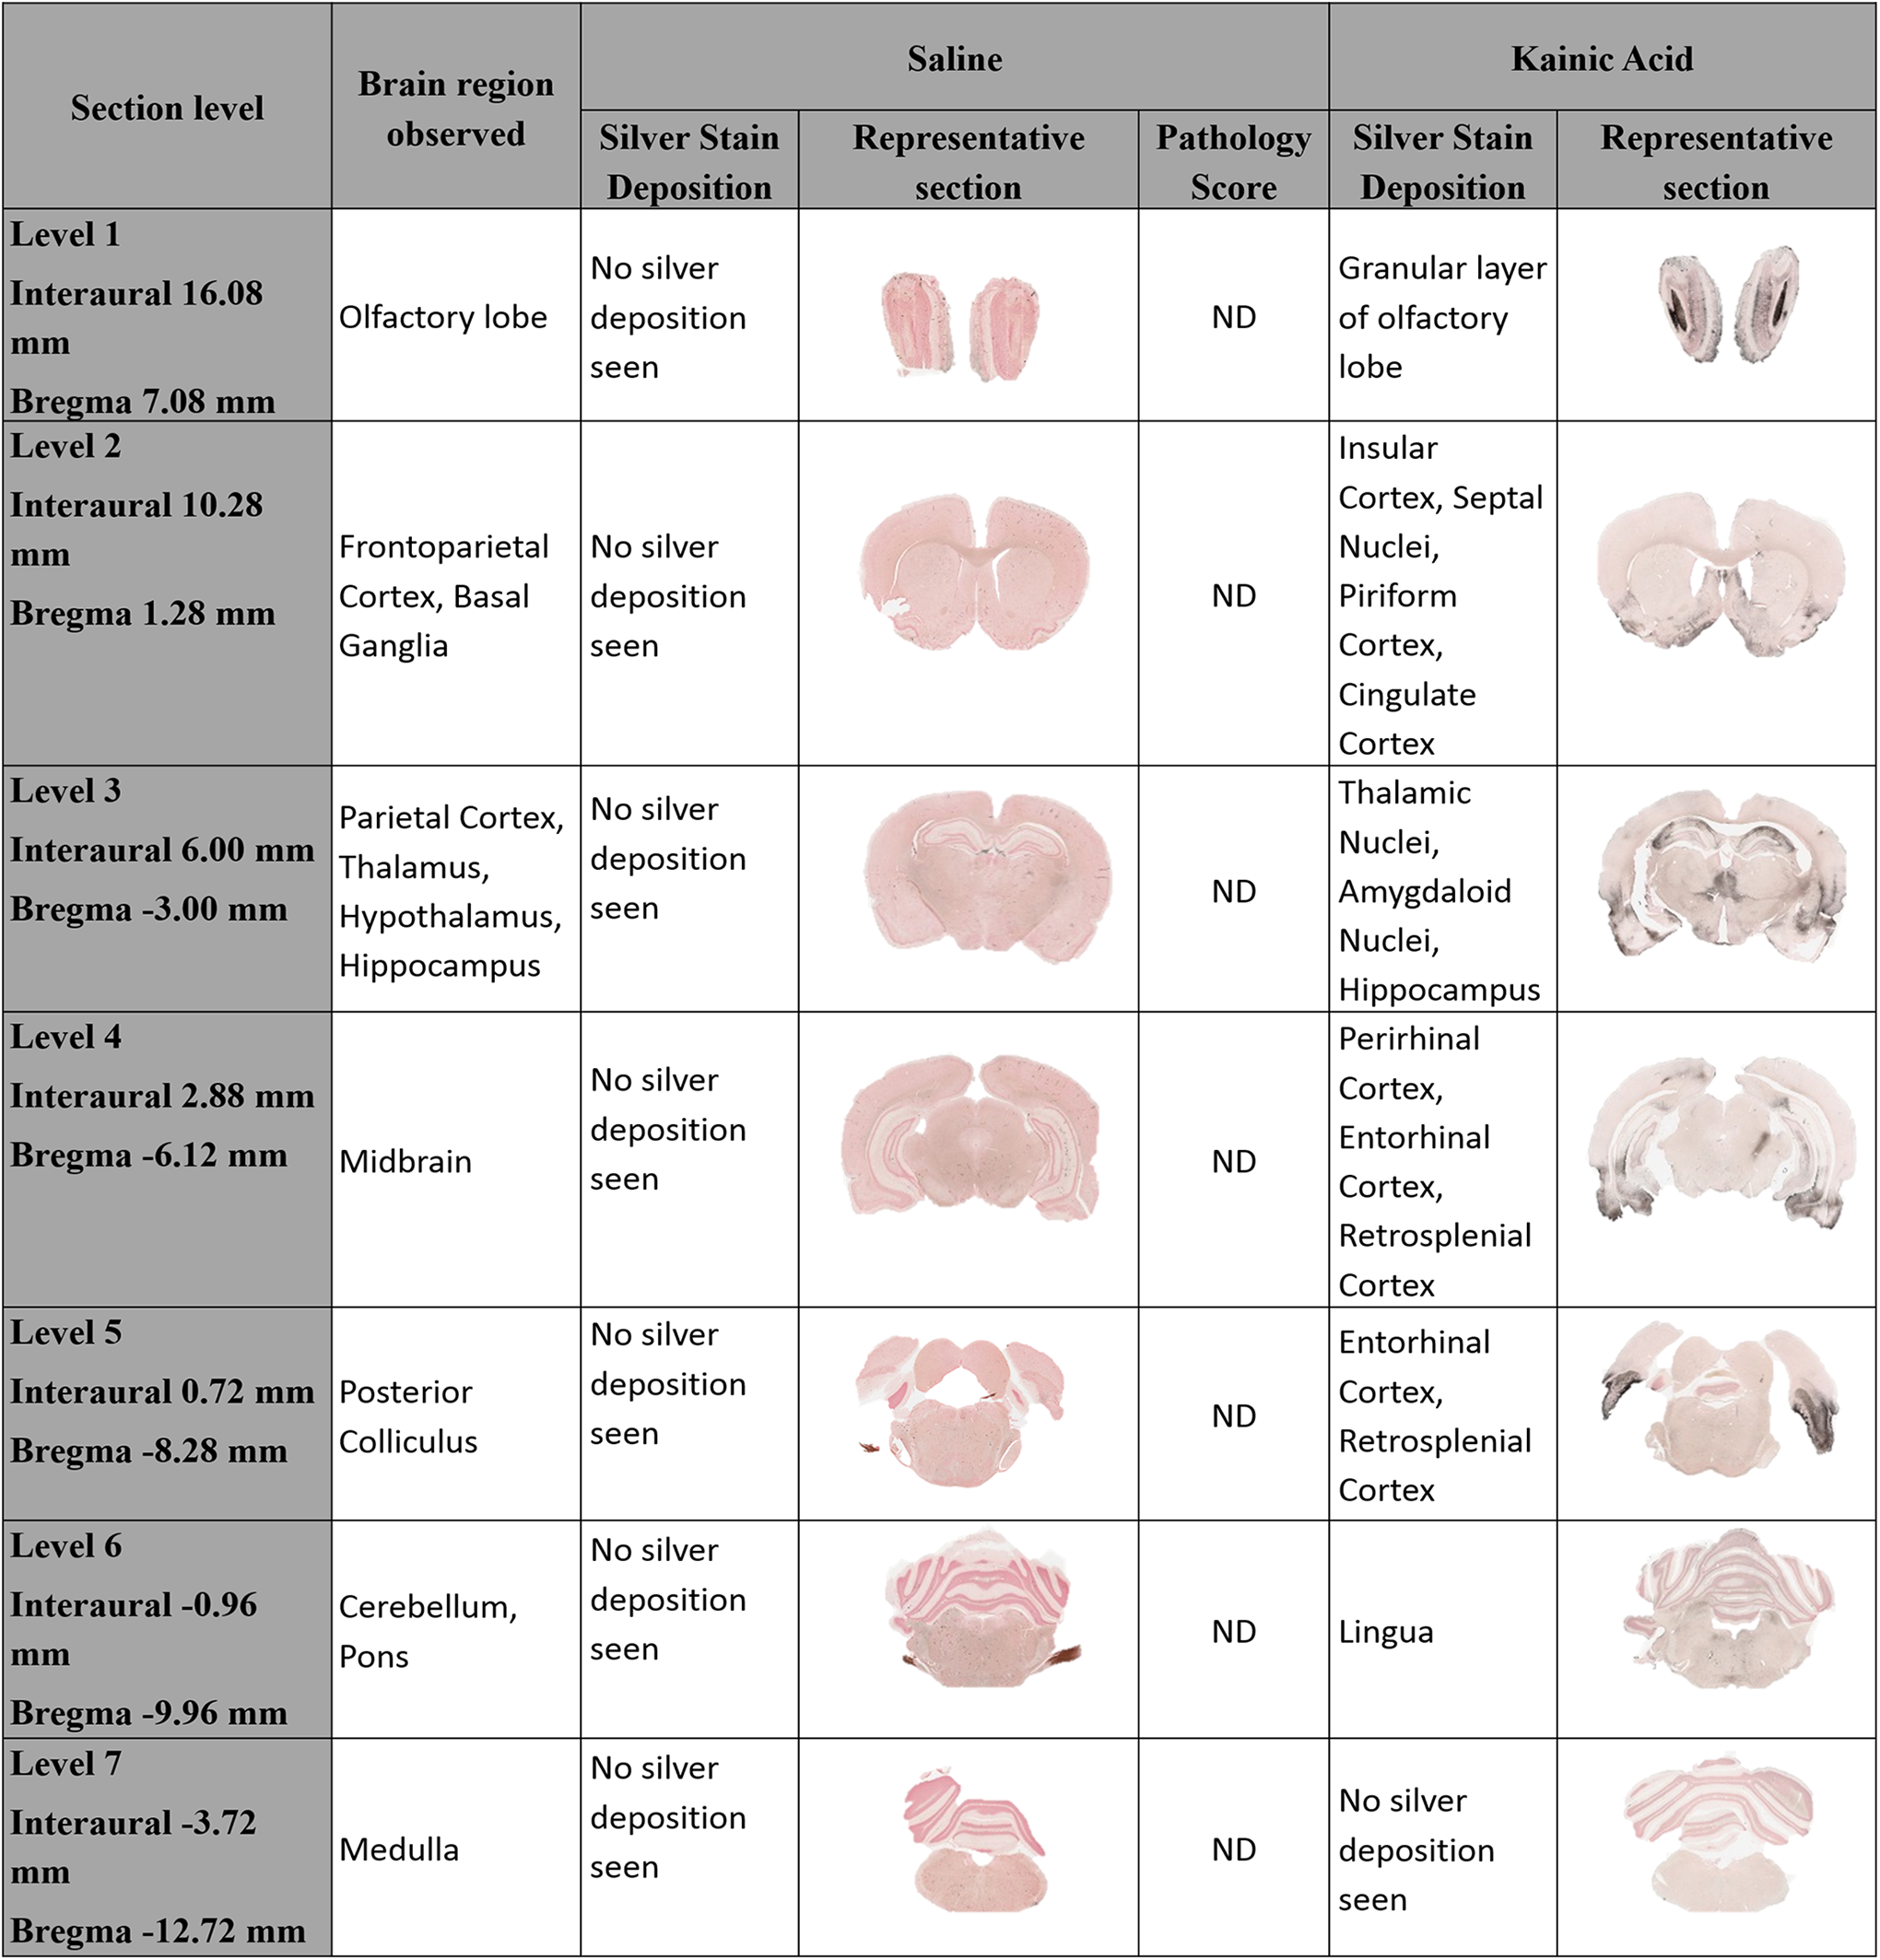
Comparison of representative images of amino-cupric silver (black) stained brain sections from saline- and kainic acid (KA)–treated animals showing different cortical and subcortical structures. Cupric-silver staining shows degeneration (black) in the KA-treated animals but no degeneration in the corresponding areas in saline controls. Specific degenerated areas in the KA-treated brain sections are also shown.
Cerebral cortex
Kainic acid exposure resulted in altered morphology of some cortical pyramidal neurons. Portions of the cerebral cortex exhibited a patchy distribution of silver labeling with relatively extensive labeling of the infralimbic, prelimbic, insular, piriform, ectorhinal, entorhinal, perirhinal, orbital, and cingulate cortices. Interestingly, motor and somatosensory areas were minimally affected, except in 1 animal (Table 1).
Severity of Brain Degeneration for Important Cortical Areas Shown on a 4-Point Scale (1 [Minimal], 2 [Mild], 3 [Moderate], 4 [Marked]).a
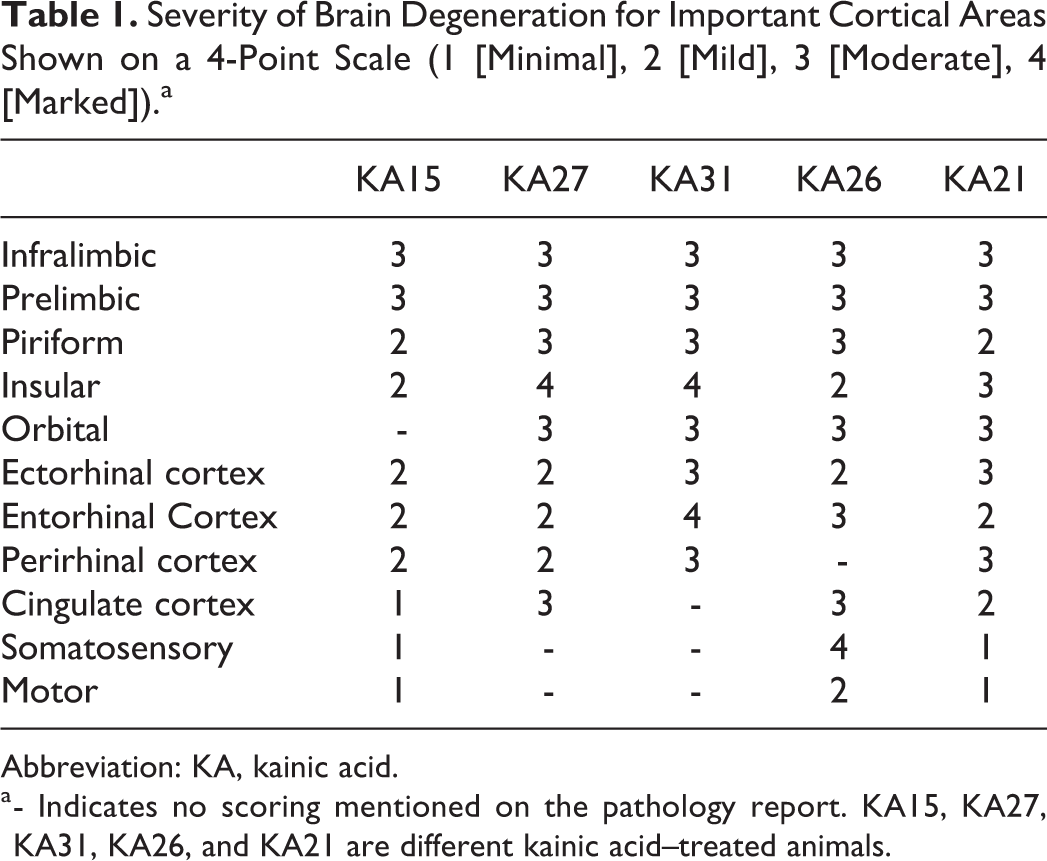
Abbreviation: KA, kainic acid.
a - Indicates no scoring mentioned on the pathology report. KA15, KA27, KA31, KA26, and KA21 are different kainic acid–treated animals.
Olfactory bulb and olfactory nucleus
Most of the animals evaluated showed marked degeneration in the olfactory bulb and olfactory nucleus compared to other areas in the olfactory region. Degeneration was primarily found in the granule cell layer of the olfactory bulb (Table 2).
Severity of Brain Degeneration for Different Brain Areas Shown on a 4-Point Scale (1 [Minimal], 2 [Mild], 3 [Moderate], 4 [Marked]).a
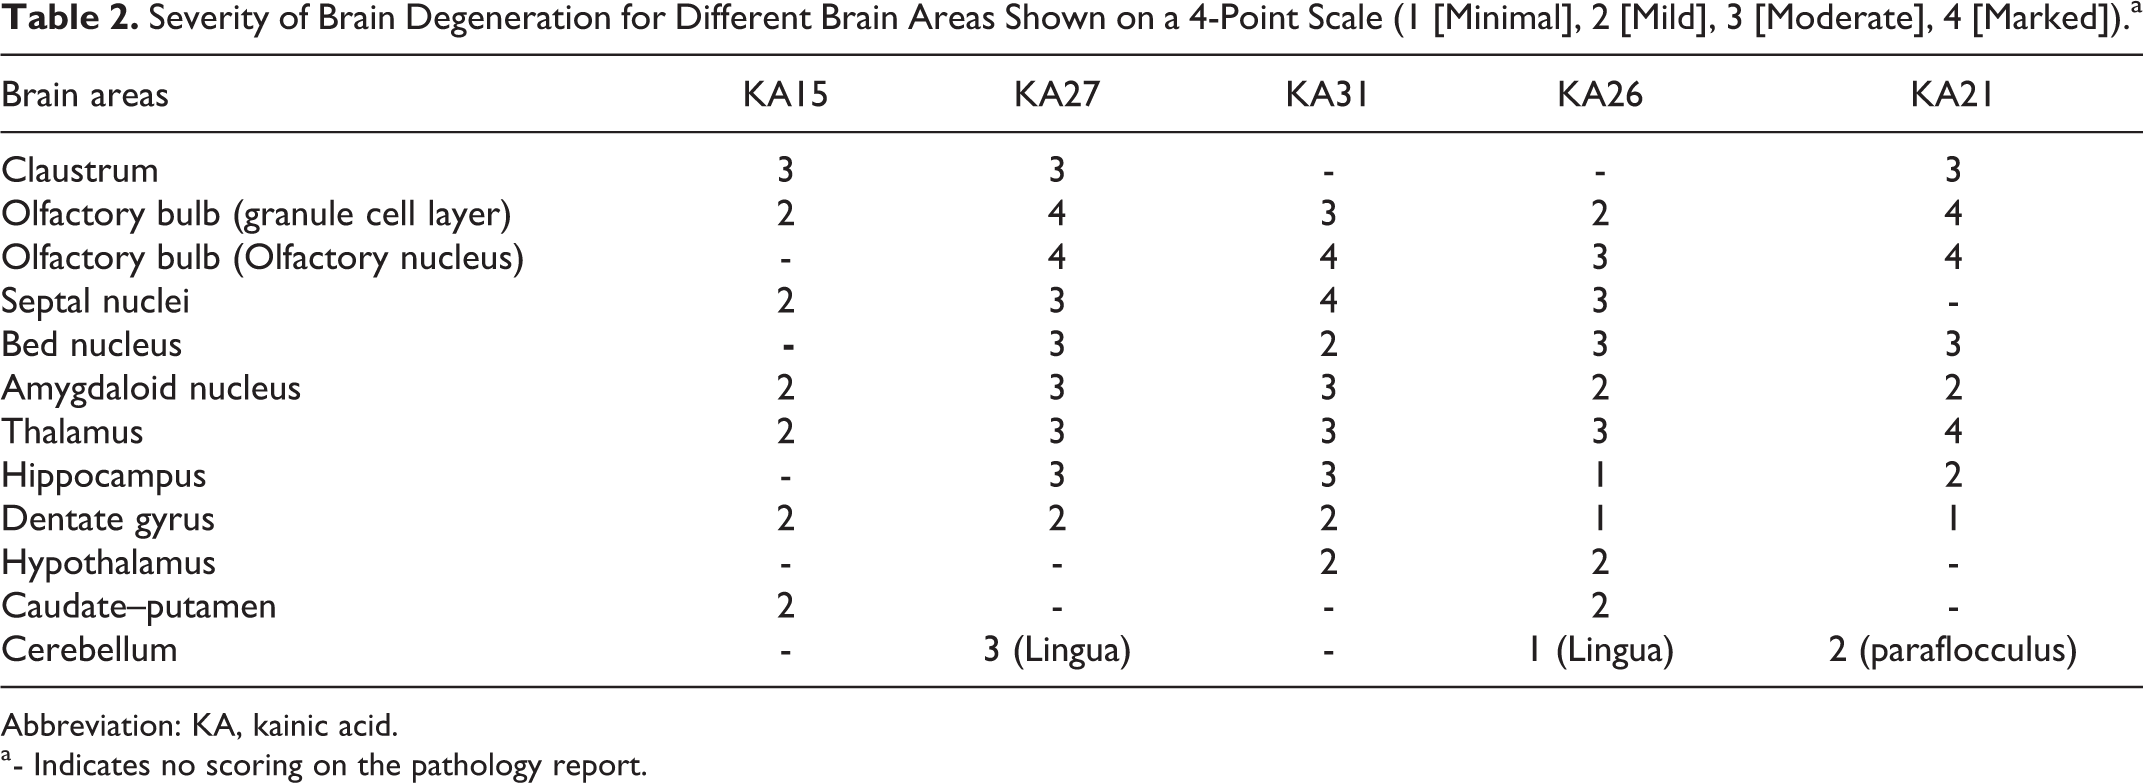
Abbreviation: KA, kainic acid.
a - Indicates no scoring on the pathology report.
Amygdaloid nuclei
The amygdaloid nuclei were consistently found to show degeneration in all the KA-treated animals (Table 2).
Thalamus
Rats treated with KA showed toxicity in various nuclei within the thalamus, but some nuclei exhibited distinctly greater toxicity. The rostromedial thalamus and geniculate nuclei showed relatively more degeneration than surrounding regions in the thalamus (Table 2).
Hippocampus
The dentate gyrus was found to have greater degeneration than other structures within the hippocampus (Table 2).
Claustrum and septal nuclei
Two important brain structures which showed extensive labeling with silver stain in KA-treated animals were the claustrum and septal nuclei (Table 2).
Bed nucleus stria terminalis
The bed nucleus stria terminalis showed mild to moderate degeneration upon pathological examination, except for 1 animal, KA15, which had no observable staining (Table 2).
Caudate–putamen
Silver labeling in the caudate–putamen of KA-treated animals was inconsistent in 2 rats showing degeneration while the remaining 3 did not (Table 2).
Hypothalamus
Silver labeling in the hypothalamus of KA-treated animals was inconsistent in 2 rats showing degeneration while the remaining three rats did not (Table 2).
Cerebellum
Kainic acid–induced toxicity in the cerebellum was restricted to the lingula in 3 animals, whereas most of the remaining cerebellar tissue was spared in all others (Table 2).
Quantitative Examination
Overall toxicity quantification in KA-treated rat brains
A variety of statistically significant differences in silver stain were found between KA-treated rats and saline-treated rats. The mean percentage area of degeneration for the complete brain was calculated for the KA and control rats. The percentage of degeneration in KA-treated rats was found to be 6.77% ± 1.51% compared to 0.31% ± 0.08% in saline-treated rats (P < .05; Figure 5) Results are shown as mean ± standard error of mean.
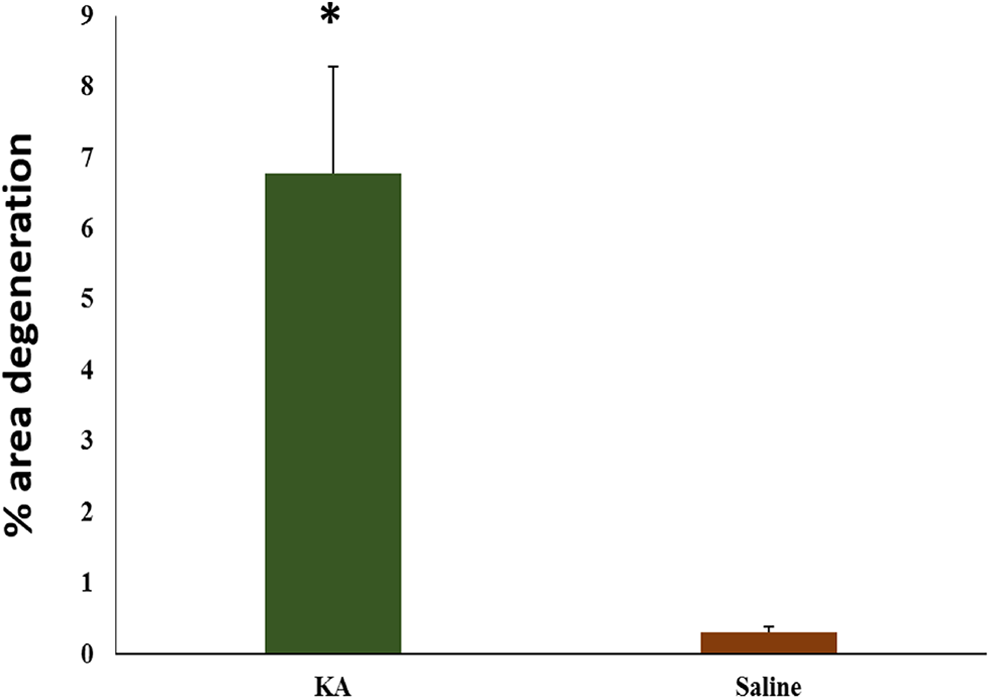
Mean percentage area of degeneration for the complete brain in kainic acid (KA)–treated rats when compared to saline controls.
Kainic acid toxicity within different brain regions
Degeneration was found to be generally global in KA-treated rats, but certain brain regions were more affected than others. To describe the differential damage within the brain, 10 different areas were separately quantified from the 81 coronal sections. The cerebral cortex, nucleus accumbens, septal nuclei, olfactory, and amygdala were more affected upon KA treatment with the percentage of degeneration greater than 10%. Other brain regions such as the caudate–putamen, thalamus, hippocampus, hypothalamus, and the substantia nigra showed less degeneration. Saline-treated rats exhibited 1% or less degeneration in all brain areas quantified. This is significantly less than that observed for the KA-treated rats, where only substantia nigra did not reach statistical significance (Table 3). Damage in the cortical areas was primarily localized to the insular, piriform, and cingulate cortices, but in animals showing severe degeneration, other cortical areas such as the motor cortex and somatosensory cortex were also involved (Figure 6). Olfactory areas showed degeneration primarily in the granule cell layer and rostral olfactory area. The plexiform layer was also affected in some KA-treated animals (Figure 7). Kainic acid leads to hippocampal damage with effects mainly in the CA1, CA3 region, and dentate gyrus (Figure 8). The rostromedial and medial geniculate thalamus showed more degeneration than other regions of the thalamus. Within the thalamus, the rostral and medial geniculate thalamus showed more degeneration than the rest of the thalamus (Figure 9). Pathology scores were generally in accordance with the quantification results with a few notable exceptions, including the hippocampus and septal nuclei in 1 animal (KA21).
Quantitative Data: Mean Percentage Area Degeneration (±SEM) Within Different Brain Structures (Percentage Degeneration Within a Brain Area, Averaged for All Sections Containing that Area and Further Averaged Across all animals for that Area) in KA and Saline-Treated Rats.a
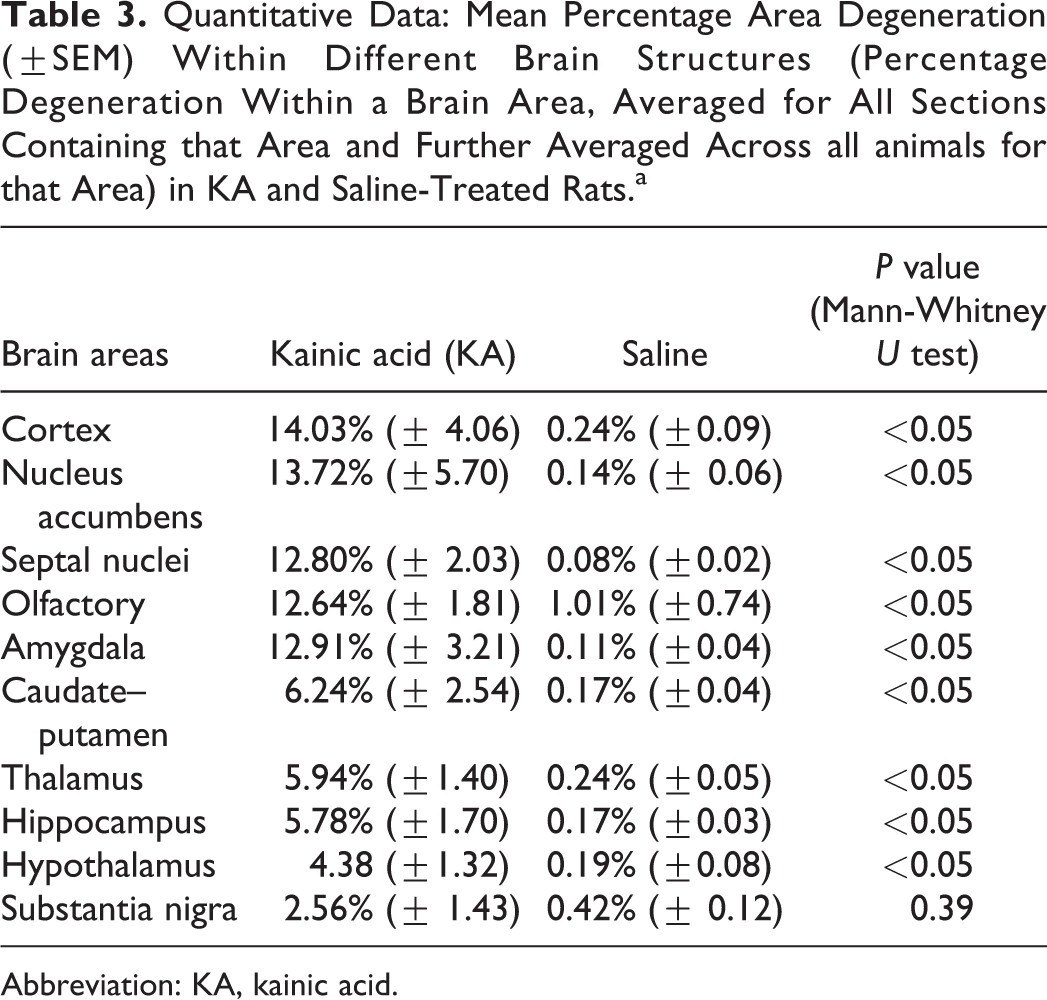
Abbreviation: KA, kainic acid.
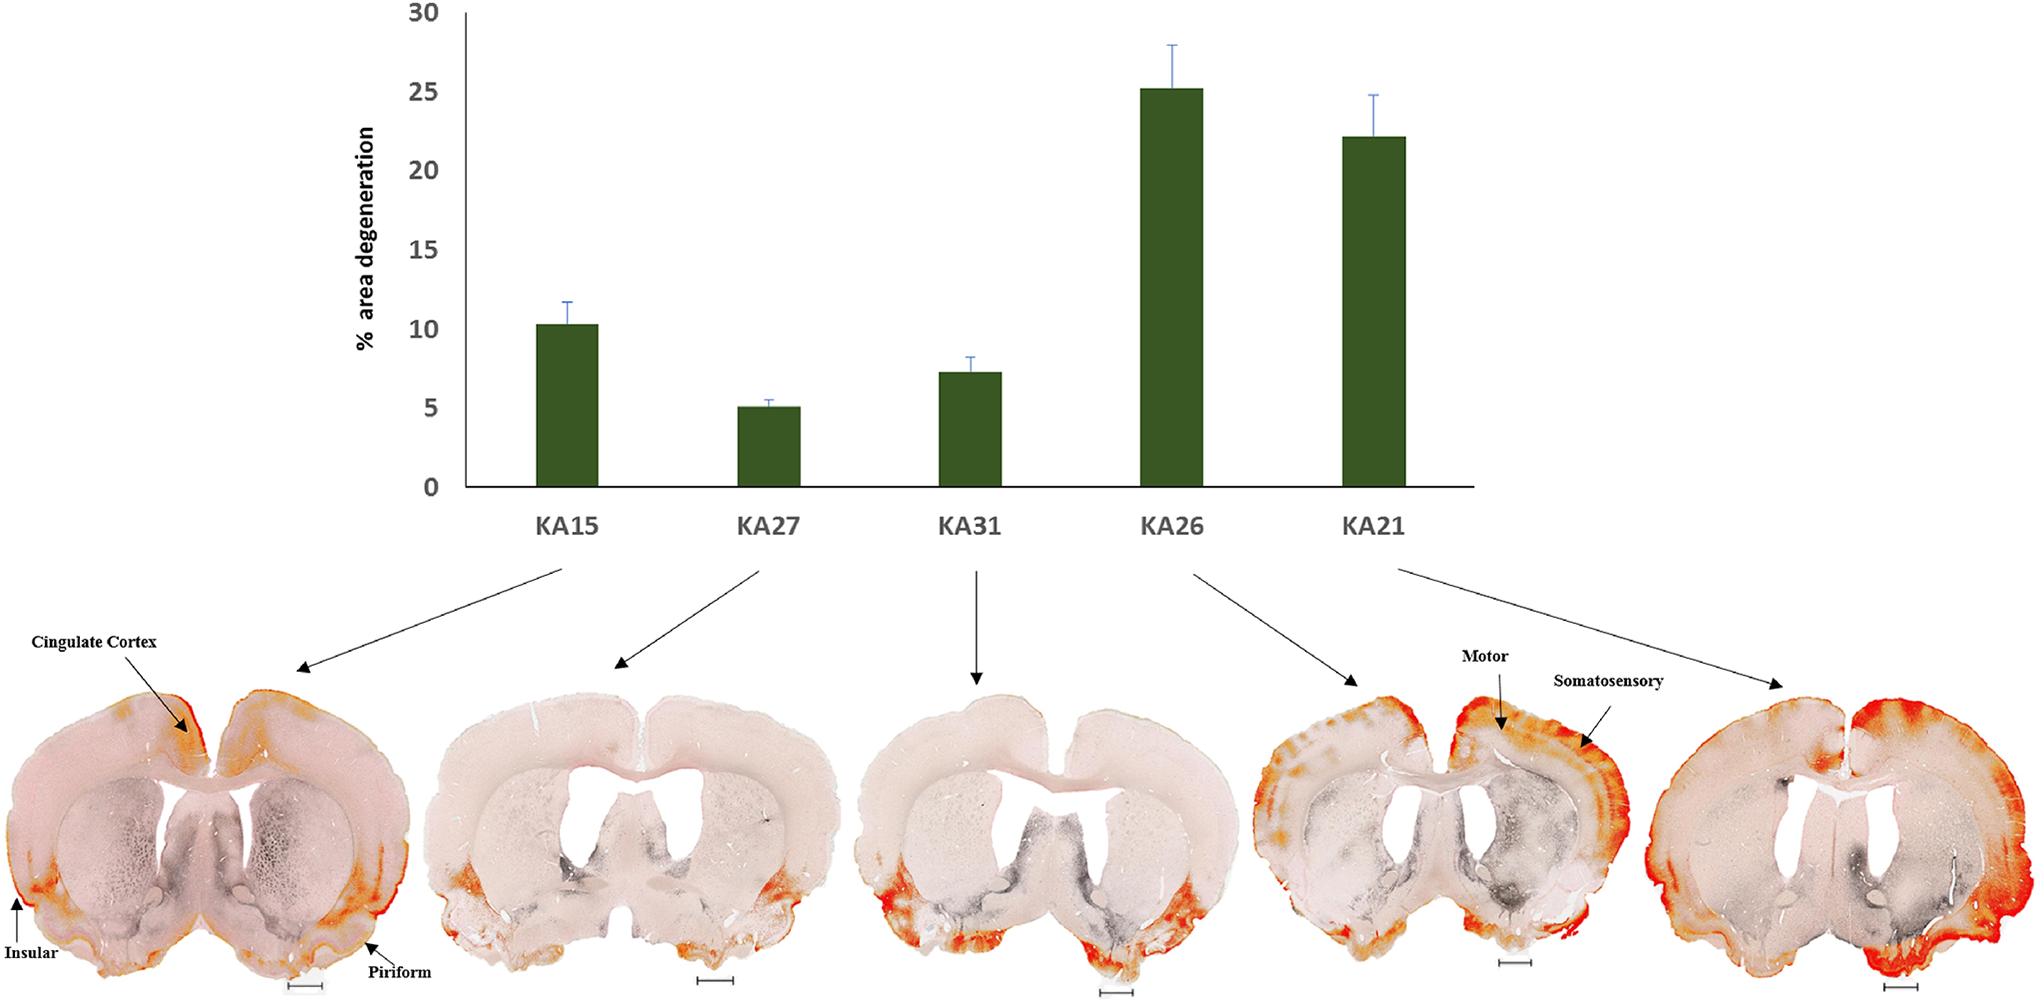
Bar graph representing the mean percentage area of degeneration in the cerebral cortex for different kainic acid (KA)-treated animals. Representative images from each animal showing cortical degeneration (red) after area quantification. Degeneration was mainly observed in the insular cortex and piriform cortex. In animals with more severe degeneration, the motor cortex and somatosensory cortex were also affected. Bregma: 1.08-0.12 mm; Interaural: 10.08-9.12 mm; scale bar: 1.00 mm.
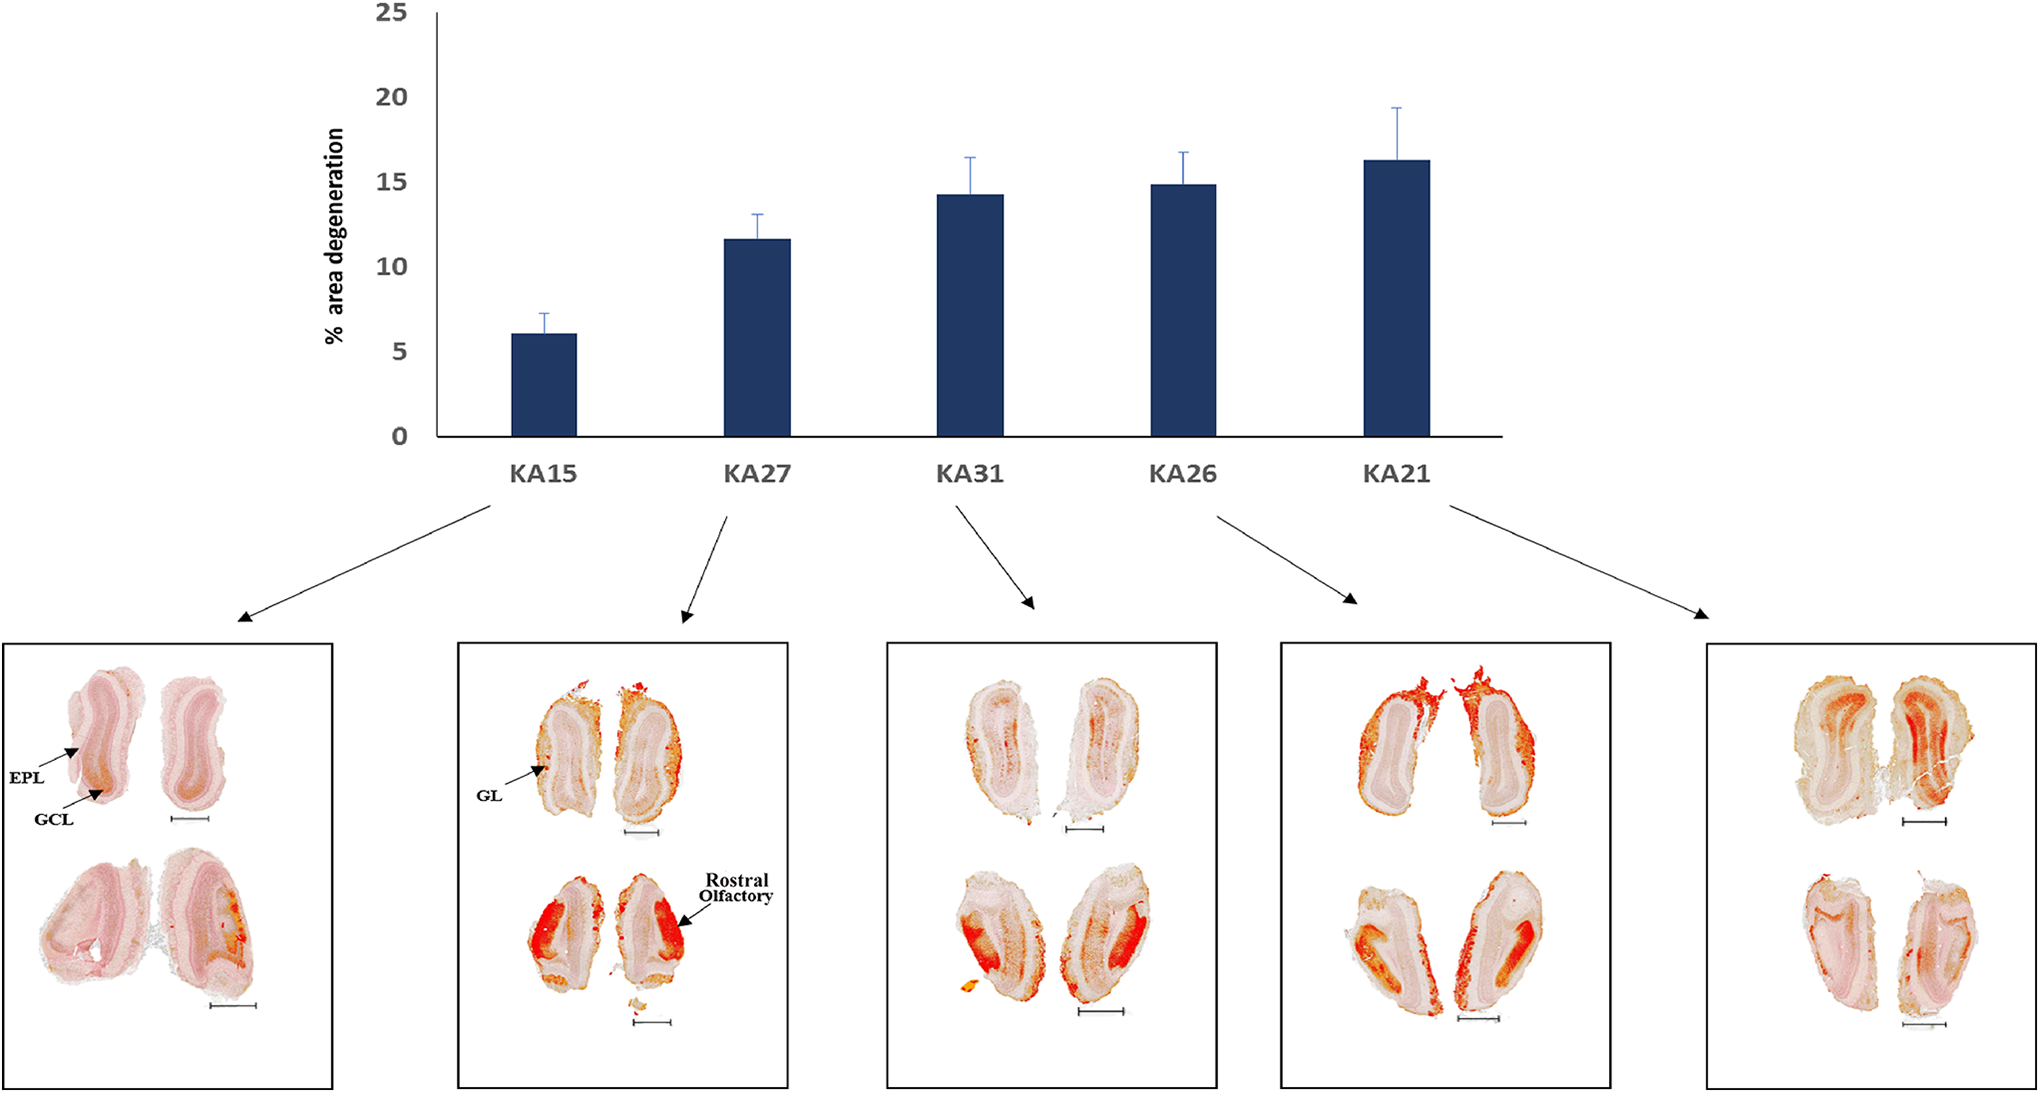
Bar graph representing the mean percentage area of degeneration in the olfactory region for different kainic acid (KA)–treated animals. Representative images from each animal showing cortical degeneration (red) after area quantification. Degeneration was mainly observed in the granule cell layer and rostral olfactory area. Bregma: 7.56-6.60 mm; Interaural: 16.56-15.60 mm; scale bar: 1.00 mm. EPL indicates external plexiform layer; GCL, granule cell layer; GL, glomerular layer.
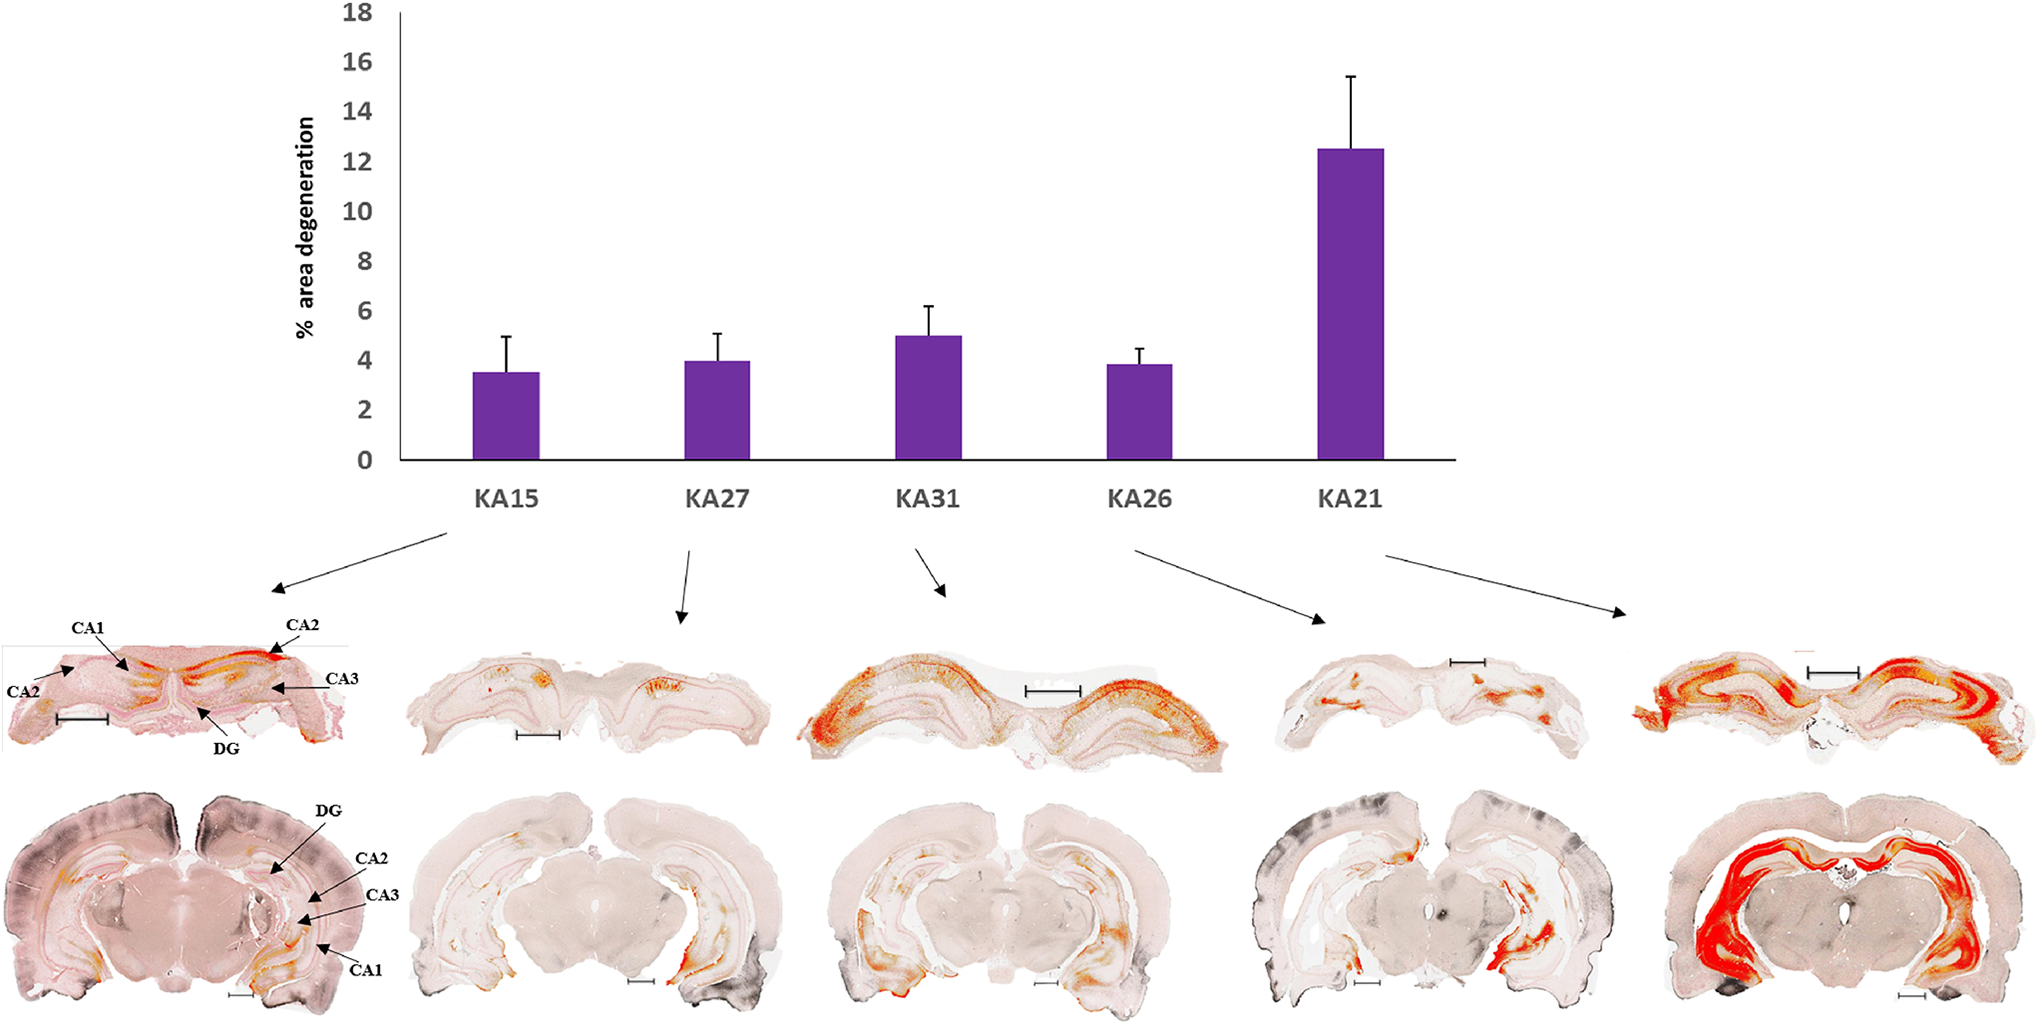
Bar graph representing the mean percentage area of degeneration in the hippocampus for different kainic acid (KA)-treated animals. Representative images from each animal showing cortical degeneration (red) after area quantification. Degeneration was mainly observed in CA1, CA3, and the dentate gyrus regions. Bregma: −1.92 to −8.40 mm; Interaural: 7.08-0.60 mm; Scale bar: 1.00 mm. DG indicates dentate gyrus.
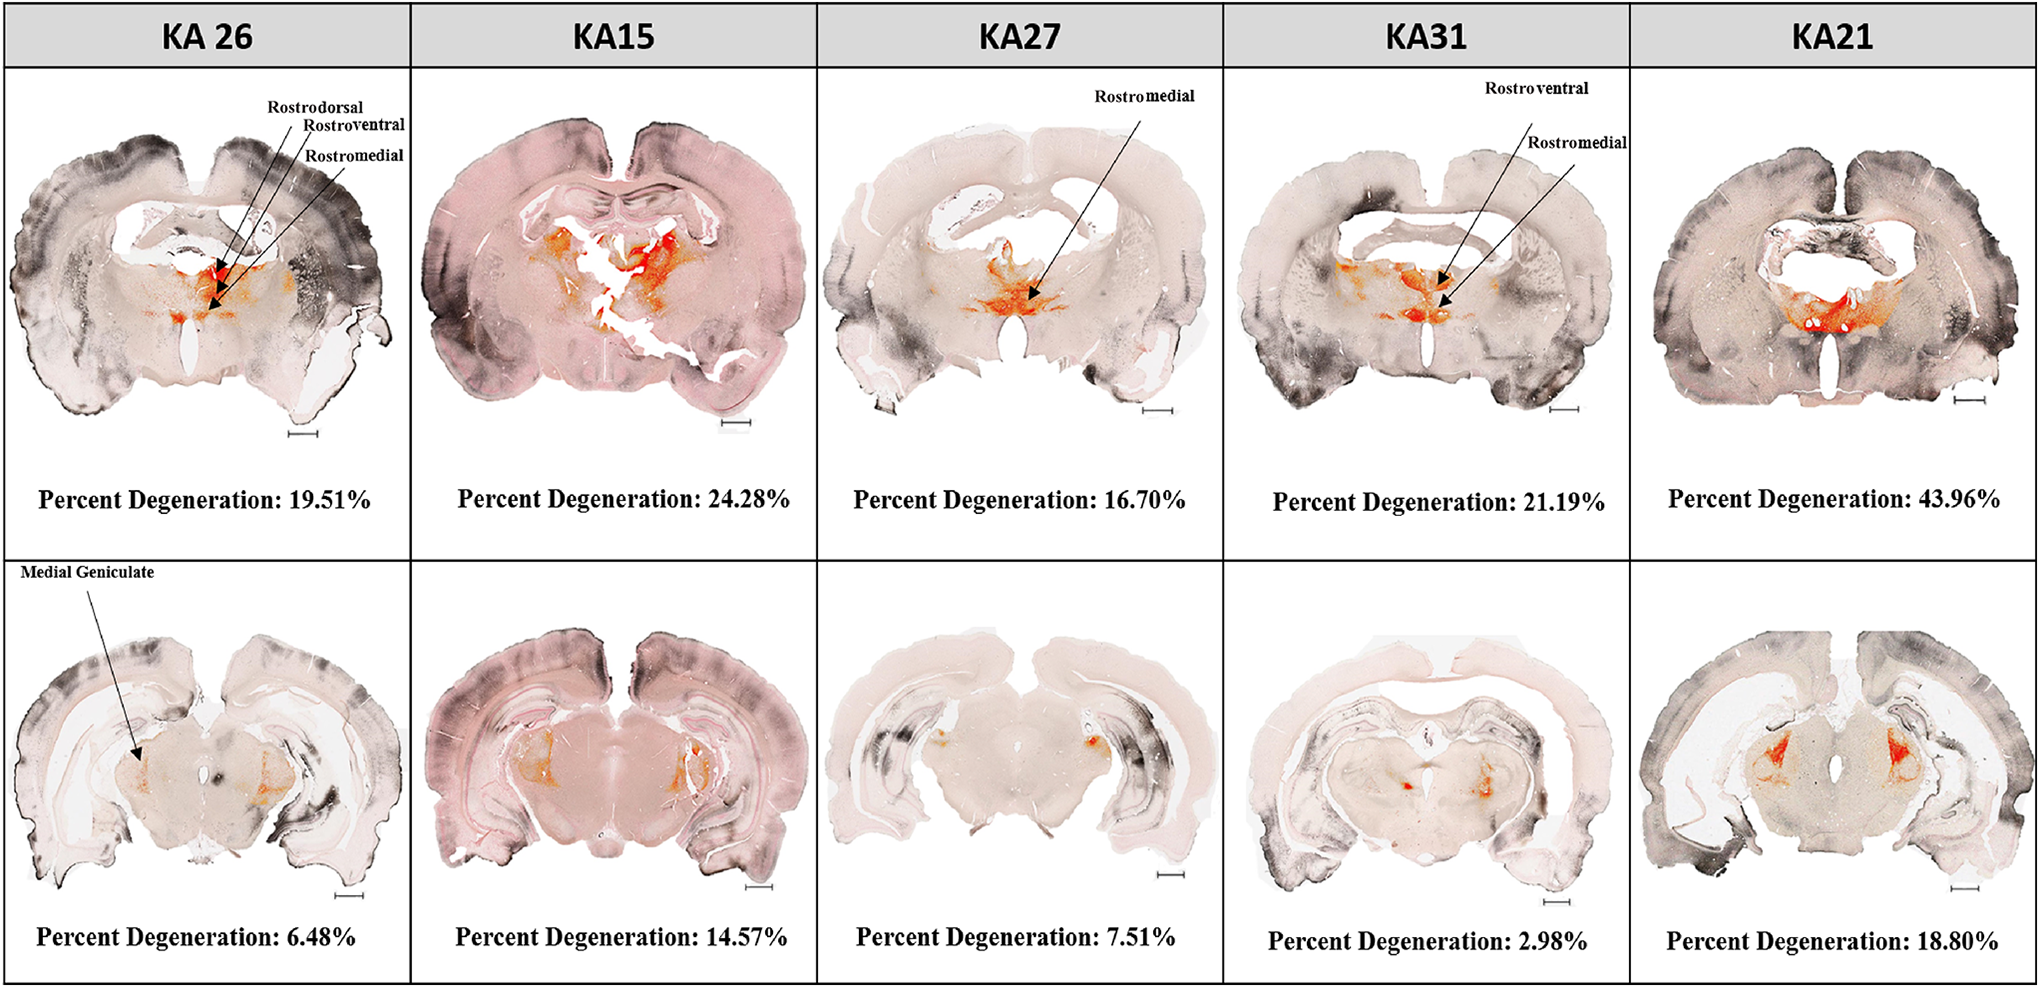
Representative images of the thalamus showing degeneration (red) in the rostral thalamus and medial geniculate nucleus after area quantification. Bregma: −1.32 to −5.64 mm; Interaural: 7.68-3.36 mm; Scale bar: 1.00 mm. The degenerated area outside the thalamus (black) was not annotated or quantified. The rostral thalamus showed higher degeneration as compared to the medial geniculate for all kainic acid (KA)-treated animals.
Discussion
Kainic acid is a strong neuroexcitatory compound 24 and an established tool for modeling excitotoxicity. 8 Kainic acid–mediated neuronal death occurs due to the stimulation of glutamate receptors which leads to increased intracellular calcium, resulting in production of free radicals that cause mitochondrial dysfunction and neuronal necrosis. 6 Previous studies have reported several histopathological findings following KA administration in rats. Our results are consistent with previous reports regarding the global pattern of degeneration due to KA toxicity. 5,8,25 Widespread neuronal damage was observed particularly in the piriform cortex, amygdala, septal nuclei, thalamus, hippocampus, and olfactory area.
Previous studies on KA toxicity have focused on objective metrics of neural damage using nonquantitative or semiquantitative methods: There has been little effort to describe KA toxicity in the rat brain using area quantification. The current study quantified KA toxicity by measuring overall global brain toxicity as well as toxicity within specific structures. Quantification of global brain damage induced by KA showed that about 7% of the total neuronal tissue of the brain is affected. This suggests that a large amount of brain is spared or very little affected; thus, damage is not detected by silver stain. This type of result can be important when trying to create a toxicity profile for KA following specific doses and lengths of time from exposure to assessment. Quantification of KA-induced toxicity in terms of temporal patterns after a variety of doses could provide better and a more precise identification of correlations between neuropathology and observed behavioral and cognitive effects.
The data presented here demonstrate that the cerebral cortex, amygdala, septum, and olfactory bulb are more affected than are the cerebellum, caudate putamen, substantia nigra, and hypothalamus. While previous studies have also shown differential brain region sensitivity to KA, 17 none have quantified toxicity either globally or within specific structures. Area quantification in the current study shows that the percentage of sensitive brain structures adversely impacted by KA is generally below 15%, showing that to a larger extent such structures remain intact. The current results are also in accordance with the previous studies 8,16 suggesting that KA leads to damage in primary targets such as hippocampus, amygdala, thalamus, and to secondary targets such as the frontal cortex and septal nuclei that receive projections from those primary targets.
The present findings showed large variability in the KA effect among animals: Some showed severe degeneration while other much less. While there is no established explanation for the noted individual variability in sensitivity to KA, it likely involves differences in injection delivery, absorption, distribution, metabolism, and excretion of the compound. Another important factor that can account for variability among different animals could be depth of anesthesia or effect of anesthesia. Different levels or depths of anesthesia modulate blood flow in the brain. 26 Since the amount of oxygen available to the brain is regulated mainly by cerebral blood flow and vascular distribution, this could lead to changes in the level of KA penetrating different regions and influencing responses. With respect to the differential sensitivity of the various brain regions to KA toxicity, factors such as glutamate receptor density and affinity likely pertain as well as differences in oxidative stress, free radical generation, 27 -30 mitochondrial dysfunction, 31 glia activation, 32 -38 cytokine expression, 39,40 and altered synaptic connectivity. 41 -44 One aspect concerning area-specific vulnerability to KA degeneration could be differences in neurovascular coupling. 45 These differences may lead to different tissue oxygenation and neuronal activity, making some areas more vulnerable to KA toxicity when compared to others.
The current findings are of interest in that they show important motor movement related areas are not severely affected by KA treatment as revealed by silver stain. For example, caudate putamen, substantia nigra, and cerebellum are not affected much by KA. This suggests that the specific functional modality of locomotion is spared from KA, likely because of the amount and nature of glutamate/kainate receptors 19 in motor areas. Further studies are required to understand the relationship between location of glutamate/kainate receptors and KA neurotoxicity.
The findings reported here show that the rostromedial thalamus is a very sensitive structure to KA toxicity and is of interest: Almost 48% of the total thalamic degeneration is found here. Previous studies have shown that KA-induced seizures 46 -49 were reduced after lesioning and electrical stimulation of the rostral (anterior) thalamic nucleus. 50 Histopathological changes in the KA-treated brain tend to occur in functional networks rather than diffused randomly. In the present study, degeneration following KA treatment is found primarily in structures that are part of the functional cortico–limbic–striatal circuitry (Figure 10). 51,52
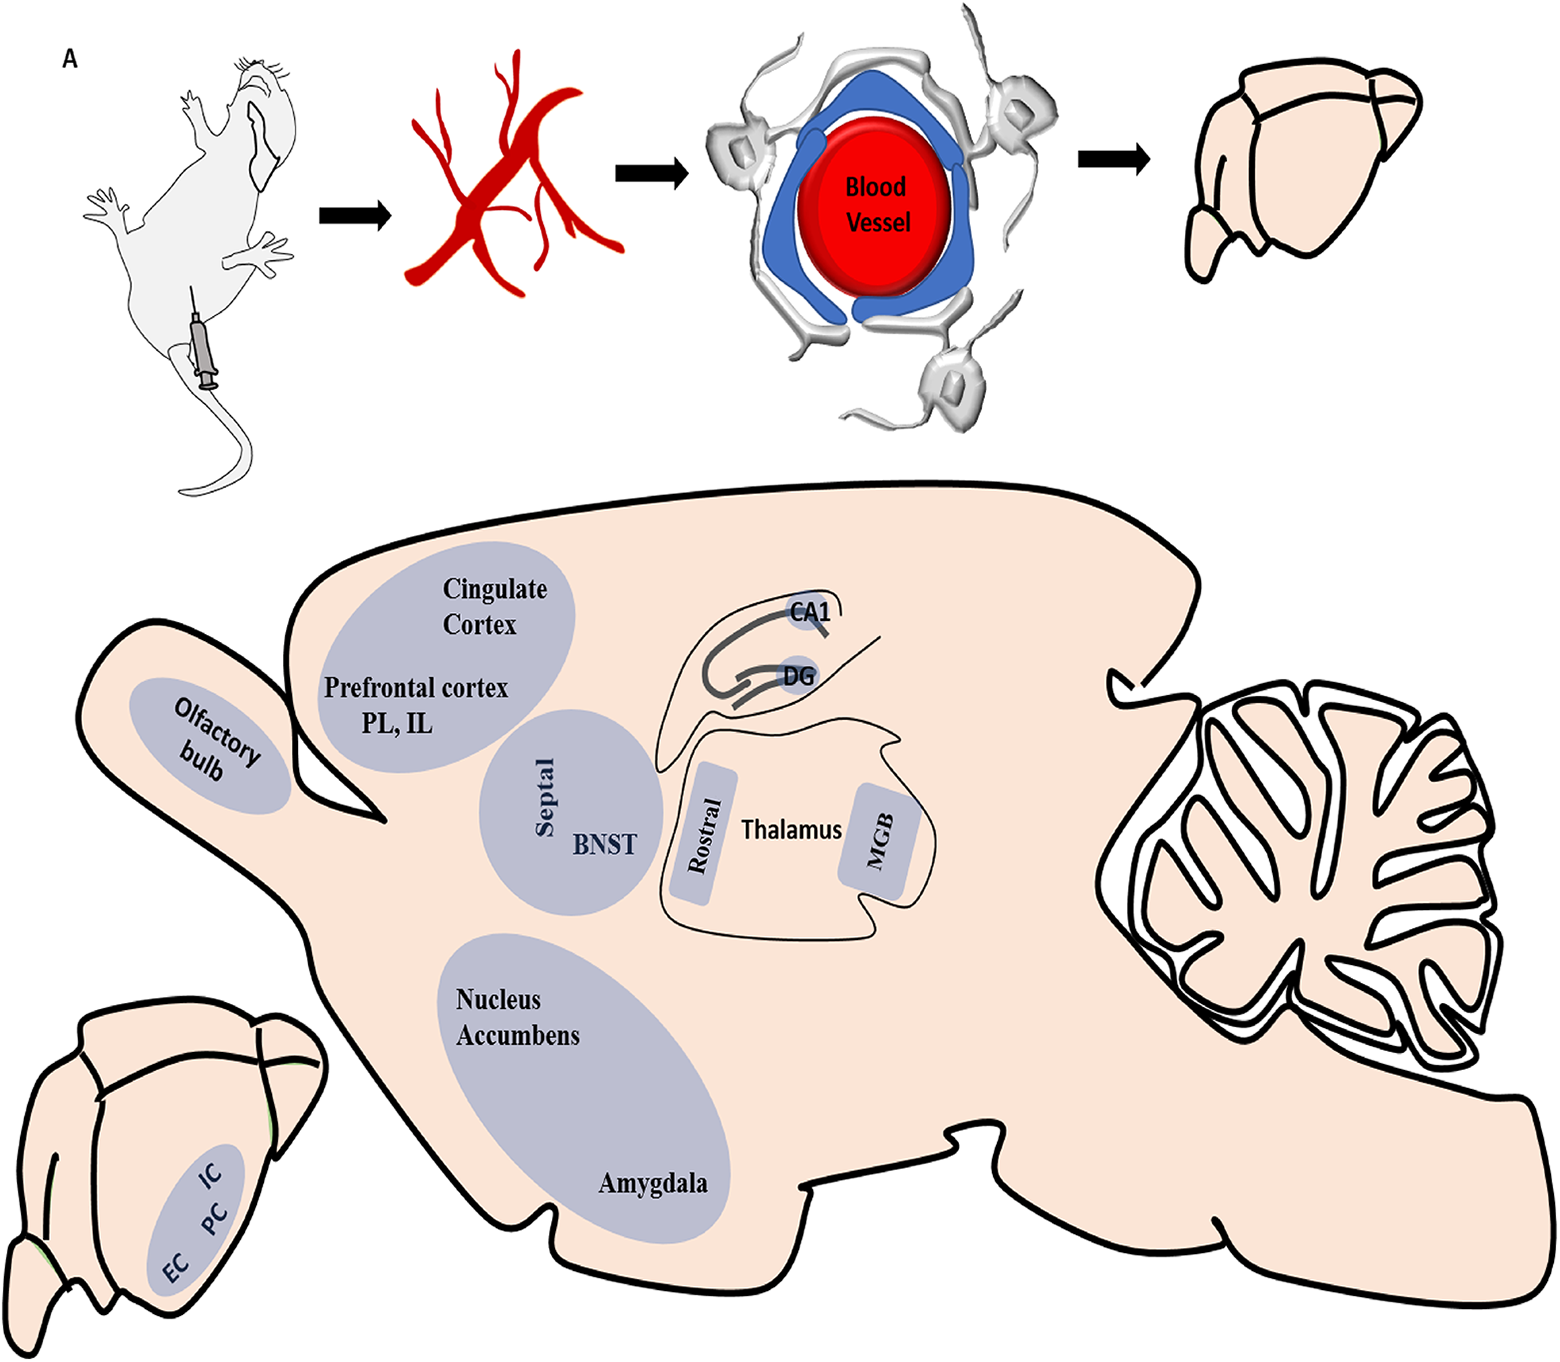
Brain structures affected by kainic acid (KA) toxicity. A, Intraperitoneal injection of KA. B, KA enters the blood for circulation. C, KA crosses the blood–brain barrier and (D) reaches the brain. E, KA toxicity affects different brain structures, which are part of the cortico–limbic–striatal circuitry. BBB indicates blood–brain barrier; BNST, bed nucleus stria terminalis; EC, entorhinal cortex; DG, dentate gyrus; IC, insular cortex; IL, infralimbic cortex; MGB, medial geniculate body; PC, piriform cortex; PL, prelimbic cortex.
The prelimbic (PC) and infralimbic cortex (IC) are part of the medial prefrontal cortex, an important component of cortico–limbic–striatal circuitry. The PC and IC receive inputs from the hippocampus, amygdala, and entorhinal cortex and have connections with the nucleus accumbens, insular cortex, and anterior cingulate cortex. 53,54 The piriform cortex is another important structure of this circuitry and has connections with the olfactory bulb, amygdala, and entorhinal and frontal cortices. 55 The piriform cortex has connections with the insular cortex in the rhinal sulcus which has reciprocal connections with the anterior cingulate, amygdala, bed nucleus of the stria terminalis, hypothalamus, medial prefrontal cortex, hypothalamus, nucleus accumbens, and orbital cortex. 56,57 The anterior cingulate of the frontal cortex receives inputs from, and projects to, the claustrum. The claustrum is an elongated structure that is located around the rostral part of the telencephalon. It also receives inputs from the insular cortex. 58 The bed nucleus of the stria terminalis receives input from the amygdala and insular cortex and also has connections with the hippocampus. 59 These structures have been shown to be involved in a network that underlies learning and memory processing, limbic information, and behavioral and cognitive functions. 60 Kainic acid–induced injury to this specific circuitry suggests that KA exposure can lead to learning and memory deficits, anxiety, post-traumatic stress disorder, and epilepsy.
The traditional pathology scores obtained in the current study were generally in accordance with the quantitative neuropathological metrics for the brain areas assessed, except for a few instances. The pathology scores for the hippocampus and septal nuclei were lower in animal KA21 when compared to the quantitative analysis assessment. Differences between pathology scores and the quantified results may, in some cases, be due to the pathologist’s general consideration of individual sections and scoring them based on the severity of damage they observe in those sections. On the other hand, the quantification approach used in the present study considers all the sections corresponding to a given brain structure and calculates an average percentage degeneration. This is an important distinction because severe damage in one animal compared to others, as indicated by traditional pathology scores, may show equivalent severity to other animals when assessed according to a quantification approach. Thus, one of the advantages of the quantification method over traditional pathology scoring is that it takes into consideration the overall damage to a given brain area rather than scoring certain sections for severity. This can become very important when interpreting study results based on traditional pathology severity scores alone and when quantitative analyses are also available since quantitative analysis will likely provide a more complete picture.
One of the limitations of the current study was the use of simple color thresholding approach to evaluate toxicity as such an approach cannot differentiate between genuine silver deposition due to neurodegeneration and nonspecific artifactual or background staining. Also, quantification of neurodegenerated area includes both cell bodies and disintegrating neurites, so future studies could focus on counting degenerated cell bodies to account for a more precise neuronal death. Moreover, silver staining is generally not able to detect damage to white matter and follows the life cycle of the neurodegeneration. Additionally, diverse ways of selecting sections for quantifying neurotoxicity can also impact data analysis, and comparison of random versus nonrandom assessment of sections based on anatomical landmark should be explored.
There was substantial similarity in the range of involved structures among KA-treated animals. Variability in sensitivity related to age, weight, sex, and strains of rats were not factors in the current study since these were essentially the same in all the animals. Behavioral correlates such as seizure scoring has not been performed in this current study. Different sections adjacent to each other corresponding within a specific region show disparity in KA toxicity within an animal.
Conclusion
Classical histopathological analysis is currently the “gold standard” when describing and identifying pathological changes, but interpretation relies on subjective estimation by the reviewing pathologist. Quantitative image analysis has the potential to increase precision and accuracy and reduce bias, cost, and assessment time, thus significantly and positively impacting research and diagnostic medicine. Histopathological analysis using image-processing methods can be very useful for qualitative purposes. For example, locating pathological features including neurodegeneration. This can be then followed by quantitative measurements. Quantitative neurotoxicity using digital image analysis adds a significant new component to the research toolbox for studying neurodegeneration and its behavioral implications.
Footnotes
Authors’ Note
The content of this publication represents solely the authors’ views and may not reflect any position of the U.S. Government or the Food and Drug Administration.
Author Contribution
A. Srivastava contributed to analysis and interpretation, drafted manuscript, and critically revised the manuscript; S. Liachenko contributed to conception and critically revised the manuscript; S. Sarkar contributed to acquisition and critically revised the manuscript; M. Paule contributed to design and critically revised the manuscript; G. Negi contributed to analysis and critically revised manuscript; J.P. Pandey contributed to analysis and critically revised the manuscript; J.P. Hanig contributed to conception and design, acquisition, analysis, and interpretation; drafted the manuscript; and critically revised the manuscript. All authors gave final approval and agree to be accountable for all aspects of work ensuring integrity and accuracy.
Declaration of Conflicting Interests
The author(s) declared no potential conflicts of interest with respect to the research, authorship, and/or publication of this article.
Funding
The author(s) disclosed receipt of the following financial support for the research and/or authorship of this article: This study was funded by FDA—Center for Drug Evaluation & Research (CDER) Critical Path Program, CDER Office of Research & Testing, and the National Center for Toxicological Research, Division of Neurotoxicology/FDA (E0741801).