
Abstract
Mixture effects of 3 model endocrine disruptors, prochloraz, ketoconazole, and genistein, on steroidogenesis were tested in the adrenocortical H295R cell line. Seven key steroid hormones (pregnenolone, progesterone, dehydroepiandrosterone, androstenedione, testosterone, estrone, and 17β-estradiol) were analyzed using gas chromatography and tandem mass spectrometry (GC-MS/MS) to investigate the effects throughout the steroidogenic pathway. Current modeling approaches often rely on models assuming compounds acting independently and that the individual effects in some way can be summarized to predict a mixture effect. In H295R cells with an intact steroidogenic pathway, such assumptions may not be feasible. The purpose of this study was therefore to evaluate whether effects of a mixture with differing modes of action followed or deviated from additivity (concentration addition) and whether the H295R cell line was suitable for evaluating mixture toxicity of endocrine disruptors with different modes of action. The compounds were chosen because they interfere with steroidogenesis in different ways. They all individually decrease the concentrations of the main sex steroids downstream but exert different effects upstream in the steroidogenic pathway. Throughout the study, we observed lowest observed effect concentrations of mixtures at levels 2 to 10 times higher than the predicted EC50, strongly indicating antagonistic effects. The results demonstrate that chemical analysis combined with the H295R cell assay is a useful tool also for studying how mixtures of endocrine disruptors with differing modes of action interfere with the steroidogenic pathway and that existing models like concentration addition are insufficient in such cases. Furthermore, for end points where compounds exert opposite effects, no relevant models are available.
Introduction
In risk or hazard assessment of mixtures, there is a need for reliable models to evaluate potential for mixture toxicity as it is not feasible to test all potentially relevant mixtures of compounds we may be exposed to. Furthermore, appropriate in vitro assays with multiple targets and/or intact pathways to evaluate mixtures with multiple targets or modes of action should be a prerequisite. In this article, we evaluate mixture effects of 3 mechanistically differentiated steroidogenic disruptors and evaluate whether effects deviate from expected additivity, for example, concentration addition (CA). 1 –3 Current modeling approaches rely on the assumption that the chemicals in the mixture do not interfere with the effects of each other and as such their individual effects can be summarized in some way using mathematical approaches. 1,2 Additionally, we evaluate whether a human-derived adrenocortical carcinoma cell line (H295R cell line) 4 with an intact and functional steroidogenic pathway secreting steroid hormones in a well-plate format is suitable as an in vitro mixture model and can be basis for conceptual mixture studies.
Endocrine disruption has been the focus of much research over the last decades. Exposure to low amounts of chemicals, which have the potential to interfere with the hormone system, by binding to receptors, altering metabolism or affecting other pathways involved in hormone homeostasis can interfere with the hormonally mediated processes. This in turn affects outcomes as reproduction, development, and other physiological processes 5,6 –these compounds are called endocrine disruptors. One focus area of endocrine disruption research is the work on the steroidogenic pathway that lead to a guideline by the Organization for Economic Cooperation and Development (OECD) for an in vitro screening assay for steroidogenic disruption using human H295R cells 4,7 by evaluating the downstream production of testosterone and estrogen. Further work by several research groups 8 –12 and by the authors 13 have also included multiple steroid hormones in the analysis as compared to the OECD guideline, thereby demonstrating the possibilities of acquiring further mechanistic information from the assay by including analysis of intermediates in the steroidogenic pathway (Figure 1).
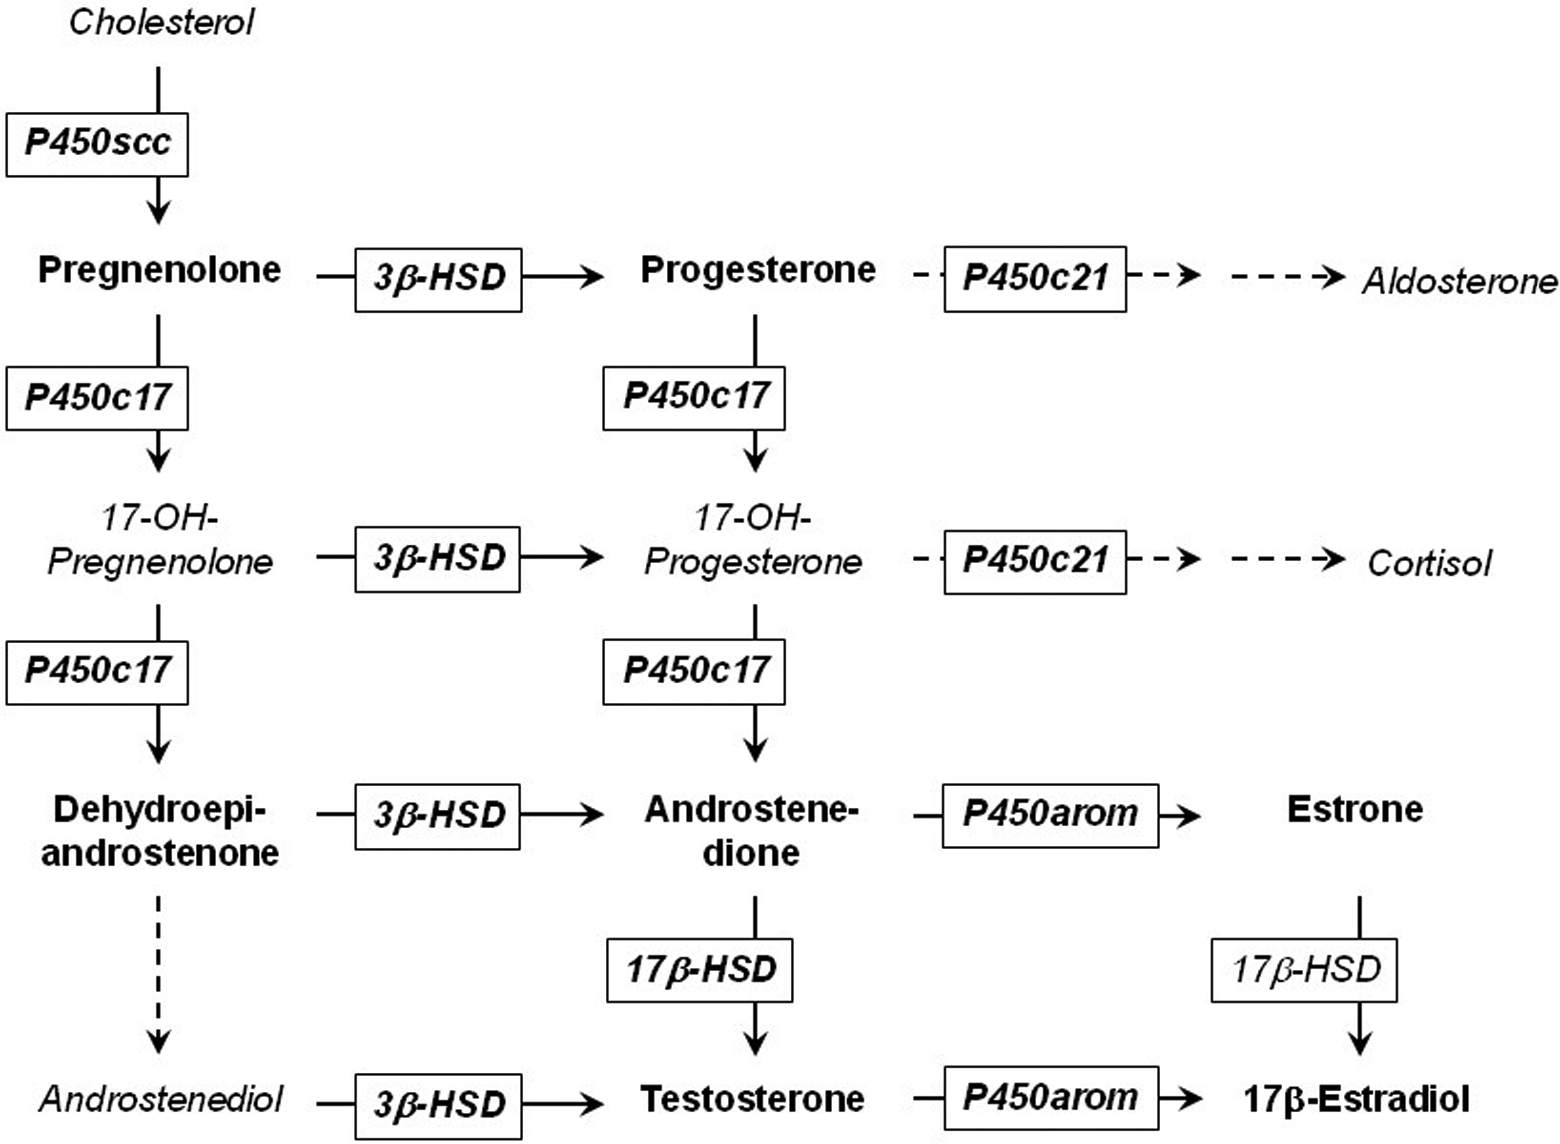
Steroidogenic pathway as expressed in the H295 R cell line. Reprinted from Toxicology In Vitro, Vol 26, issue 2, Nielsen et al, H295 R cells as a model for steroidogenic disruption: a broader perspective using simultaneous chemical analysis of 7 key steroid hormones, pages 343-350. Copyright (2012), with permission from Elsevier.
By implementing, an analytical multi-steroid method and analyzing 7 different steroid hormones in the steroidogenic pathway, we demonstrated an approach for obtaining mechanistic information for steroidogenic disruptors. 13 Three inhibitors of the steroidogenic pathway were shown to deviate from each other in their mode of action (prochloraz [PRO], ketoconazole [KET], and genistein [GEN]). Prochloraz (CAS no: 67747-09-5) and KET (CAS no: 65277-42-1) are imidazole fungicides while GEN (CAS no: 446-72-0) is a phytoestrogen. The 3 compounds have different effects upstream in the steroidogenic pathway, but all inhibiting the downstream synthesis of estradiol and testosterones. Prochloraz was shown to increase hormone concentrations upstream of P450c17 and to decrease concentrations downstream; KET decreased hormone concentrations in the entire pathway and finally GEN seems to influence the pathway in relation to 3β-hydroxysteroid dehydrogenase leading to higher concentrations upstream and lower downstream, thus they interfere with the pathway in different ways. 13 While it is important to investigate single compounds and their mechanism, much focus in the past few years have been directed toward mixture effects, as exposure scenarios may contain mixtures of compounds. 1,2 Exposure to several compounds all below their individual no observed effect concentration could add up and produce a combined effect. Several studies have been performed with mixtures of compounds from the same class or with identical target, and addition models such as CA and independent action have been applied to such scenarios with reasonable success. 1,2,14,15 However, in cases with mixtures of compounds with different mechanisms, the situation is quite different. Kortenkamp states in his review of mixture effects that studies of compounds with different modes of action were missing; 14 a message repeated in 2013 by Sumpter and Jobling. 16 Complexity rises if compounds have different modes of action, biphasic or opposite dose–response relationships and in theory, compounds with different modes of action could elicit synergistic responses. No commonly accepted models can today account for such complexity, 17 and mixture studies are needed to test various scenarios and evaluate models and assays for suitability regarding mixture effects. A key concern in the area of mixture toxicity is the possibility of synergistic effects as they would be much harder to cope with for regulators and would require extra risk factors built into risk evaluation. One such example is the work done by combing a synthesis inhibitor and a receptor antagonist to produce a synergistic effect in daphnias. 18 Reliable modeling would be a great tool when dealing with possible mixture effects as it is not feasible to test the endless number of possible exposure scenarios.
The aim of this study was to evaluate the mixture effects of 3 mechanistically different steroidogenic disruptors and evaluate whether any indication of synergy exceeding additivity was present. Based on single substance data published by the authors, 13 an equipotent tertiary mixture of GEN, KET, and PRO was tested and evaluated based on expected additive effects. Furthermore, binary mixtures of these compounds were also evaluated to help explain the findings from tertiary mixture testing. The underlying logic was that if predicted effects according to additivity models meaningfully predict mixture effects of compounds with diverse modes of action, single substance toxicity data may to a certain degree be adequate for hazard/risk assessment. But on the contrary, if current models do not meaningfully predict mixture effects, there is a gap in our understanding and challenges ahead for regulators. The study was designed to test the assumptions of a model, not to mimic real-world exposure scenarios.
Calculations of expected additivity using predicted EC50 values were based on the CA model 1 using the raw data for single substances tested by Nielsen et al. 13 The mixture data presented in this article were generated by the same persons in the exact same setting in immediate succession to the data generated for the article by Nielsen et al. 13 Thus, the single substance data used for calculating predicted EC50 values were generated under near exact same conditions and setup as the mixture data in this study.
Materials and Methods
All experiments and assays were carried out at the same laboratory, using the same protocols by the same persons in immediate succession to the work published by Nielsen et al 13 and using the same chemicals, thus we refer to this article for a detailed description of materials and methods.
Chemicals and Cells
All chemicals and cells were handled and prepared as described by Nielsen et al. 13 The H295R human adrenocortical carcinoma cell line was obtained from American Type Culture Collection (ATCC, #CRL-2128, Manassas, Virginia). Mixtures of GEN, KET, and PRO were tested in a 100:10:1 relationship as the EC50 values of the compounds based on Nielsen et al 13 , approximately corresponded to this factor with slight variation depending on which hormone was used as end point. Thus, the mixtures were prepared to mimic equipotency. Concentrations of mixtures are given as the concentration of GEN in the mixture or equivalent, so the concentrations of KET and PRO in the mixtures are 10 and 100 times lower, respectively, than the concentration indicated in the tables or figures.
H295R Steroid Hormones Synthesis Assay
The H295R steroid hormones synthesis assay was performed according to Nielsen et al, 13 based on the OECD guideline, 4 with the following deviations. All tests were done between passages 4 and 10. All mixtures were tested in 7 concentrations. The main study with tertiary mixtures was tested in duplicate on 3 different days giving a total of 6 replicates. The binary mixture studies to support the tertiary mixture study were tested in duplicate on 2 separate days, giving a total of 4 replicates. On each test plate, a solvent control consisting of 0.5% solvent (ethanol) in medium was included in 3 wells. Compared to the OECD H295R cell culture protocol 4 , incubation time was increased from 48 to 72 as single substance data used for modeling published by the authors 13 had similar exposure time and to make sure hormone concentrations (in particular testosterone) in the samples reached a quantifiable level using the GC-MS method applied. Samples from 3 wells of the same plate, receiving the same treatment, were pooled to increase the amount of steroid hormones above the limit of quantification (LOQ) in the samples. The highest tested concentrations of the mixtures and the solvent controls were tested for viability in the Alamar Blue viability assay. 13,18
Steroid Hormone Analysis
Chemical analysis of steroid hormones was performed according to Hansen et al 19 as modified by Nielsen et al 13 , without deviations and on the same apparatus. For all hormone measurements, the signal-to-noise ratio was above 10:1 and thereby above the LOQ.
Data Processing and Statistical Analysis
All data processing and statistical analysis were carried out as described by Nielsen et al 13 with the following deviations. In the event, a data test did not pass the test for normality or heterogeneity, a nonparametric test was applied this occurred in 3 of the 28 data sets analyzed. Dunnets method was applied throughout to relative changes in hormone production instead of the Holm-Sidak method. All statistical analysis was conducted using SIGMA plot 13.0 (Systat Software Inc, San Jose, California).
Cell Viability and Quality Control
Cell viability was tested after 72 hours of incubation by visual inspection under a microscope to identify any changes from normal morphology. All substances and mixtures were tested in an Alamar Blue viability assay at the highest concentrations applied in the H295R, and none of the tested concentrations showed signs of cytotoxicity.
In order to account for interplate variability, all data were normalized to the solvent control on each plate. All measurements had greater signal-to-noise ratio than 10:1, although for progesterone variability caused by tailing/shouldering was significant so results should therefore be interpreted with care. Normality test failed in 3 of the 28 tests runs and indeed the normality failures applied to progesterone concentrations in the tertiary mixture and in the PRO: GEN and PRO: KET mixtures. In these cases, nonparametric tests were used to evaluate the results, so conclusions regarding effects on progesterone should be interpreted with care as variability affecting the results for progesterone arising from the analytical method during these experiments is significant. Quality control plates were prepared in parallel with plates used for experiments. The quality control plates showed consistent induction by forskolin (10 µmol/L) and inhibition by PRO (3 µmol/L), complying with the requirements of the OECD guideline. Basal hormone production was in line with previously reported concentrations. 13
Results
Effects of the Tertiary Mixture
Effects of the tertiary mixture are shown in Figure 2 as means ± standard deviations. Statistically significant decreases were observed for androstenedione and estrone at 10 and 5 µmol/L, respectively. The responses for estrone and 17β-estradiol also had significant increases at 0.15 and 0.5 µmol/L followed by a return to baseline or decreases at higher concentrations, suggesting a biphasic concentration–response. No significant effects were observed for pregnenolone, dehydroepiandrosterone, and testosterone. No EC50 values were calculated as none of the hormones demonstrated a complete sigmoidal concentration–response relationship.
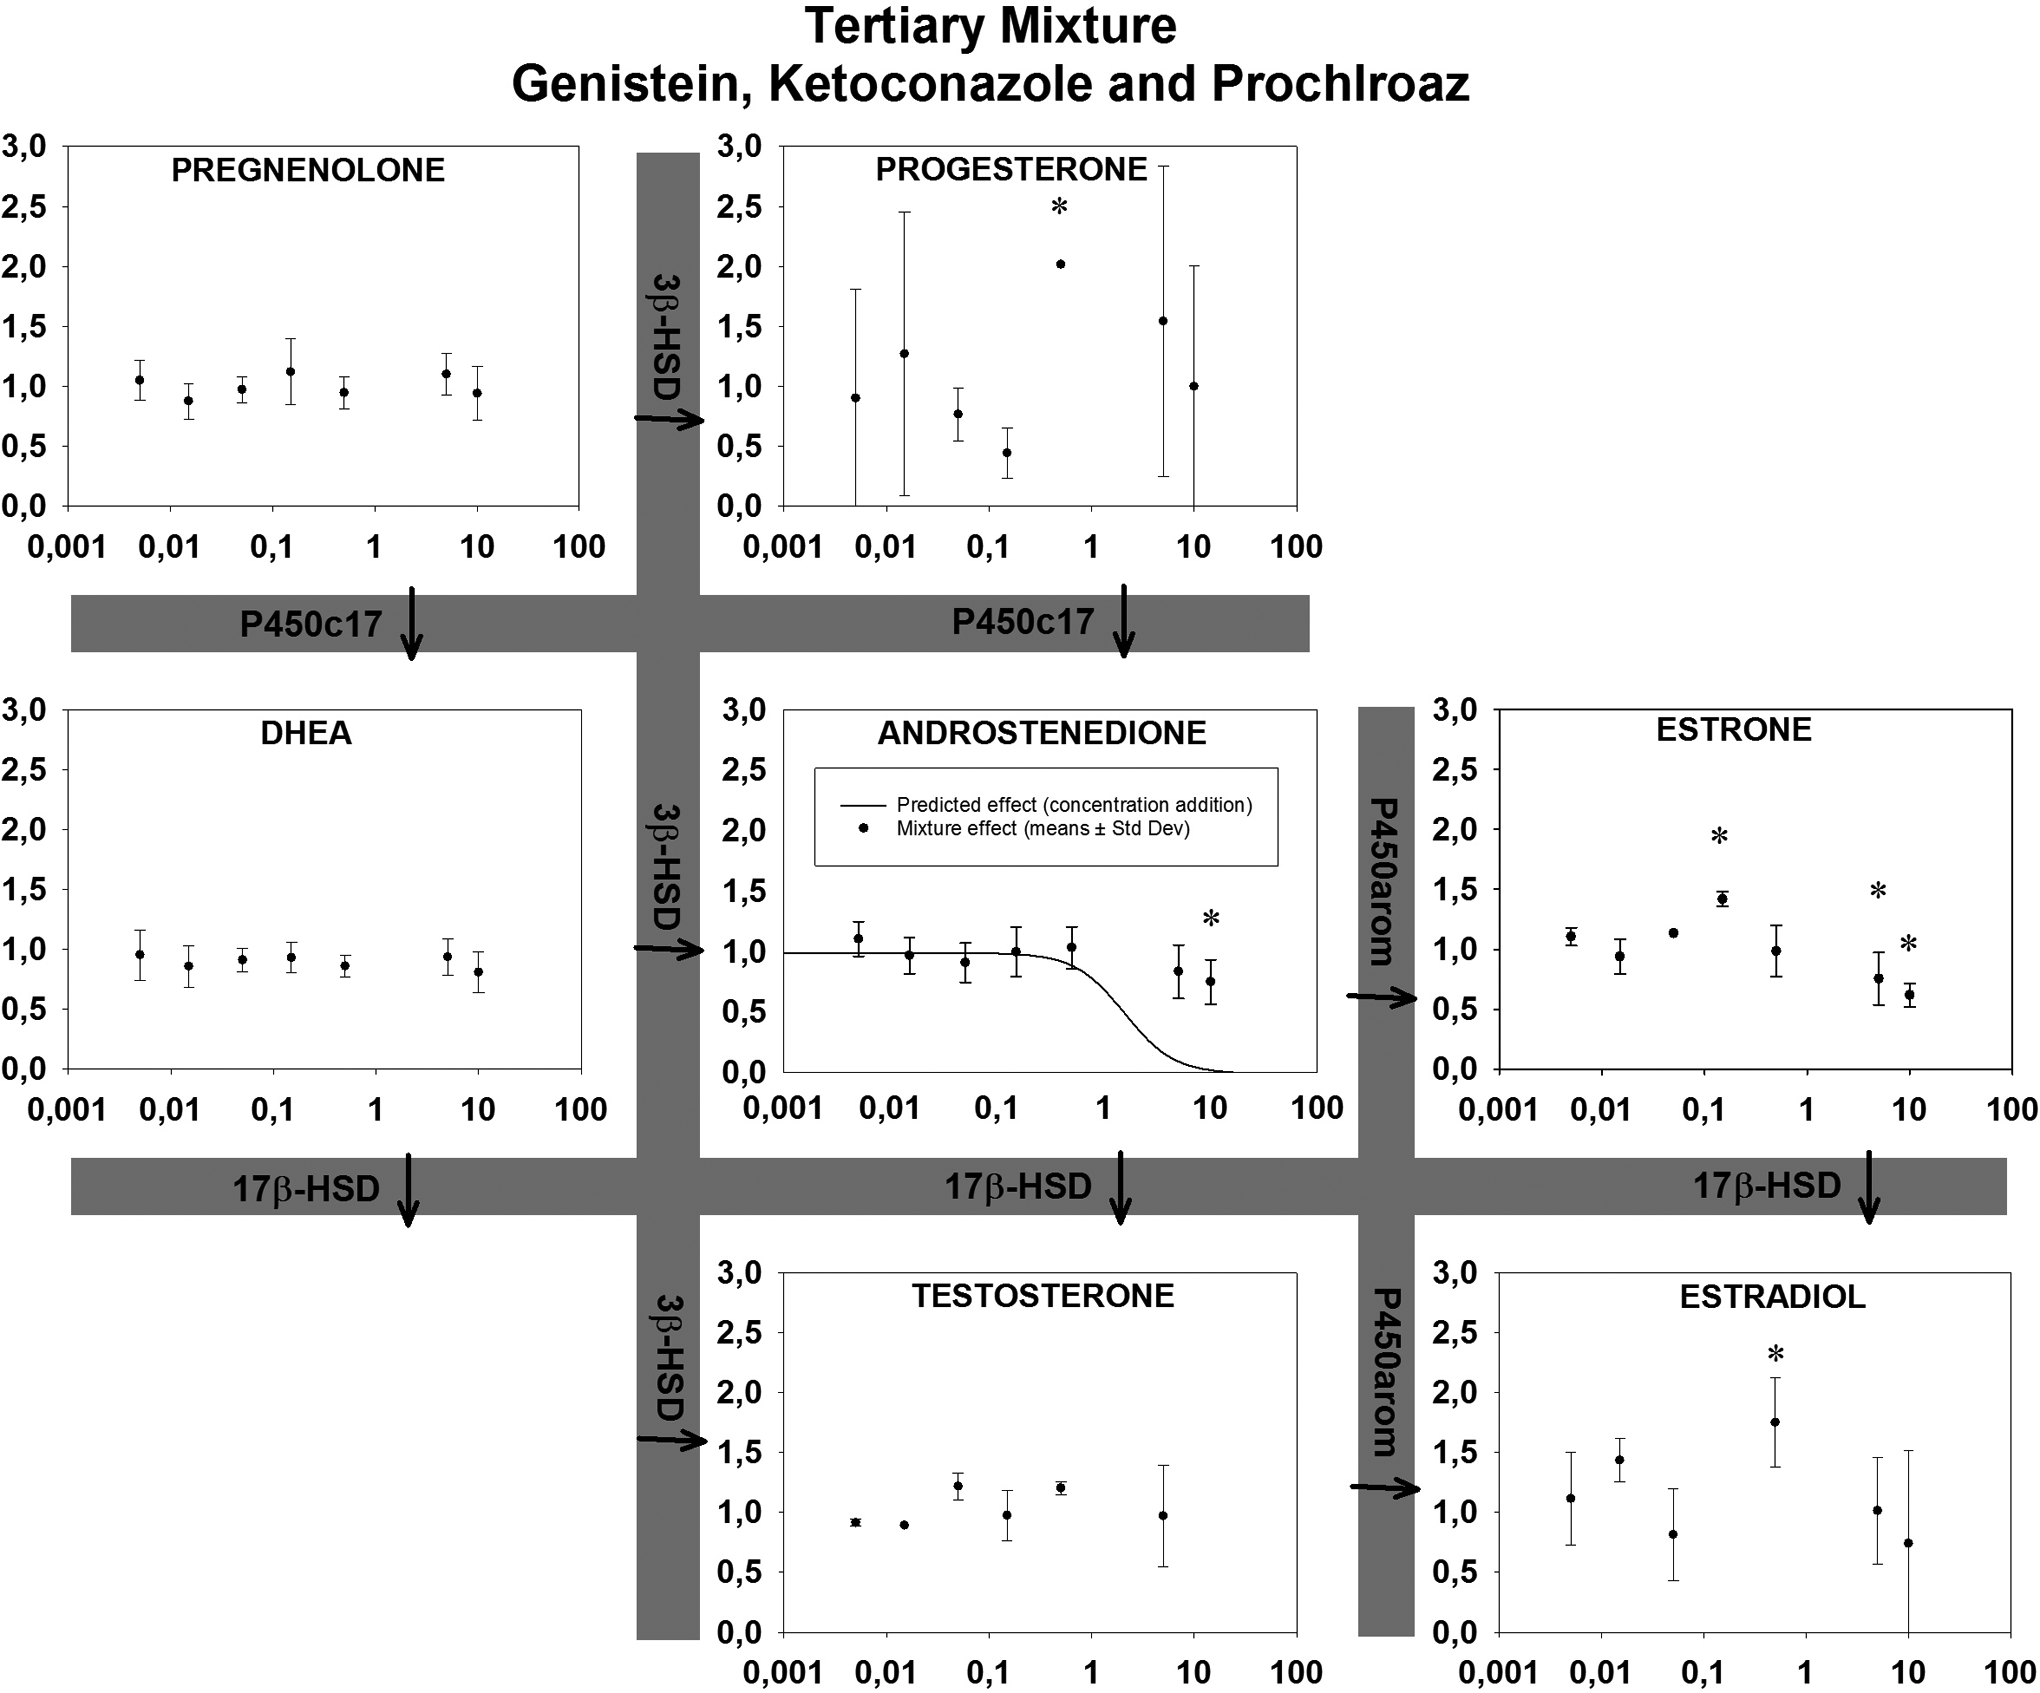
Effects of a tertiary mixture (prochloraz, genistein and ketoconazole) on steroidogenic relative hormone production in H295R cells after 72 hours. Concentration of genistein in the mixture is given on the x-axis (µmol/L). Concentrations of ketoconazole and prochloraz are 10 and 100 times lower, respectively. Y-axis indicates the mean cell media concentration of steroid hormone in the H295R cell assay relative to control (1 = control) ± standard deviation (SD) in 6 replicates. aIndicates statistically significant changes. Solid line indicates the predicted effect using concentration addition.
In Table 1, the effects as lowest observed effect concentrations (LOECs) are shown with arrows indicating induction and inhibition, along with the lowest statistically significant concentration from this study. Androstenedione was downregulated at an LOEC of 10 µmol/L while estrone was both up- and downregulated depending on concentration. Finally, 17B-estradiol was upregulated at 0.6 µmol/L. Based on Nielsen et al, 13 a predicted EC50 value for androstenedione of 1.6 µmol/L was calculated, using CA as described by Berenbaum, 3 but the decrease of androstenedione was not as profound as the prediction (Figure 2). It was not possible to calculate predicted EC50 for any other hormones in the tertiary mixture as EC50 values were not available for the 3 investigated compounds at any other end point in the study by Nielsen et al. 13
Observed Statistically Significant LOEC Values as Numbers (µmol/L).a
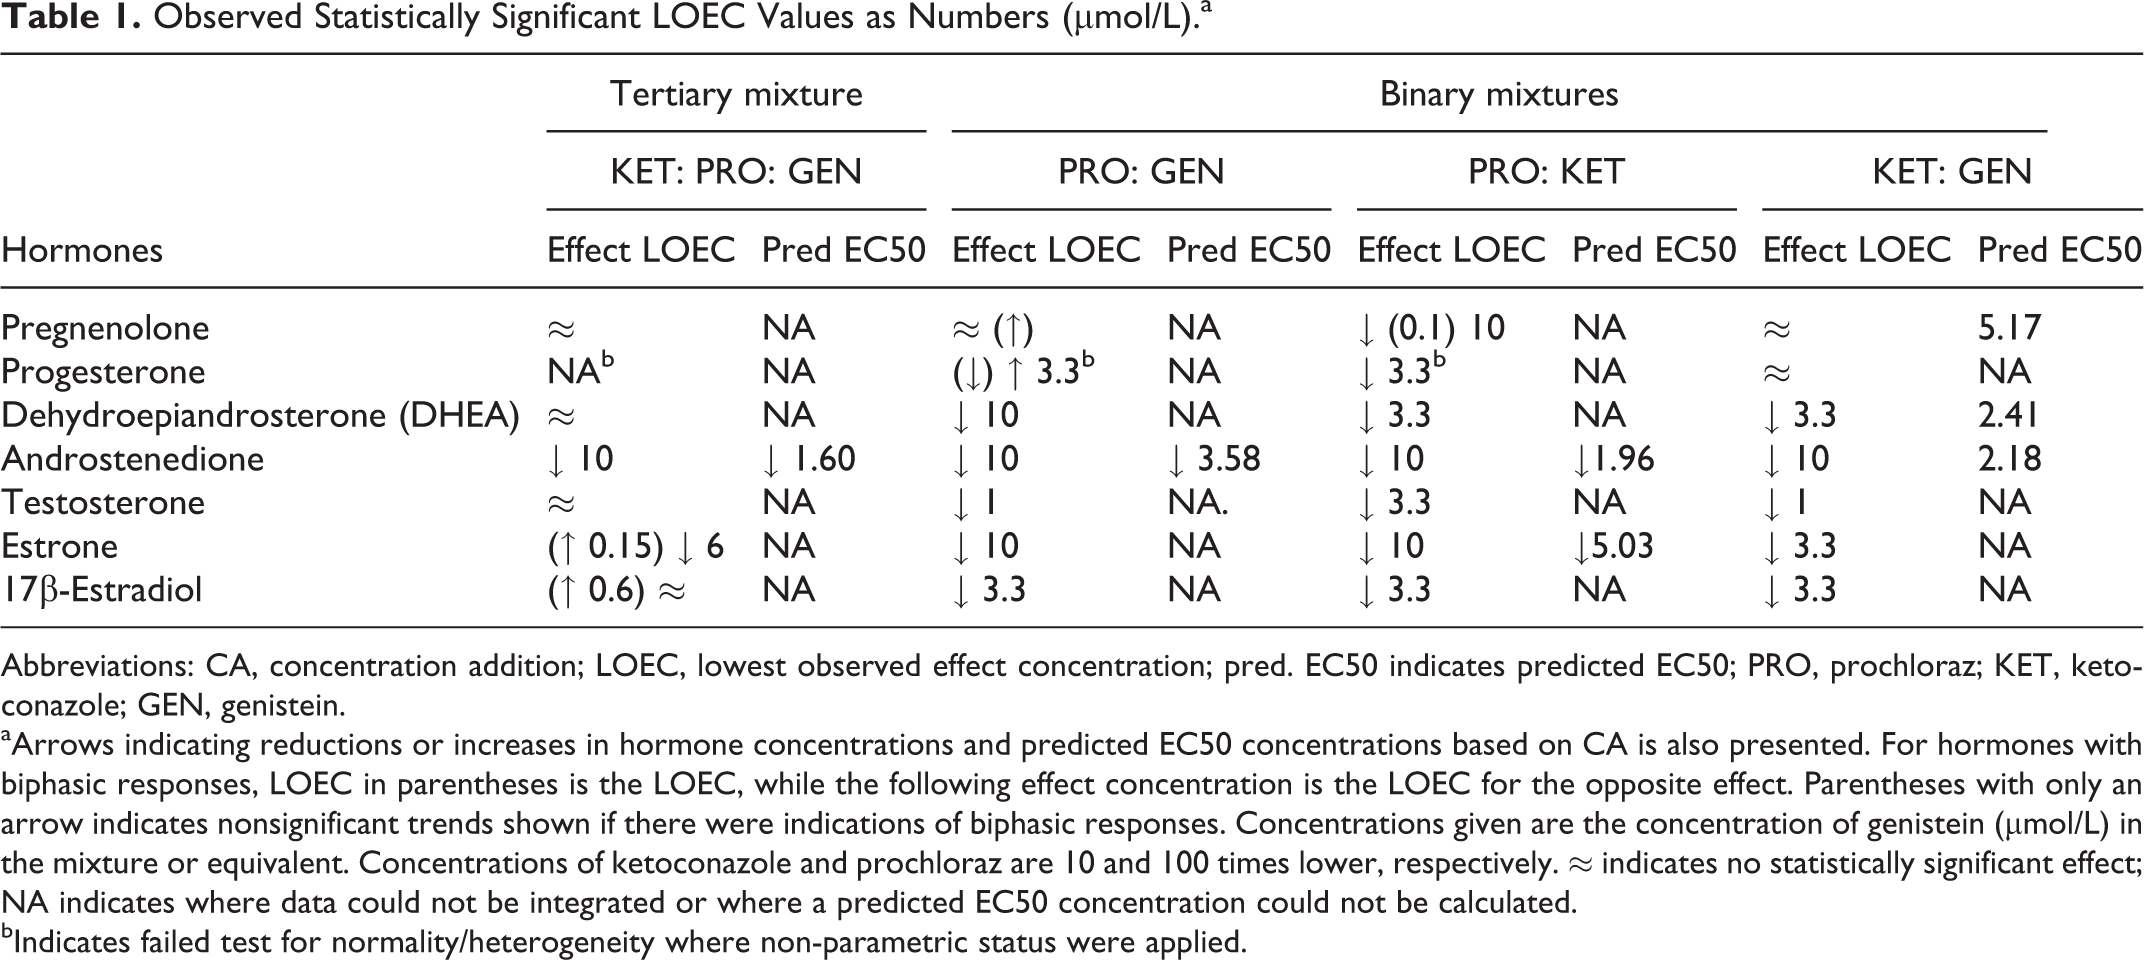
Abbreviations: CA, concentration addition; LOEC, lowest observed effect concentration; pred. EC50 indicates predicted EC50; PRO, prochloraz; KET, ketoconazole; GEN, genistein.
aArrows indicating reductions or increases in hormone concentrations and predicted EC50 concentrations based on CA is also presented. For hormones with biphasic responses, LOEC in parentheses is the LOEC, while the following effect concentration is the LOEC for the opposite effect. Parentheses with only an arrow indicates nonsignificant trends shown if there were indications of biphasic responses. Concentrations given are the concentration of genistein (µmol/L) in the mixture or equivalent. Concentrations of ketoconazole and prochloraz are 10 and 100 times lower, respectively. ≈ indicates no statistically significant effect; NA indicates where data could not be integrated or where a predicted EC50 concentration could not be calculated.
bIndicates failed test for normality/heterogeneity where non-parametric status were applied.
Effects of Binary Mixtures
For all binary mixtures, an inhibition of the androgens and estrogens was observed while effects on the progestagens were mixed (Figures 3 –5). PRO: KET did not alter the concentrations of pregnenolone and progesterone significantly. KET: GEN inhibited pregnenolone and progesterone concentrations, while PRO: GEN produced higher concentrations of progesterone and a trend toward higher concentrations of pregnenolone. Expected EC50 values were predicted based on Nielsen et al 13 where possible and presented in Table 1 with effects (arrows indicating induction or inhibition) and lowest statistically significant concentration from this study. It was not possible to calculate EC50 values for the mixtures in this study as no full concentration–response curves were present. All predicted EC50 values were lower than the lowest significant change in hormone concentrations (15%-20%), indicating lower mixture effects than predicted using CA.

Effects of a binary mixture (prochloraz and ketoconazole) on relative hormone production in the H295 R cell assay after 72 hours. X-axis (µmol/L) indicates the corresponding concentration of genistein in the tertiary mixture. Concentrations of ketoconazole and prochloraz are 10 and 100 times lower, respectively, than on the x-axis. Y-axis indicates the cell media concentration of steroid hormones in the H295R cell assay relative to control (1 = control) ± SD in 4 replicates. aIndicates statistically significant changes.
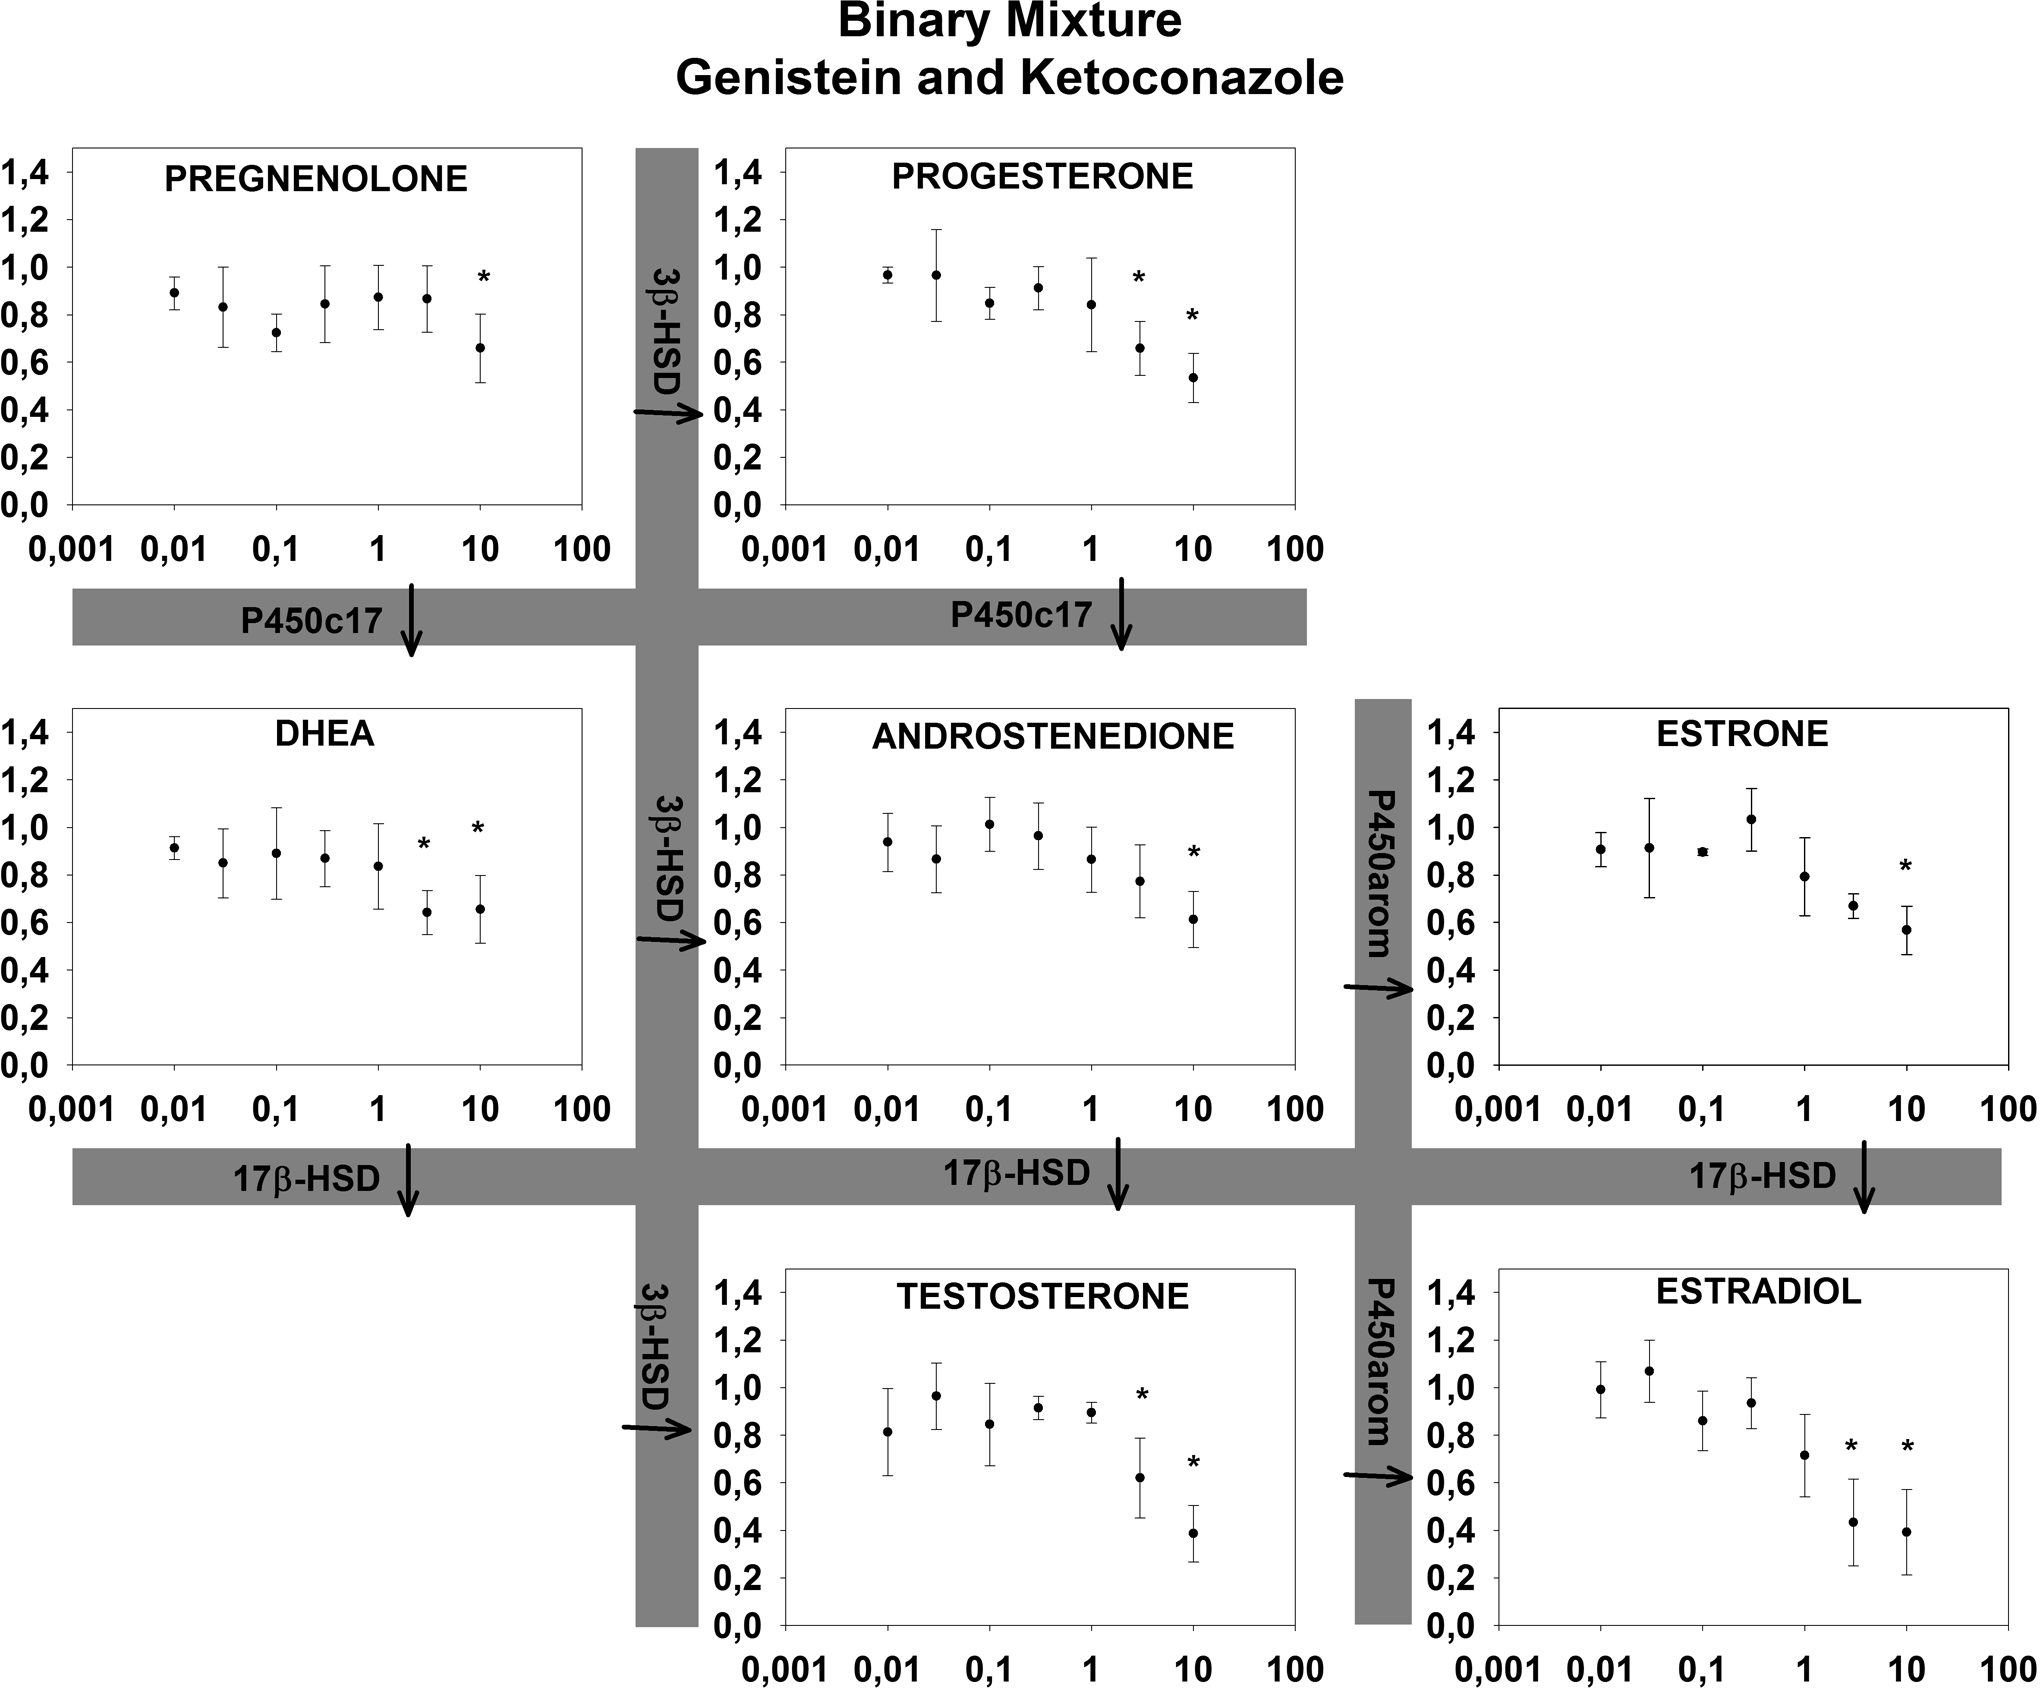
Effects of a binary mixture (genistein and ketoconazole) on relative hormone production in the H295R cell assay after 72 hours. X-axis (µmol/L) indicates the concentration of genistein. Concentrations of ketoconazole are 10 times lower than on the x-axis. Y-axis indicates the cell media concentration of steroid hormones in the H295R cell assay relative to control (1 = control) ± SD in 4 replicates. aIndicates statistically significant changes.
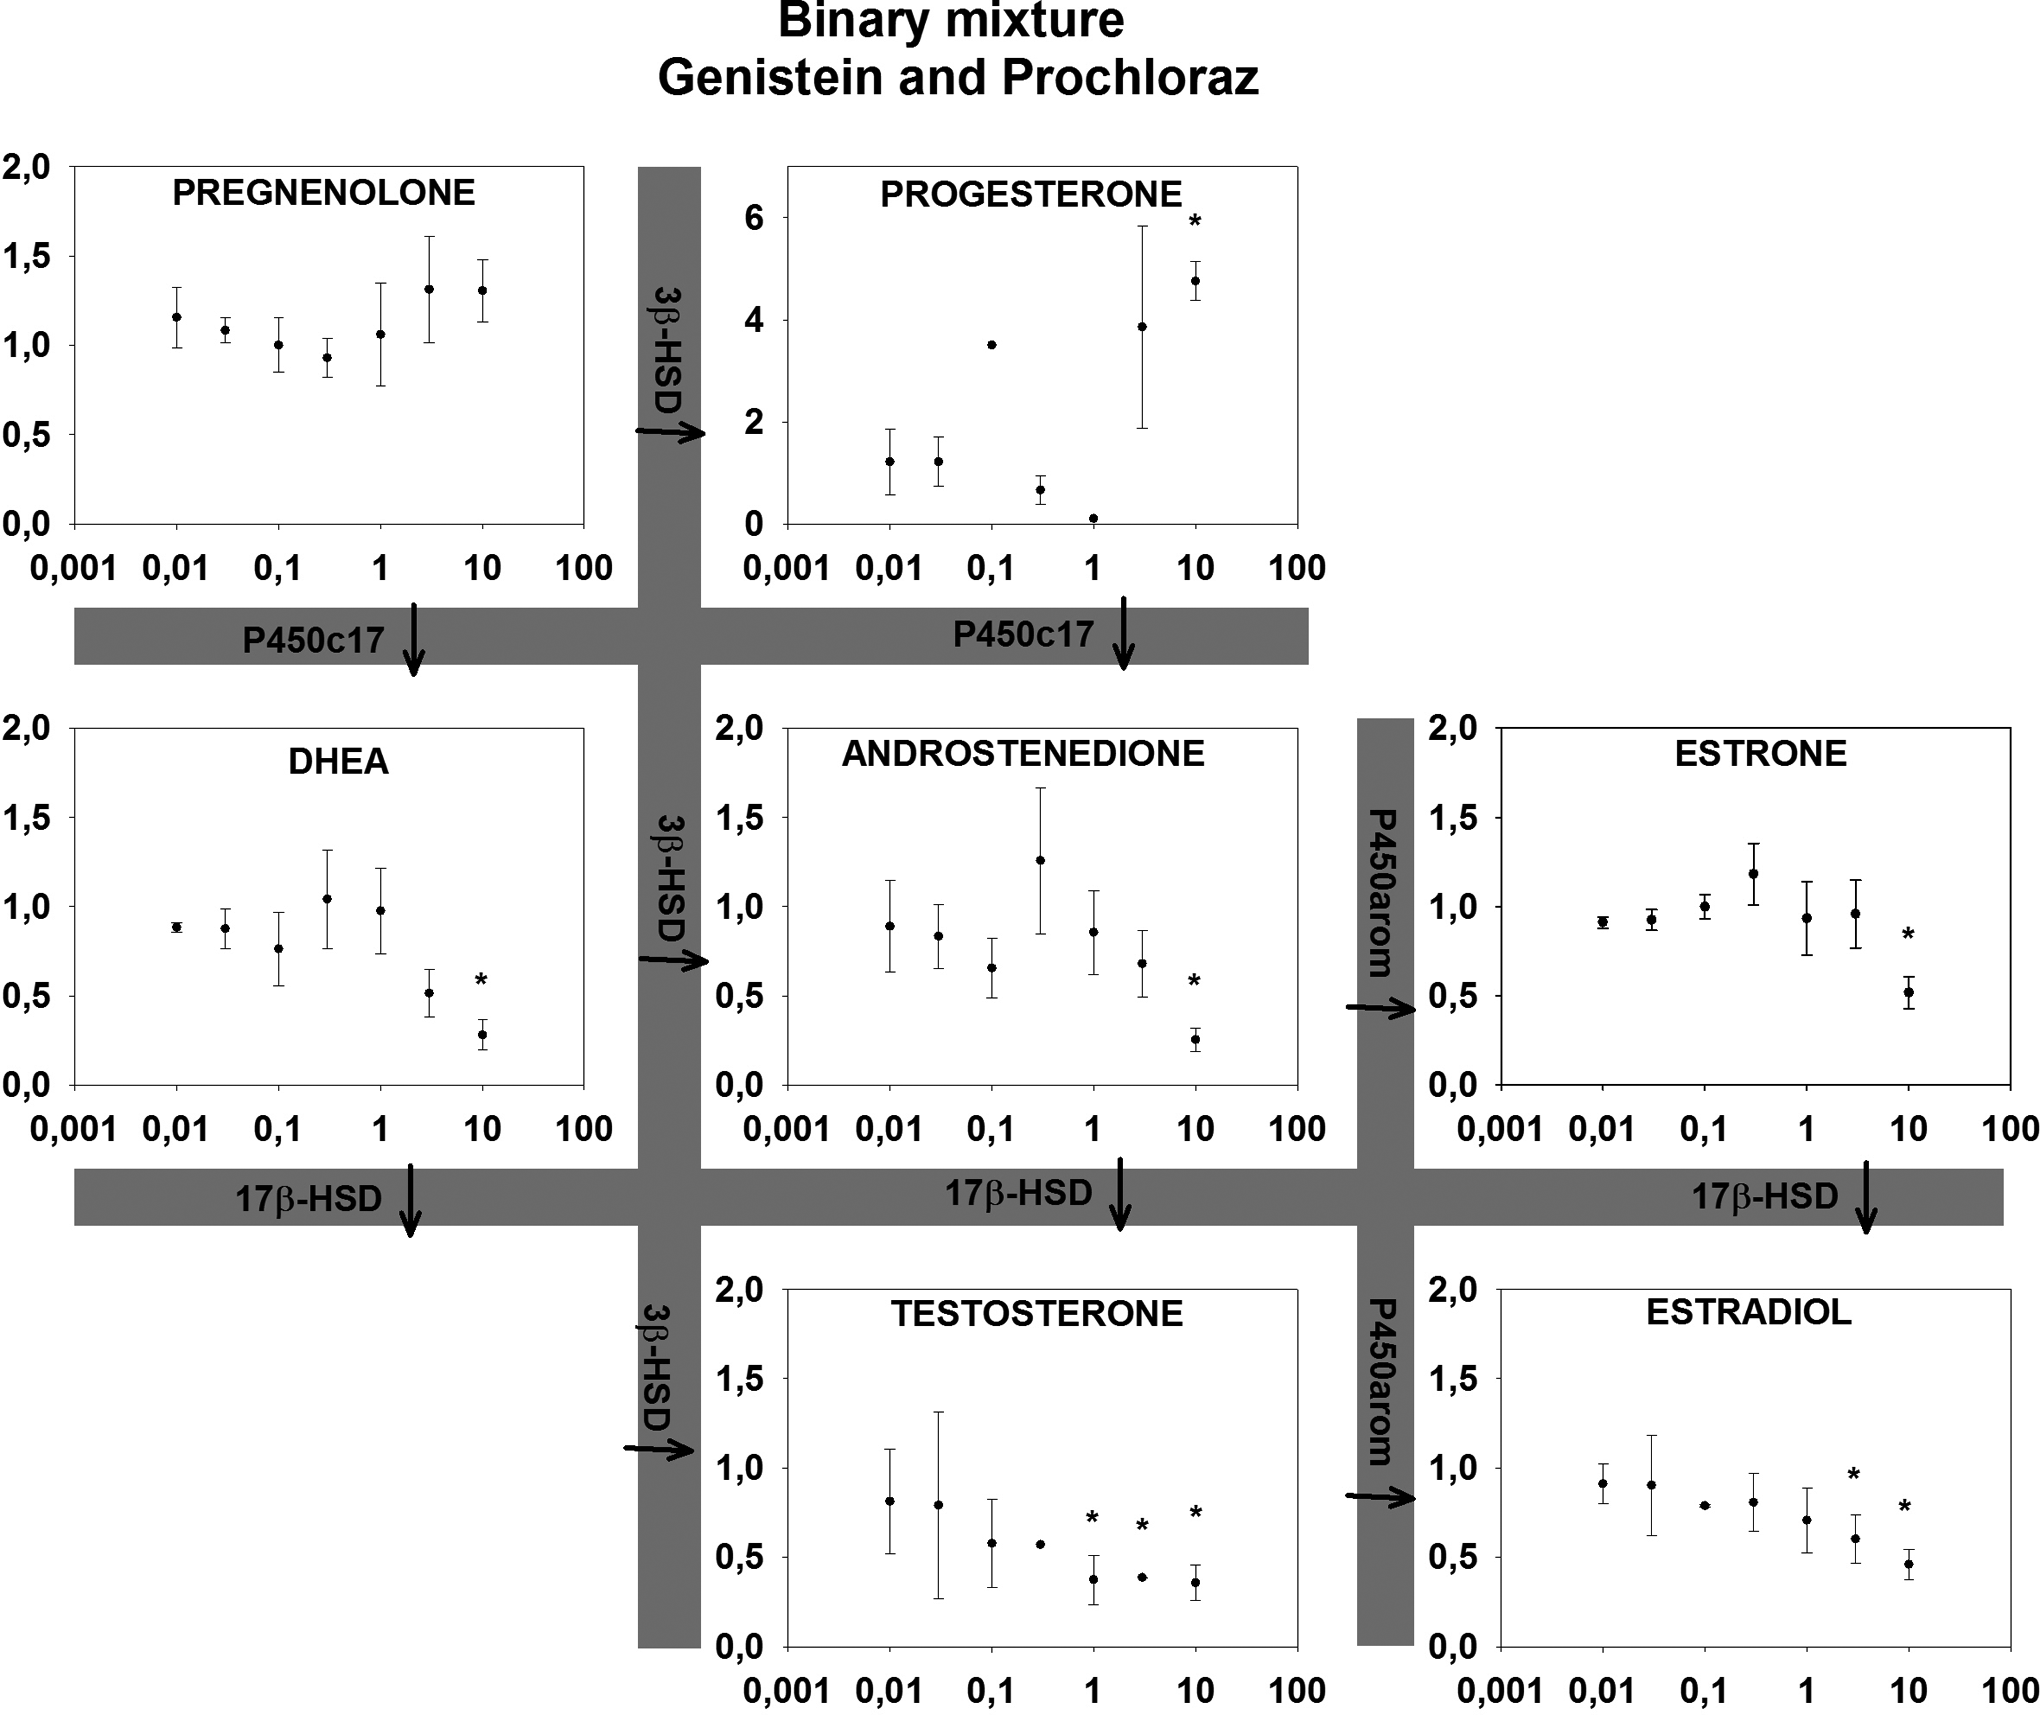
Effects of a binary mixture (genistein and prochloraz) on relative hormone production in the H295R cell assay after 72 hours. X-axis (µmol/L) indicates the concentration of Genistein. Concentrations of prochloraz are 100 times lower than on the x-axis. Y-axis indicates the cell media concentration of steroid hormones in the H295R cell assay relative to control (1 = control) ± SD in 4 replicates. aIndicates statistically significant changes.
Discussion
As expected, effects of mixtures were observed at lower concentrations than LOECs for the individual compounds reported previously. 13 However, effects were not as profound as one would expect if additivity applied (see Table 1), with LOECs in several cases more than a factor of 5 higher than the predicted EC50. Ideally, obtained EC50 was to be compared with the predicted EC50 values, however, no EC50 values were calculated in this study since the mixtures did not demonstrate complete sigmoidal concentration–response curves at the concentrations tested as the curves were shifted right compared to the expected effects. Thus we resort to comparing LOEC to predicted EC50. Using this approach of course has its limits but as LOECs should be observed at concentrations below predicted EC50 it is striking that they consistently are at higher concentrations than the predicted EC50. Therefore, it appears there were no signs of synergy in this study. On the contrary, it appears the 3 steroidogenic disruptors consistently interfere with the effects of each other antagonistically. At all tested concentrations, LOEC of the mixtures occurred at concentrations higher than predicted EC50 values using CA (Table 1). These possible antagonistic effects are in line with the result reported by Hadrup et al 17 who, in parallel to this work, tested mixtures of mechanistically differentiated steroidogenic disruptors in the H295R cell line. Comparison between the 2 studies should, however, be made with caution as this study had an increased incubation time compared to the OECD guideline (72 vs 48 hours) to make sure the hormone concentrations exceeded the LOQ. Bearing this in mind, the antagonistic effect in this study is, however, more profound. For upstream endpoints, where the tested compounds have opposite effects, no relevant prediction model exists for evaluating mixture effects 17 and thus modeling of mixture effects in these cases is not possible for now. The H295R cell line appears to be a suitable in vitro model for mixture studies of steroidogenic disruptors with targets expressed in the cells. The potential is further expanded when it is coupled with a multi-end point analytical method to evaluate effects throughout the pathway, as the potential for steroidogenic disruption is greater than effects seen on downstream products estradiol and testosterone alone. 20 The assay, however, does not account for effects or feedback mechanisms outside this cell system, such as the hypothalamic-pituitary-adrenal axis or receptors in target organs for the steroid hormones (nor is the androgen and estrogen receptor status for the cell line well described), and as such cannot prove that other results would not occur in systems that are more complex. However, for the data generated in this study, it appears assessing hazard based on additivity will be adequate and may even be considered conservative. It will, however, be important to validate such results in more complex models (including in vivo). Furthermore, although the compounds tested have different modes of action, it would be valuable to include other compounds with an even broader range of modes of action (eg, receptor antagonist or compounds that interfere with metabolism) to evaluate the potential for mixture effects of compounds leading to the same physiological manifestations. Examples of synergistic effects have been reported when combining both compounds that interfere with synthesis of active hormone and receptor antagonist 18 in a daphnia study, and thus it would be important to evaluate whether similar effects can be seen for these steroidogenic disruptors. In addition to the scope of this article of evaluating additivity as a model and the suitability of the cell line as a mixture model, the antagonism displayed by the 3 compounds in itself warrants further mechanistic studies to understand how they interact and cause antagonism. Mixture studies on gene expression and protein levels in the pathway and evaluation of steroid receptor status and feedback mechanisms in the cell line are therefore warranted.
Footnotes
Acknowledgments
The authors wish to acknowledge Susanne Hermansen and Kenneth Munk Pedersen at University of Copenhagen for their excellent technical help. The study was funded by University of Copenhagen.
Authors’ Contributions
Nielsen, FK contributed to conception and design; contributed to acquisition, analysis, and interpretation; drafted the manuscript, and critically revised the manuscript. Hurup Hansen, C contributed to conception and design; contributed to acquisition, analysis, and interpretation; and critically revised the manuscript. Fey, J contributed to conception and design; contributed to acquisition, analysis, and interpretation; and critically revised the manuscript. Hansen, M contributed to conception and design; contributed to acquisition and analysis; and critically revised the manuscript. Halling-Sørensen, B contributed to conception and design and critically revised the manuscript; Björklund, E contributed to conception and critically revised the manuscript. Styrishave, B contributed to conception and design and critically revised the manuscript. All authors gave final approval and agree to be accountable for all aspects of work ensuring integrity and accuracy.
Declaration of Conflicting Interests
The author(s) declared no potential conflicts of interest with respect to the research, authorship, and/or publication of this article.
Funding
The author(s) received no financial support for the research, authorship, and/or publication of this article.