
Abstract
The liver is an important organ for amino acid metabolism, and its damage can be reflected in the changes of amino acid level in the body. Triptolide (TP) has broad anti-inflammatory and anti-tumor activities, but its clinical application is limited due to hepatotoxicity. In this work, a simple, accurate and sensitive gas chromatography-triple quadrupole mass spectrometry (GC-QqQ-MS/MS) method was developed and validated for evaluating the serum levels of amino acids from control and TP-induced liver injured rats, and chemometric analysis was employed for amino acid metabolic profiles analysis. It was found that 11 amino acids showed significant changes after TP administration, and they were mainly involved in 5 metabolic pathways that are phenylalanine, tyrosine and tryptophan biosynthesis, alanine, aspartate and glutamate metabolism, glutamine and glutamate metabolism, phenylalanine metabolism and arginine biosynthesis. Five amino acids including tyrosine, glutamine, glutamic acid, tryptophan and alanine were identified as biomarkers of TP hepatotoxicity by further analysis. These results indicated that the novel amino acid metabolic profiling study based on the GC-QqQ-MS/MS provided not only exact concentrations of serum amino acids, but also a prospective methodology for evaluation of chemically induced liver injury.
Introduction
Amino acids are organic compounds containing basic amino groups and acid carboxyl groups, which are the basic units of protein synthesis. It affects the synthesis of lipids, glutathione, nucleotides and glucosamine serving as precursors of many bioactive molecules including coenzymes, neurotransmitters and nucleic acids, and participates in cell proliferation and tricarboxylic acid cycle acting as metabolic intermediates.1,2 Recent studies have been shown that the metabolic profile of amino acids was closely related to Alzheimer’s disease, 3 diabetes mellitus, 4 neurodegenerative diseases 5 and cardiovascular diseases. 6 Liver, an important organ for protein synthesis, degradation and amino acid metabolism, plays an indispensable role in maintaining the balance of amino acids. Therefore, it is expected that the amino acids balance was broken in hepatic disease such as fatty liver disease, 7 cirrhosis 8 and liver cancer. 9
Triptolide (TP, its structure is shown in Figure 1), a cyclooxidized diterpene lactone, is a major active ingredient isolated from Tripterygium wilfordii Hook. F, 10 which has great potential in the treatment of rheumatoid arthritis 11 and cancer. 12 However, its clinical applications are limited due to hepatotoxicity. 13 Some studies have suggested that TP exposure could increase the intracellular reactive oxygen species, inhibit the activity of superoxide dismutase, reduce the level of glutathione (GSH) and induce oxidative stress in the liver.14,15 Furthermore, recent researches also have indicated that the TLR4-Myd88-NF-κB pathway activated by a toxic dose of TP could participate in the activation of NLRP3 inflammasome. 16 However, the metabolic dynamic of amino acids in TP-induced liver injury remain largely unknown. Previous studies have shown that the level of amino acids analyzed by 1H-nuclear magnetic resonance spectra (1H-NMR) non-targeted metabolomics was different between control and TP-treated mice. 17 These differential amino acids may be used as biomarkers for the diagnosis of TP-induced liver injury if they can be accurately measured.

Chemical structure of triptolid.
At present, the quantitative methods for amino acids are reported, mainly gas chromatography-mass spectrometry (GC-MS), 18 1H-NMR 19 and liquid chromatography-triple quadrupole mass spectrometry (LC-QqQ-MS/MS). 20 Compared with LC-QqQ-MS/MS and 1H-NMR, the gas chromatography-triple quadrupole mass spectrometry (GC-QqQ-MS/MS) has lower price and obvious advantages in chromatographic repeatability, resolution and repeatability of mass spectrum fragments obtained by electron bombardment ionization source, and is less affected by matrix effect, which can detect a large number of small molecular metabolites with low content rapidly, accurately and sensitively. 21 Considering low physiological concentrations and various physicochemical properties of amino acids as well as coexistence of serum or plasma matrix, the GC-QqQ-MS/MS that is a quantitative method with high selectivity and sensitivity is required.
In this study, the multiple reactions monitoring (MRM) mode was developed to quantitatively determine amino acids in serum of control and TP-induced rats based on GC-QqQ-MS/MS. Chemometrics such as principal component analysis (PCA) and orthogonal partial least squares-discriminant analysis (OPLS-DA) were used to study the metabolic profiling of serum amino acids in control and TP-induced liver injured rats. Moreover, The metabolic pathways related to amino acids involved in TP liver injury were analyzed. We aimed 1) to identify potential amino acid biomarkers for TP-induced liver injure and 2) to analyze the correlations between TP-induced liver injury and the metabolic profile of amino acids in serum 3) to explore the mechanisms of TP hepatotoxicity. These results may not only provide a new method for the diagnosis of clinical liver injury, but also provide a reference for the further study of TP.
Materials and methods
Chemicals and reagents
TP (>98% pure) was provided by Guilin Sanlin biologics Co., Ltd. (Guanxi, China). 19 amino acid standards (>98% pure) including alanine, glycine, valine, leucine, isoleucine, threonine, proline, asparagine, glutamine, aspartic acid, methionine, serine, glutamic acid, phenylalanine, cysteine, lysine, histidine, tyrosine and tryptophan were purchased from J&K Scientific Co. Ltd. (Beijing, China). Seven isotopically labeled amino acids (internal standards, >95% pure) containing alanine-2,3,3,3-D4, serine-2,3,3-D3, phenylalanine-ring-D5, glutamic acid-2,3,3,4,4-D5, lysine-2,3,3,4,4,5,5,6,6-D9, tyrosine-2,3,3,4,5,6,7-D7 and tryptophan-indole-D5 were purchased from Cambridge Isotope Laboratories, Inc. (Andover, MA, USA). Derivative reagent propyl chloroformate (PCF, analysis grade) was purchased from J&K Scientific Co. Ltd. (Beijing, China). Other chemical reagents (analysis grade) such as n-propyl alcohol, pyridine, n-hexane and sodium hydroxide were supplied by the China National Pharmaceutical Group Corporation (Shanghai, China).
Animals treatment
Female rats were selected for this experiment because they are more sensitive to the liver toxicity of the drug. 22 Seven- to 9-week-old female Sprague-Dawley rats weighting 200 ± 20 g (SPF grade, Certificate number: SCXK2016-0002) were provided by Hunan Shrek Jingda Experimental Animal Technology Co. Ltd. (Hunan, China;). Before starting the experiment, the experimental animals were allowed to acclimatize in ordinary cages for 7 days under normal laboratory conditions of 12 h-light/dark cycle, relative humidity of 60 ± 5% and room temperature of 24 ± 2°C with free access to commercial pellet diet and tap water. The rats were remained unfed but had free access to tap water 15 h prior to oral administration. All animals were handled in accordance with the standards for laboratory animals (GB14925-2001). The Care and Use of Laboratory Animals were strictly performed, and the study protocols were approved by Animal Ethics Committee of Jiangxi Science & Technology Normal University. The rats were divided randomly into two groups, 10 rats each group. Control rats orally received with distilled water containing 0.5% sodium carboxymethyl cellulose (CMC-Na). 2.1 mg/kg TP dissolved in 0.5% CMC-Na solution was prepared to administrate TP-treated rats by means of intragastric administration. Blood samples were collected 24 h after TP administration, which is used to analyze biochemical indicators and amino acid metabolic profile. Then all the rats were sacrificed by isoflurane and livers were immediately collected for histopathological study.
Preparation of standard solution
Standard stock solution (50 μg/mL) containing 19 amino acid standards and the internal standard solution (100 μg/mL) including 7 internal standards were equally prepared. Standard stock solution was further diluted to prepare a series of working standard solutions at desired concentrations.
Sample preparation
Blood sample was centrifuged for 10 min (3500 rpm, 4°C) to obtain serum. Serum sample (100 μL) was spiked with 100 µL hybrid internal standards (100 μg/mL), and mixed well. Then 800 µL acetonitrile was added to precipitate the proteins. After vortex for 1 min and centrifugation (20000 rpm, 4°C) for 10 min, the supernatant was collected to dryness using a gentle stream of nitrogen. The residue was dissolved in 1 mL deionized water to extract amino acids. 220 µL n-propyl alcohol-pyridine (1:1.2, v/v), 4 µL NaOH (7 mol/L) and 100 µL PCF were successively added, vortexed and ultrasonicated for derivatization. Following, the derivatives of amino acids were twice extracted with 1 mL n-hexane. Supernatants were merged and dried by nitrogen evaporation. After redissolution in 1 mL n-hexane, 1 µL aliquot was injected into the GC-MS/MS system for analysis.
Biochemical assays and histopathology examination
Serum biomedical indicators that are alanine aminotransferase (ALT), aspartate aminotransferase (AST), alkaline phosphatase (ALP), triglyceride (TG) and total bilirubin (TBIL) were estimated by commercially available analyte-specific kits (Rongsheng Biotech, Shanghai, China) according to the manufacturer’s protocols. Hematoxylin and eosin (H&E) sections of liver were prepared for examination by light microscopy at two magnifications (100× and 200×).
GC-QqQ-MS/MS analysis
Amino acid analysis was carried out using the GC-QqQ-MS/MS system (Agilent Technologies, Santa Clara, CA, USA) consisting of a 7890B gas chromatography, a 7000C triple quadrupole mass spectrometry and a 7693A series auto injector. Amino acid separation was performed on a Zebron ZB-AAA column (10 m × 0.25 mm id., film thickness 0.25 μm) (Phenomenex, Torrance, CA, USA). Helium (99.999%) served as carrier gas at a flow rate of 2.0 mL/min. Splitless injection volume was set to 1 μL. The temperatures of injector and transfer line were set to 250°C and 280°C, respectively. The GC oven gradient temperature program was performed: an initial temperature of 80°C that was maintained for 1 min, a first increasing gradient at a rate of 30°C/min to a set temperature of 210°C, a second increasing gradient at a rate of 5°C/min to a set temperature of 225°C, and finally a third increasing gradient at a rate of 35°C/min to a set temperature of 300°C held for 2 min. The electron impact (EI) of mass spectrometer was operated at 70 eV. The temperature of EI and mass analyzer were set to 230°C and 150°C, respectively. MRM mode was performed to monitor amino acids.
Method validation
The quantified method of amino acids in serum was validated by determining linearity, limit of detection (LOD), limit of quantification (LOQ), precision, accuracy and matrix effect. The calibration curves were constructed by plotting the peak area ratios (y) of amino acids to the corresponding isotope internal standard versus the nominal concentration (x) of amino acids. The calibration curve was accepted when the value of correlation coefficient (r 2 ) was larger than 0.99. LOD and LOQ were evaluated according to signal to noise (S/N) of 3/1 and 10/1, respectively. Three concentrations (2, 20 and 40 µg/mL), six QC samples of each concentration were used for the precision and accuracy examination. The precision and accuracy were estimated by relative standard deviation (RSD) and relative recovery, respectively. Besides, the matrix effects of three concentrations were also evaluated.
GC-QqQ-MS/MS data multivariate statistical analysis
Concentration data was acquired and processed using the MassHunter Workstation Software (Agilent Technologies, Inc). Data set was imported into SIMCA-P (version 14.1, Umetrics, Umea, Sweden) for PCA and OPLS-DA. Amino acid markers that resulted in classification difference were identified by OPLS-DA loading plot and the variable importance in projection (VIP) plot. Pearson correlation analysis between amino acid markers and liver injury indicators was carried out through SPSS (version 25.0, SPSS Inc., Chicago, IL, USA).
Statistical analysis
Continuous variables were represented as mean ± standard deviation (SD). Two-tailed student’s t-test was performed to estimate differences between two groups using Microsoft Excel 2019. Difference was regarded as statistical significance when P ≤ 0.05.
Results
Biochemical indicators and histopathological observations
Activities of ALT, AST, ALP and contents of TBIL, TG in rat serum were examined to estimate TP-caused acute liver injury. Preliminary studies by our group showed that the activity of aminotransferases reached a high level 24 h after TP administration. Although the levels of aminotransferases continued to rise in the following 12 h, some rats in TP-treated group died. Therefore, we measured these biochemical indicators at this time point of 24 h. The activities of serum ALT, AST and ALP significantly increased in the TP-induced rats when compared with control rats. More importantly, ALT and AST activities elevated ∼16- and ∼13-fold, respectively. The serum contents of TBIL and TG was not significantly different between the two groups (Table 1). The histopathology of livers was also measured 24 h after TP administration. As shown in Figure 2, control rats displayed normal liver histology whereas TP-induced rats showed several pathological damages including vacuolization and caryolysis. The increased levels of biochemical indicators and histopathological alterations all showed that the rats suffer from acute liver injury 24 h post-TP administration.
Assay of biochemical indicators in the serum of control and TP-treated rats.
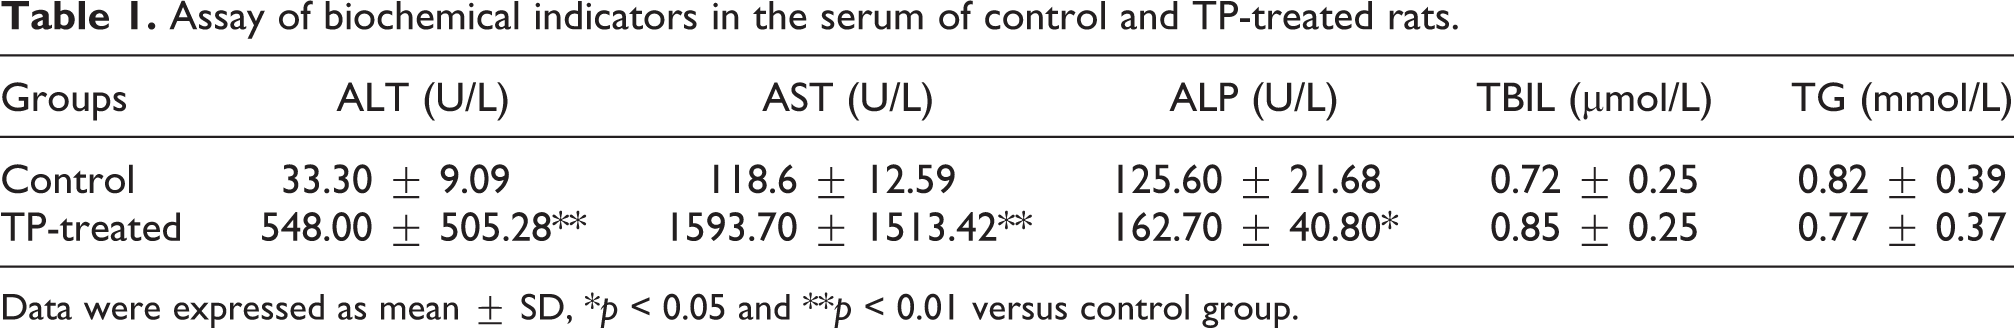
Data were expressed as mean ± SD, *p < 0.05 and **p < 0.01 versus control group.

Histopathology of liver tissue 24 h after TP administration. Representative slides were shown at two magnifications (A and C: 100×, B and D: 200×). A/B, Control group; C/D, TP-treated group.
Method validation
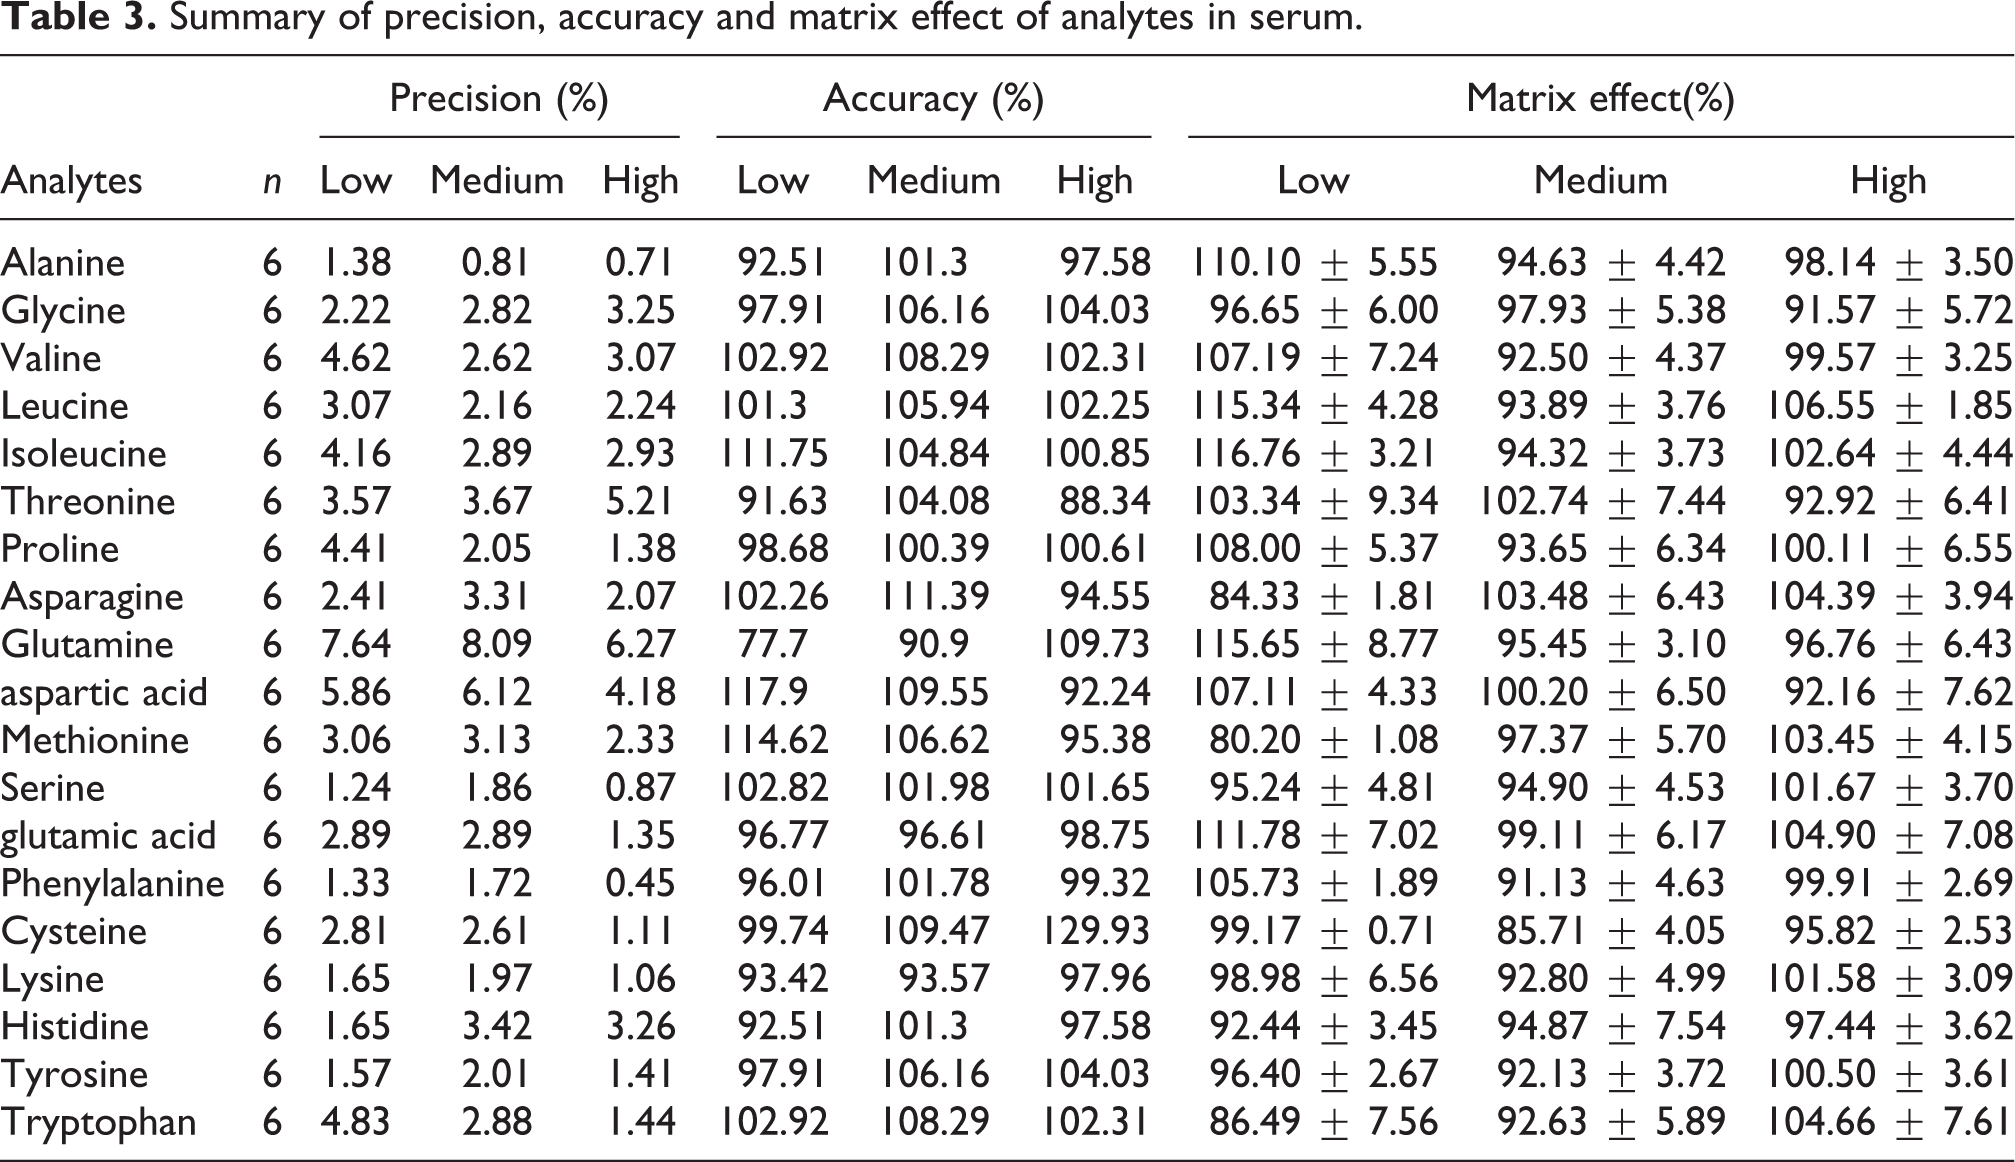
As shown in a total ion chromatogram (TIC) of amino acid standard sample (Figure 3(A)), 19 amino acids were well separated on a Zebron ZB-AAA column. Quantitative ranges and linearity data were shown in Table 2. All standard curves had a common upper quantitative concentration of 50 μg/mL, but some amino acids had different lower quantitative concentrations as follows: 0.1 μg/mL for alanine, glycine, valine, leucine, isoleucine, proline, asparagine, aspartic acid, methionine, serine, phenylalanine, cysteine, lysine, tyrosine and tryptophan and 1.0 μg/mL for Threonine, Glutamine, Glutamic acid and Histidine. The correlation coefficient (r2) for all amino acids were greater than 0.99. Especially, proline, serine, phenylalanine, lysine, tyrosine and tryptophan had r 2 value of 1. The assay performance displayed a good sensitivity for the LOD, ranging from 0.001 to 0.75 ng and the LOQ, ranging from 0.005 to 1 ng. A low deviation and high accuracy were achieved at three QC levels tested (Table 3). The precisions were all less than 8.10%. The most accuracies were fell with the range of 90.00∼120%, exception for 77.7% at low level of glutamine and 129.93% at high level of cysteine. The matrix effects at the three levels tested were between 80.20% and 116.76% (Table 3), indicating that the co-elution compounds in serum had no obvious ionization enhancement or suppression efficiency on amino acids in EI mode.
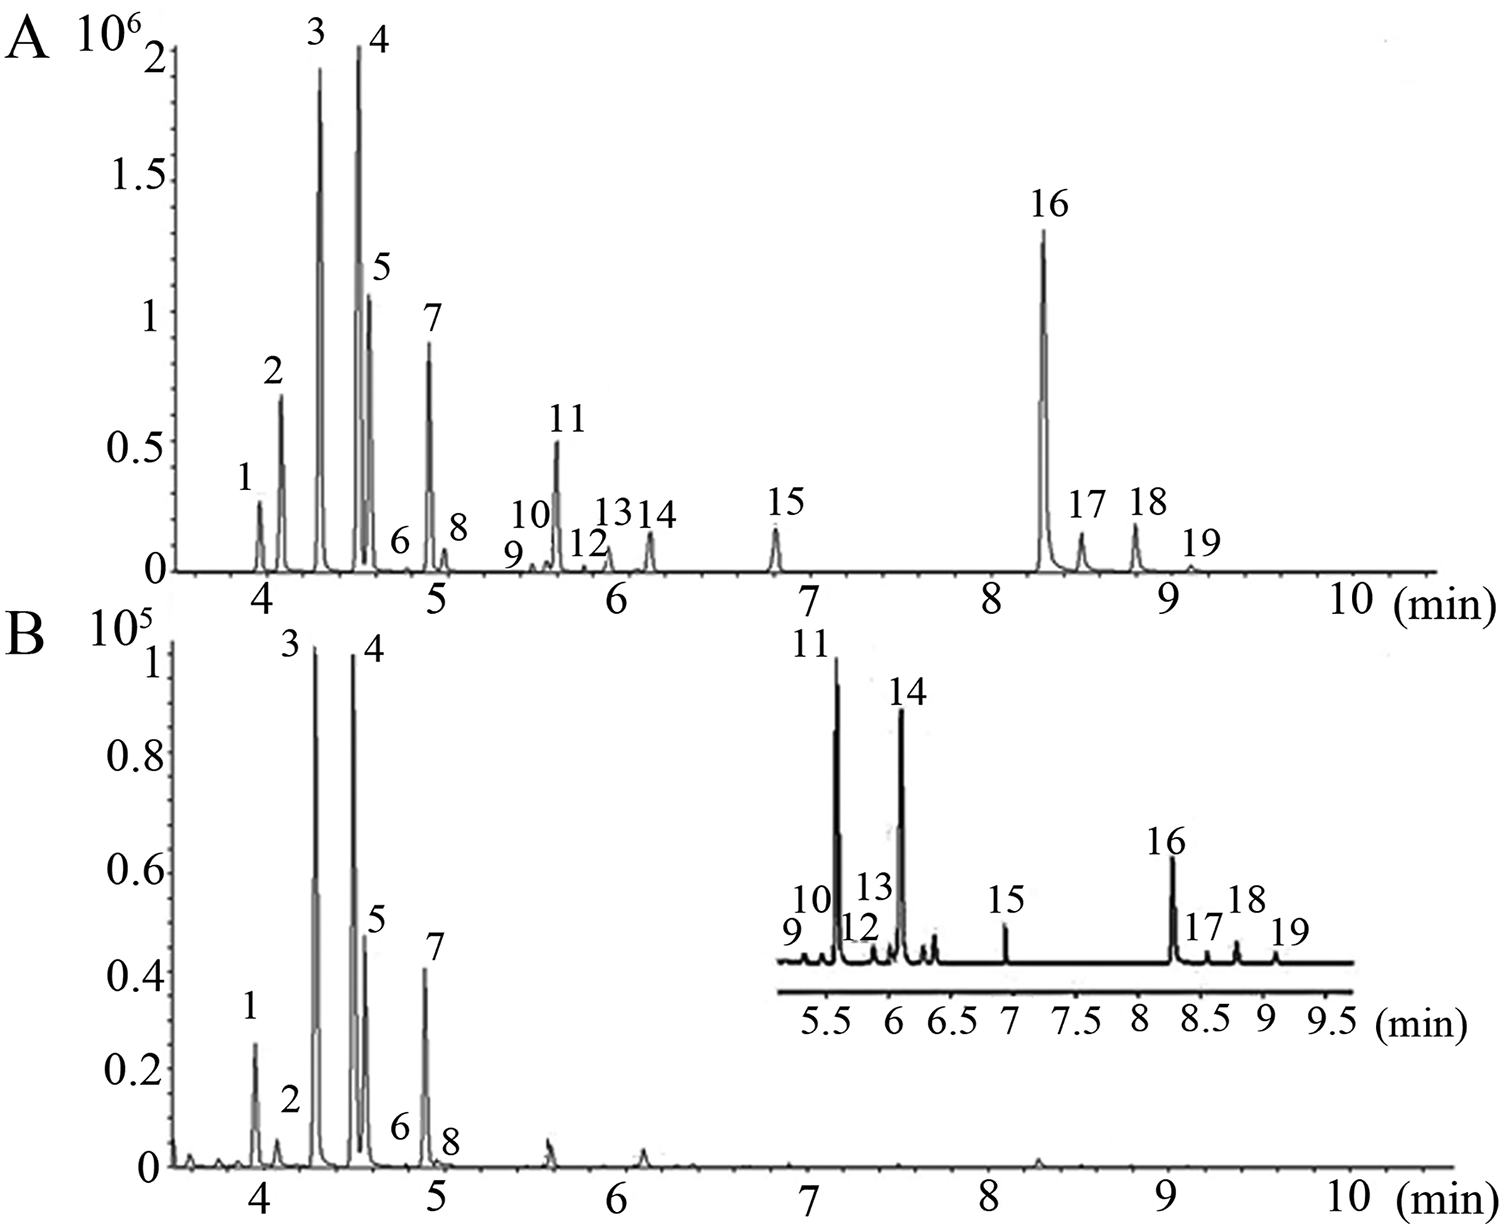
Total ion chromatograms of amino acid standard solution (A) and rat serum (B). 1, alanine; 2, glycine; 3, valine; 4, leucine; 5, isoleucine; 6, threonine; 7, proline; 8, asparagine; 9, glutamine; 10, aspartic acid; 11, methionine; 12, serine; 13, glutamic acid; 14, phenylalanine; 15, cysteine; 16, lysine; 17, histidine; 18, tyrosine; 19, tryptophan.
Calibration and linear regression parameters of analytes.
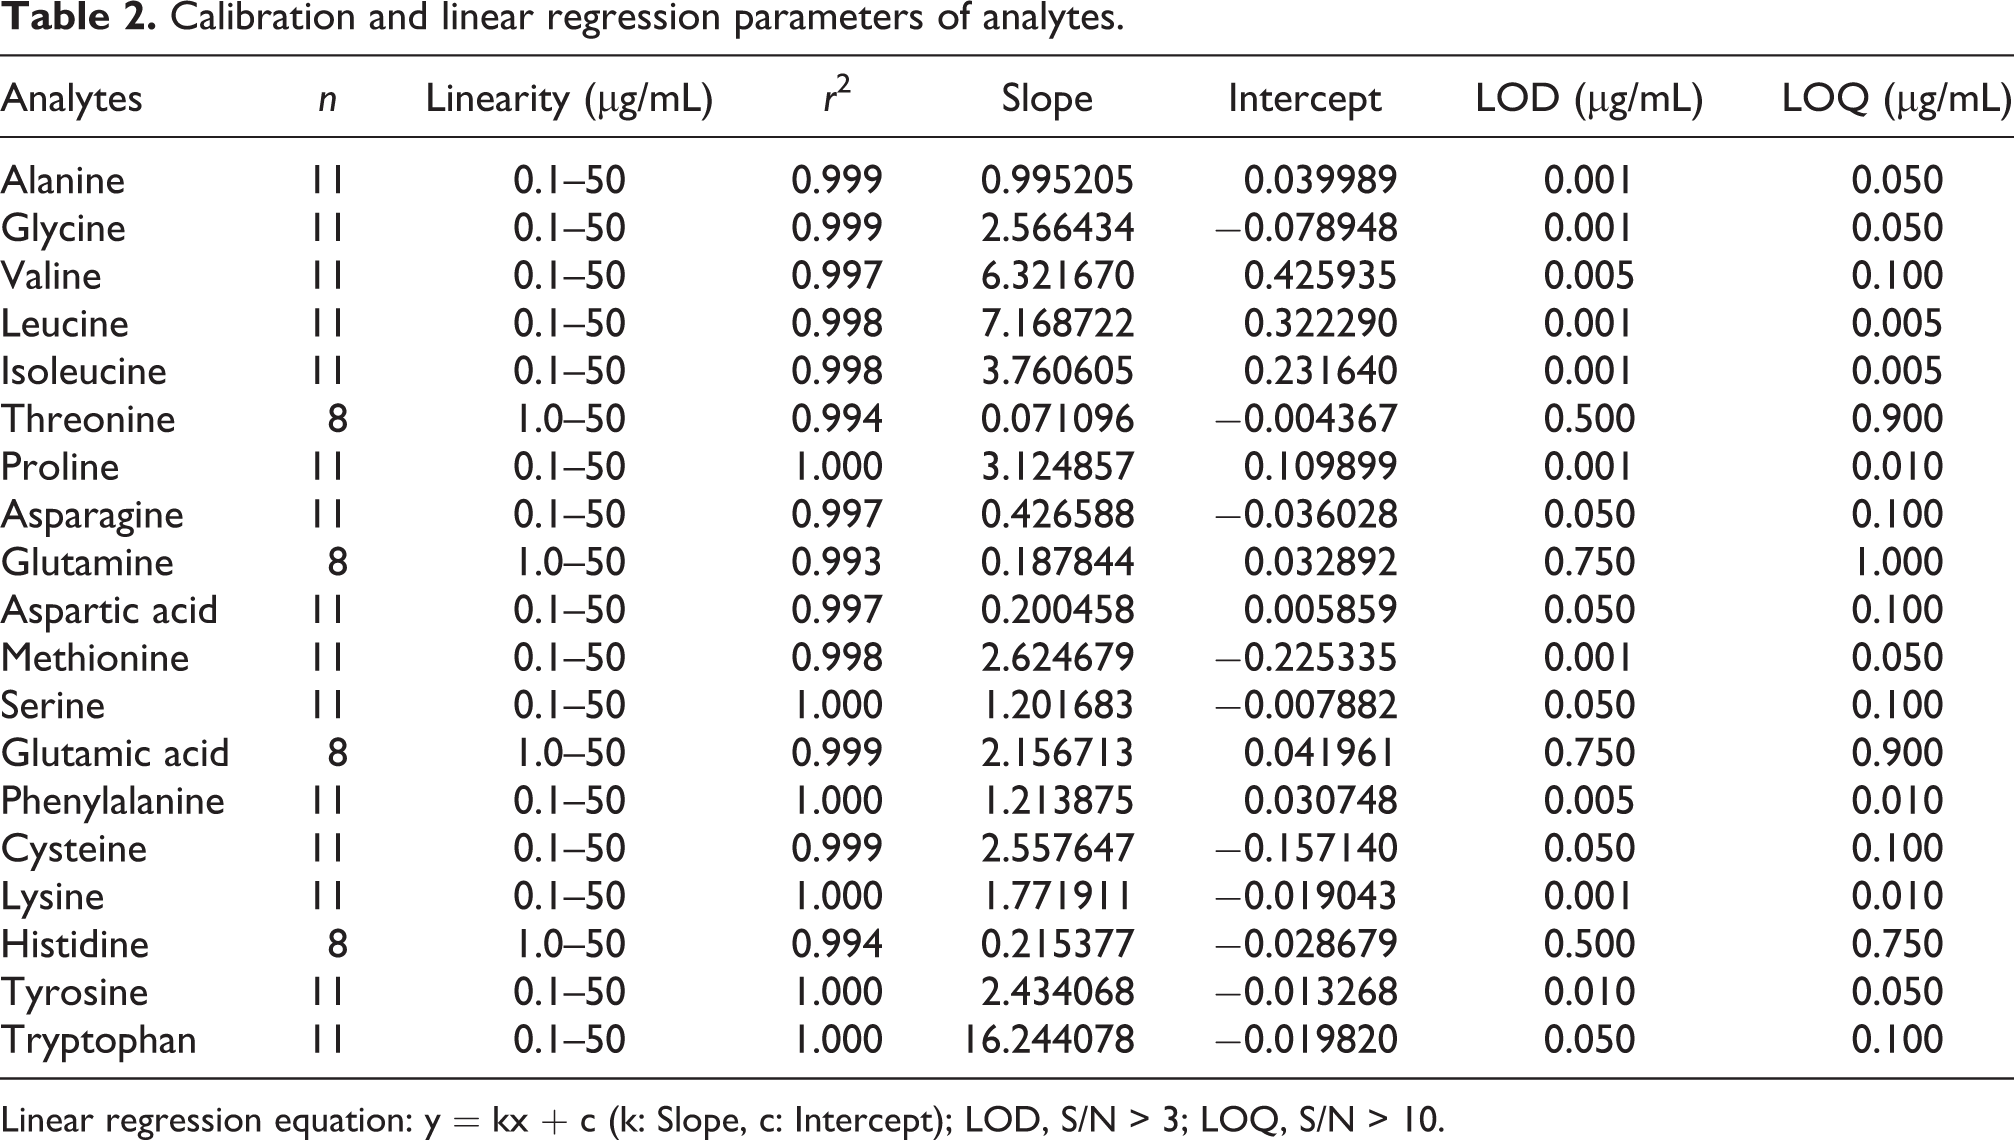
Linear regression equation: y = kx + c (k: Slope, c: Intercept); LOD, S/N > 3; LOQ, S/N > 10.
Summary of precision, accuracy and matrix effect of analytes in serum.
Determination of amino acids in serum
The validated GC-MS/MS method was then applied to determine serum concentrations of amino acids in rats. Altogether, 19 amino acids in rat serum were simultaneously quantified by GC-QqQ-MS/MS. The TIC of rat serum sample was presented in Figure 3(B). The determined contents of 19 serum amino acids were summarized in Table 4. These data indicated that the higher serum contents of amino acids in the TP-treated group were surveyed when compared with the control group. Serum concentrations of alanine, valine, leucine, proline, glutamine, glutamic acid, lysine, tyrosine and tryptophan were significantly upregulated in the TP-treated rats when compared with controls. More importantly, the serum levels of glutamine and tyrosine increased more than ∼8- and ∼10-fold over control levels, respectively. On the contrary, serum concentration of aspartic acid was significantly downregulated in the TP-treated rats when compared with controls.
Content results of serum amino acids quantified by GC-QqQ-MS/MS.

Content data were expressed as mean ± SD, **p < 0.01 and ***p < 0.001 versus control group.
PCA and OPLS-DA analysis of GC-MS/MS data
The analyses of PCA and OPLS-DA were performed with the concentration data determined by GC-MS/MS after being normalized. The first two principal components (PCs) from PCA could explained 85.7% of the systematic variation. The two PCs scores plot of PCA (Figure 4(A)) showed that a distinct clustering between the two groups, thereby indicating that the serum amino acid metabolic profiling of control and TP-treated rats were different. As shown in Figure 4(B), control and TP-treated groups were perfectly separated in distinct regions from two PCs score plot of OPLS-DA. R2Y and Q2 were generally used to estimate the quality of OPLS-DA model, which represented the explanatory and predictive power of the model, respectively. The OPLS-DA model was usually considered good model if the values of R2Y and Q2 were greater than 50%. 23 Three parameters of the OPLS-DA model were as follows: R2X = 78%, R2Y = 89.5%, and Q2 = 78.4%. Furthermore, the OPLS-DA model was validated by permutation (200 times). The intercept values between the regression lines of R2 and Q2 and vertical axis served as important criteria to evaluate whether the model was overfitting. In general, the model was valid if the intercept value of Q2 regression line was below zero. 24 Permutation plot (Figure 5(A)) showed that the intercept value of Q2 regression line was −0.476, consequently indicating that the OPLS-DA model was effective and could be further used to identify the amino acid biomarkers for TP-induced liver injury.

The PCA score plot (A) and OPLS-DA score plot (B) derived from control and TP-treated groups using the metabolic profile of amino acids in serum. Two PCs score visualization for sample types. The score plots indicated a clear separation between the control and TP-treated groups.
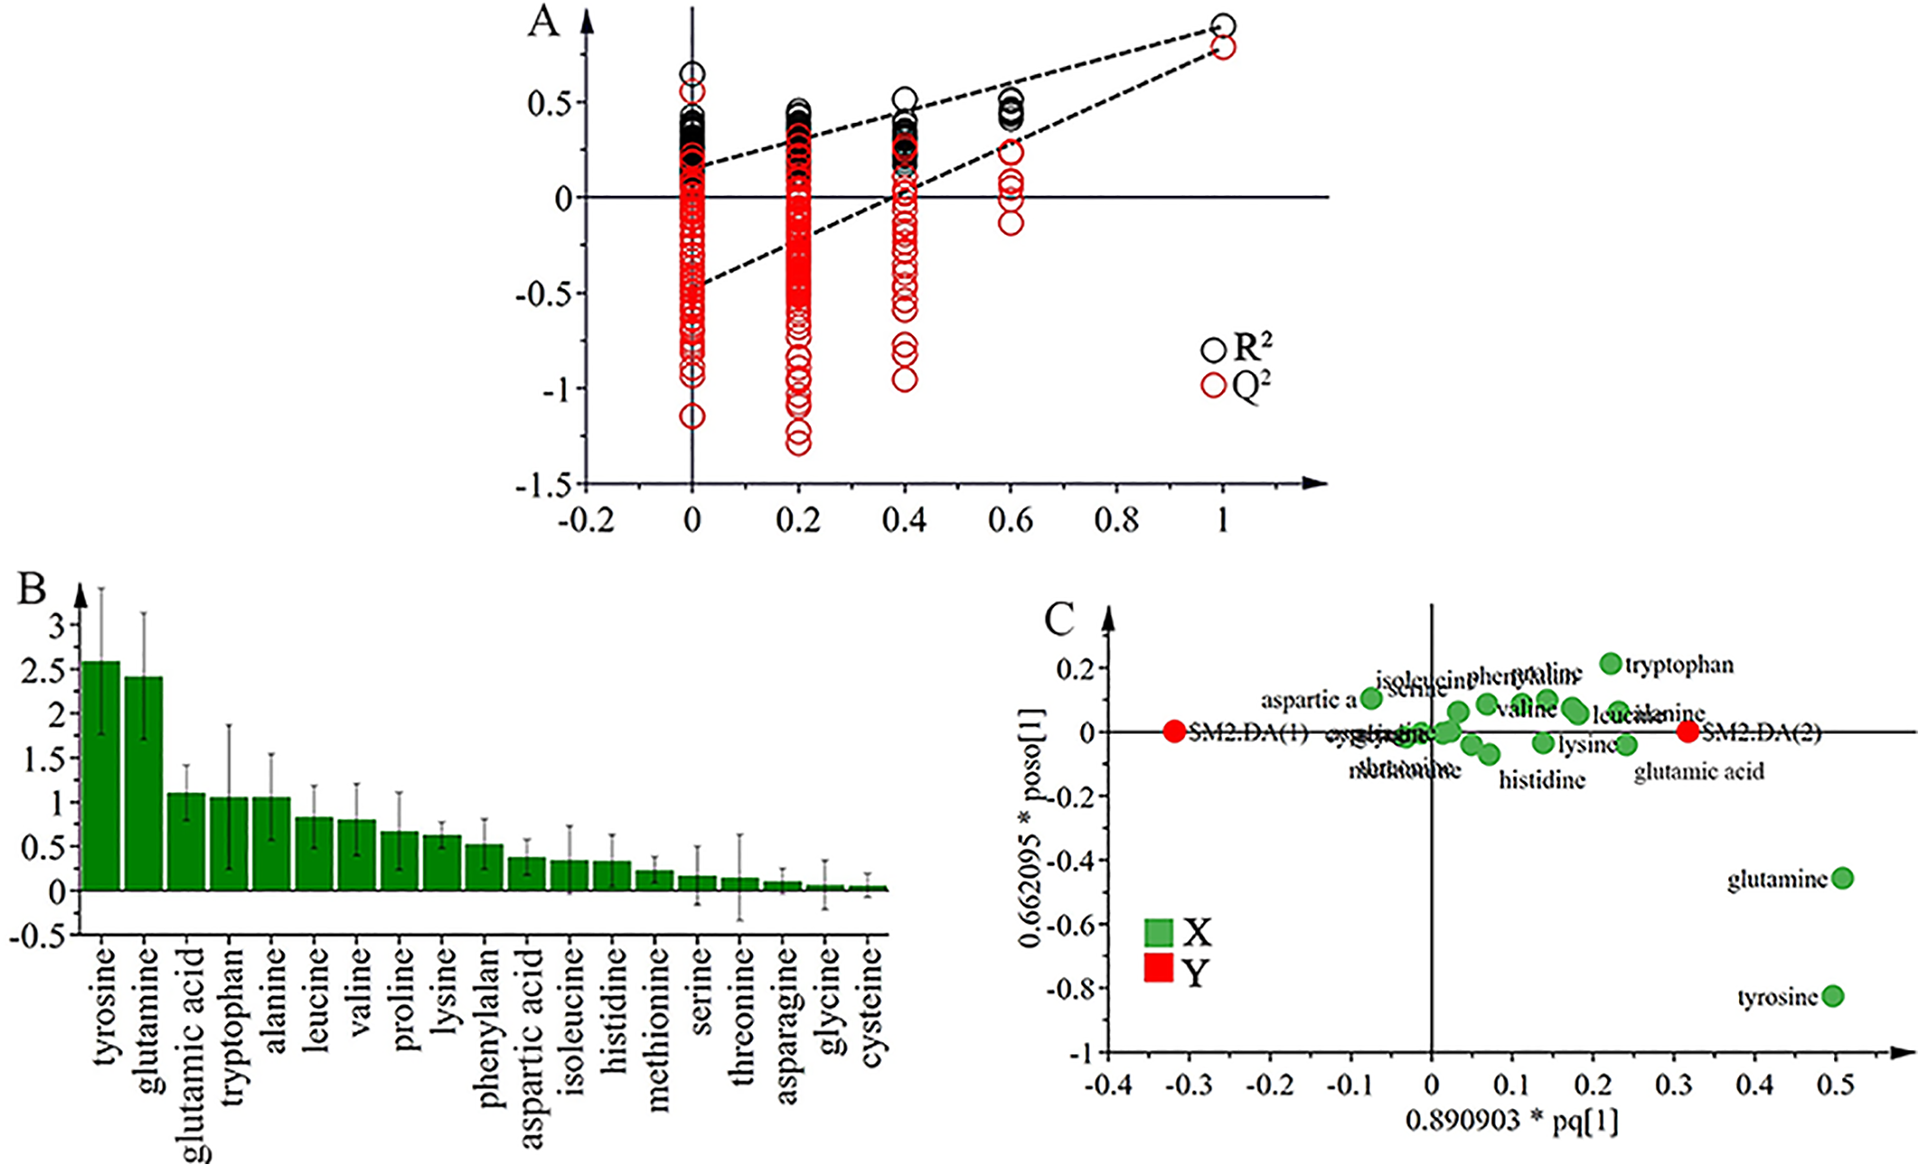
Analysis of potential biomarkers of TP-treated groups using OPLS-DA. The OPLS-DA model (R2X = 78%, R2Y = 89.5%, and Q2 = 78.4%) was constructed based on the metabolic profile of amino acids from control and TP-treated groups. (A) The result of permutation test (n = 200) indicated the original OPLS-DA model was valid. (B) VIP plot confirmed the significance of these potential biomarkers in classification (VIP > 1.0). (C) The OPLS loading plot showed the correlation between individual amino acid and TP-induced liver injury.
Analysis of potential biomarkers for TP-induced hepatotoxicity
The Loading and variable importance in projection (VIP) plots based on OPLS-DA model were shown in Figure 5(B) and (C). The loading plot represented the correlation between individual amino acid and TP-induced liver injury, where variables (amino acids) far from the coordinate origin were considered to be closely related with TP-induced hepatotoxicity. In general, variables with a VIP value exceeding 1.0 were supposed to importantly contribute to OPLS-DA models. 25 Five amino acids with VIP >1.0 including tyrosine, glutamine, glutamic acid, tryptophan and alanine were identified and confirmed. Serum levels of these species in TP-treated rats were significantly changed (p < 0.5) when compared with control rats through two-tailed student t-test (Table 4). Therefore, the five amino acids may serve as potential biomarkers of TP-induced hepatotoxicity. In addition, Pearson’s correlation analysis was carried out to analyze the correlation between the levels of the five amino acids and the activities of ALT, AST and ALP commonly used as clinical determination of liver diseases. The results of Pearson’s correlation analysis were summarized in Table 5. The correlation coefficient (r) of tyrosine and glutamic acid exceeded 0.5 (p < 0.5), thereby indicating the two species was well positively correlated with TP-induced liver injury.
The results of Pearson’s correlation analysis between amino acids and liver injury indicators.

r, correlation coefficient. The value of r close to 1 indicates perfect correlation.
Discussion
To optimize GC conditions, several capillary columns containing different types of stationary liquid and various temperature programmed were examined. A Zebron ZB-AAA capillary column (only 10 m) and propriate temperature program were employed to achieve a perfect resolution in elven minutes and symmetrical chromatographic peaks for each amino acid. Some chromatographic peaks of endogenous metabolites in serum were observed in the retention time windows of glutamine, aspartic acid and methionine in the selective ion monitoring (SIM) mode. Consequently, MRM mode was applied to determinate the serum amino acids considering that MRM mode has higher sensitivity and selectivity when compared with SIM mode. Both collision energy (CE) and transition ions for each amino acid were also optimized to obtain the most sensitive MRM signals. CE and transition ion data of each amino acid were summarized in Table 4. It is important to select the appropriate internal standard for quantitative analysis of amino acids in serum because different amino acid structures have various response values in EI ionization source. After repeated attempts, it was found that the quantitative analysis of 19 amino acids in serum can be well satisfied by using the 7 isotope-labeled amino acid internal standards, which greatly reduces the isotope consumption and saves the experiment cost. The corresponding internal standard of each amino acid was shown in Table 4. The transition ions of m/z 134→92 for alanine-2,3,3,3-D4, m/z 131→89 for serine-2,3,3-D3, m/z 175→105 for glutamic acid-2,3,3,4,4-D5, m/z 169→125 for phenylalanine-ring-D5, m/z 179→137 for lysine-2,3,3,4,4,5,5,6,6-D9, m/z 170→153 for tyrosine-2,3,3,4,5,6,7-D7 and m/z 135→82 for Tryptophan--indole-D5 were performed in MRM mode, respectively.
In this study, amino acid derived by PCF was the first to be established for GC analysis. Trimethylsilane and chloroformate reagents were usually used as amino acid derivatization reagents in GC analysis. 26 Trimethylsilane derivatization of many amino acids yielded several products and it required that samples and reagents must be anhydrous due to trimethylsilane reagent and products being easily hydrolyzed. Chloroformate derivatization had some advantages of simple reactive condition, rapid derivative reaction as well as single and stable product. However, it was harmful to the health and environment because of its strong toxicity. Methyl (MCF), ethyl (ECF) and propyl (PCF) chloroformate had been used for amino acid derivatization in previous papers by other groups.27–29 The toxicity of PCF was much lower than that of MCF and ECF. PCF was thus selected as the derivatization reagent of amino acids in our study. To be our knowledge, amino acid products derived by PCF in serum was the first to be determined in the MRM mode of GC-QqQ-MS/MS.
Glutamic acid as a glycogenic amino acid, is an inhibitory neurotransmitter and also a precursor of glutathione synthesis, which increases in liver injury. 30 Apart from accumulation of glutamate due to upregulated genes encoding glutamate-producing enzymes including glutaminase, glutamate dehydrogenase 1 and glucosamine-6-phosphate isomerase, impaired GSH biosynthesis also contributes to this increase in liver injury. 31 GSH, an antioxidant in body, can protect cells from oxidative damage. The increase of glutamic acid has biological significance in the damaged liver, which can increase glutamate consumption through feedback regulation of glutamate-cystein ligase catalytic subunit, thereby serving to augment GSH biosynthesis. 32 Tyrosine is the precursor to the catecholamine neurotransmitters dopamine and norepinephrine, which can regulate the nervous system and accelerate metabolism. 33 The disorder of tyrosine metabolism can lead to a variety of genetic diseases, such as tyrosinemia 34 and phenylketonuria. 35 Moreover, it has certain correlation with liver 36 and kidney diseases, 37 neurodegenerative diseases 38 and malignant tumors. 39 In mice, the Sp1/TFR2/hepcidin signaling pathway is inhibited due to the disorder of tyrosine metabolism, it will lead to excessive accumulation of iron ions, and then increase the intracellular reactive oxygen species free radicals, thereby inducing liver injury. 40 Glutamine is the most abundant free amino acid in human body, which not only can regulate immunity and maintain acid-base balance, but also has significant antioxidant effect. 41 It can reduce hepatocyte apoptosis by improving antioxidant and inhibit inflammatory capacity, which has certain potential in adjuvant treatment of liver injury. 42 Tryptophan, one of the essential amino acids, is involved in many physiological functions. Except for forming proteins in the human body, it is also a precursor for the synthesis of serotonin and nicotinic acid. Tryptophan plays an important role in regulating growth, mood, hemorheology and immune response. 43 More than 95% of tryptophan in human body is decomposed by tryptophan-2,3-oxygenase in liver cells. When hepatocytes are damaged, the content and activity of this enzyme are decreased, and the ability of tryptophan decomposition is reduced definitely, which leads to the increase of tryptophan concentration in plasma. 44 At present, the clinical diagnosis of liver injury mainly focuses on the assessment of serum biochemical indicators that include ALT, AST, ALP and TBIL. However, their specificity is not ideal, such as when muscle and heart damage can also cause elevated serum ALT and AST levels. 45 In addition, there was a poor correlation between liver enzyme level and the severity of liver lesions. 46 Liver is an important site of amino acid metabolism, and its damage will certainly cause changes in amino acid levels. In this study, tyrosine and glutamic acid were identified as biomarkers for the evaluation of liver injury. Therefore, if the combination of amino acid biomarkers and biochemical indicators can be used to evaluate liver injury, it is very convincing for the clinical diagnosis.
The different amino acid metabolites in Table 4 were introduced into MetPA (http://www.metaboanalyst.ca/) for pathway analysis. The metabolic pathways were considered to contribute the most when its impact value >0.1 and -log P >2. Five metabolic pathways closely related to TP-induced liver injury were identified (Figure 6), which were phenylalanine, tyrosine and tryptophan biosynthesis, alanine, aspartate and glutamate metabolism, glutamine and glutamate metabolism, phenylalanine metabolism and arginine biosynthesis. The network of altered pathways was shown in Figure 7. These metabolic pathways have been shown to be closely related to drug toxicity mechanisms, and their disruption could contribute to oxidative stress injury, inflammation, and cell membrane damage.47–49 It was found that liver cells (PMH) mice treated toxic doses of 3,4-Methylenedioxypyrovalerone caused dysregulation in these pathways that were obtained for our study, except for arginine biosynthesis. 50
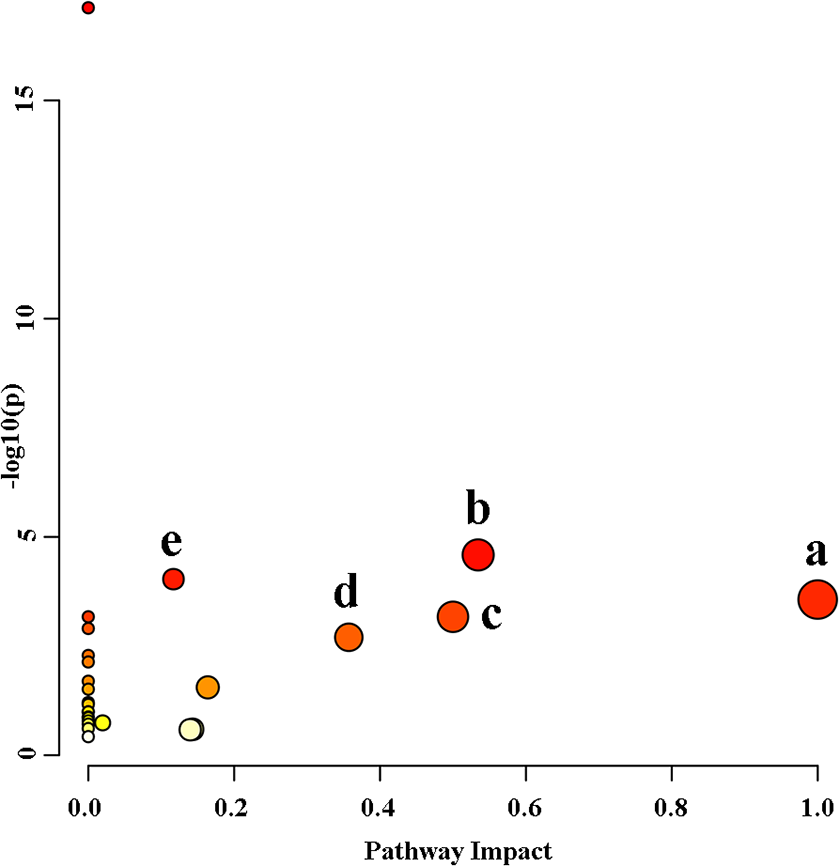
Metabolic pathways associated with TP-treated liver injury model. a: Phenylalanine, tyrosine and tryptophan biosynthesis; b: Alanine, aspartate and glutamate metabolism; c: Glutamine and glutamate metabolism; d: Phenylalanine metabolism; e: Arginine biosynthesis.
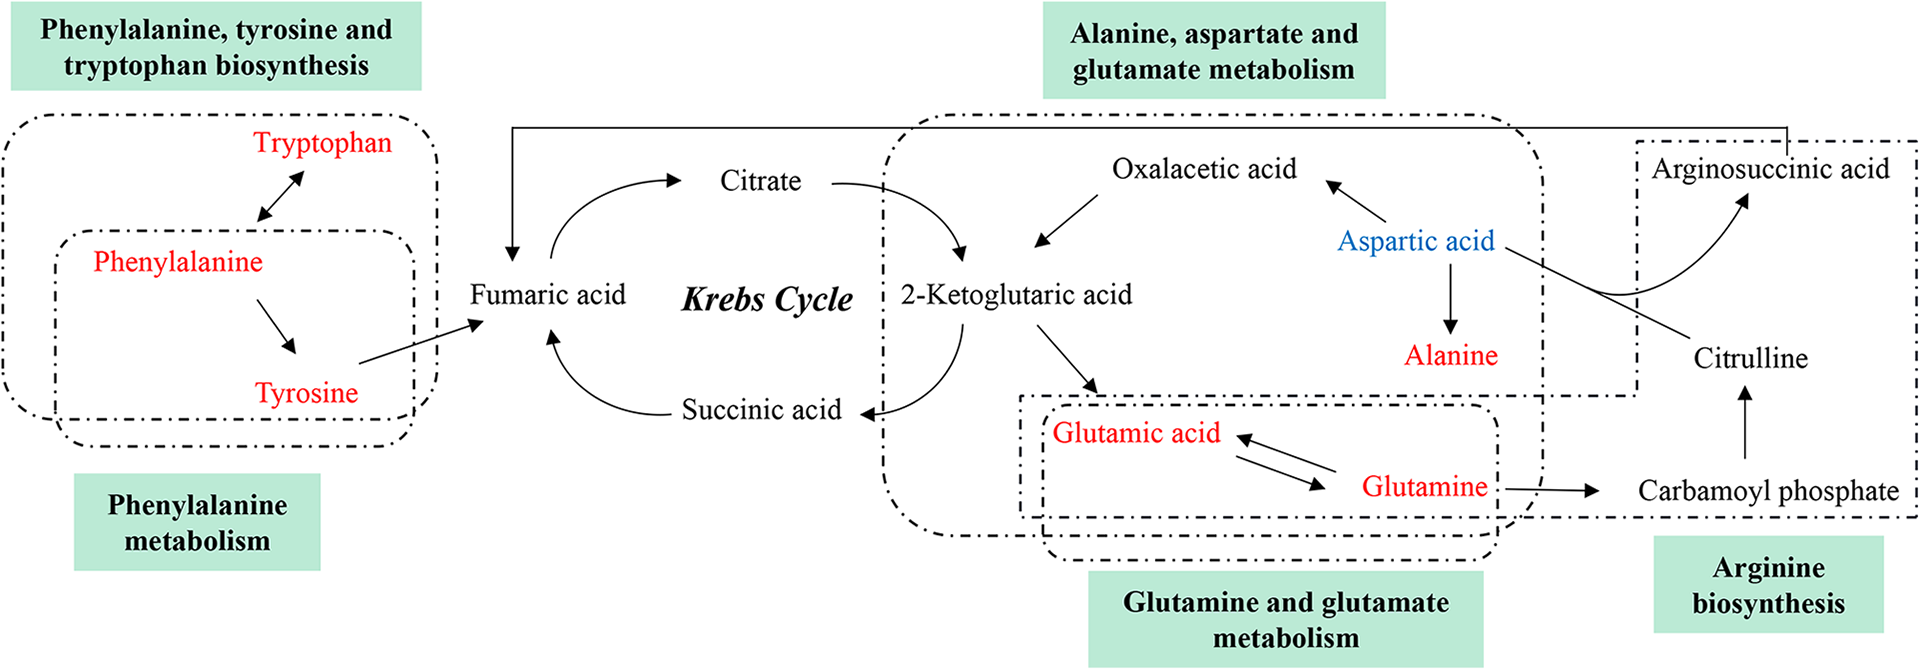
The network of altered metabolic pathways in response to TP-treated in rat. The upregulated metabolites were labeled with red and downregulated with blue respectively.
In the study, a rapid and sensitive GC-QqQ-MS/MS method was developed and validated for quantitative 19 amino acids in serum, which represent important progress for the analysis of amino acids in biological samples. Our results indicated that the analyses of PCA and OPLS-DA can differentiate between TP-induced and control groups just 24 h after TP administration. Serum amino acids including tyrosine, glutamine, glutamic acid, tryptophan and alanine were identified as potential amino acid biomarkers of TP-induced liver injury. According to Pearson’s correlation analysis, tyrosine and glutamic acid exhibited a high positive correlation (r > 0.5, P < 0.05) with current liver injured indicators, including ALT, AST and ALP. In brief, these results of our study showed that the amino acid metabolic profiles were closely correlated with TP-induced hepatic damage, thereby suggesting that a novel metabolomic method based on metabolic profiles of amino acids detected with GC-QqQ-MS/MS may be a complementary assay in clinical diagnosis of chemical-induced liver injury.
Footnotes
Authors’ note
Cong Hu and Hongwei Li contributed equally to this work.
Declaration of conflicting interests
The author(s) declared no potential conflicts of interest with respect to the research, authorship, and/or publication of this article.
Funding
The author(s) disclosed receipt of the following financial support for the research, authorship, and/or publication of this article: This work was supported by the National Natural Science Foundation of China (No. 81660692), Natural Science Foundation of Jiangxi Province (20181BAB215041), Science and Technology Project Founded by the Education Department of Jiangxi Province (GJJ170683, GJJ180606), and Jiangxi Provincial Key Laboratory of Drug Design and Evaluation (20171BCD40015).