
Abstract
In this study, we developed a serum and urine metabolomic method based on gas chromatography–mass spectrometry (GC-MS) combination with biomedical results to evaluate the effect of vitamin E treatment on methomyl poisoning rats. The rats were divided into three groups: the control group, methomyl poisoning group, and vitamin E treatment group. Partial least squares discriminate analysis (PLS-DA) showed that methomyl poisoning induced metabolic perturbations. Compared to the control group, based on the urinary metabolomics data, the level of ribitol,
Introduction
Methomyl is a systemic broad-spectrum N-methyl carbamate insecticide, which is widely used in agriculture. Higher application rates may improve the control of insects but also increase the risk of phytotoxicity and threaten human health through direct contact and long-term bioaccumulation of food or water. The study showed that methomyl could cause renal damage and induce oxidative stress by increasing lipid peroxidation and perturbations in the antioxidant defense system in CD-1 mice. 1 Methomyl was a strong genotoxic agent that can induce micronuclei, chromosomal aberrations, and sister-chromatid exchanges. An in vitro study showed methomyl could induce cell DNA damages and apoptosis in a concentration- and time-dependent manner. 2
Vitamin E, a lipid-soluble chain-breaking antioxidant, has been considered for its protective potential in various toxic conditions in the past few years. 3,4 Vitamin E can limit the propagation of chain reaction of lipid peroxidation and may inhibit the production of lipid peroxidation. Garg et al.’s 5 study showed vitamin E pretreatment effectively increases the activity of catalase, platelets counts, and total leucocytes count and normalizes the levels of lipid peroxidation, reduced glutathione, superoxide dismutase, and glutathione peroxidase in methomyl-treated rats. Hassani et al.’s 6 study reported that the coadministration of vitamin E and curcumin could prevent the oxidative damages induced by chlorpyrifos in rat lung tissues.
Metabolomics is an important science for the understanding of biological systems and predicting biological behavior by the analysis of metabolites. 7 Metabolomics refers to the comprehensive analysis of metabolites in biological systems and has been employed to study the serum and urinary metabolite profile of patients and animals. With the great development of metabolomics technology, it is widely used for the investigation of potential biomarker discovery and understanding the molecular mechanisms of disease. In this present study, a metabolomics approach is made based on gas chromatography–mass spectrometry (GC-MS) to evaluate the metabolomic alterations of methomyl poisoning and control rat groups. The purpose of this study is to find the potential biomarkers and mechanism of methomyl poisoning and to investigate the protective potential of vitamin E in methomyl poisoning rats based on the body fluid metabolomics data.
Experimental
Instrumentation and conditions
Agilent 6890N-5975B GC/MS with HP-5MS (0.25 mm × 30 m × 0.25 mm) was purchased from Agilent Company (Santa Clara, California, USA). The metabolomics GC-MS conditions and sample preparation were set according to our previous work. 8
Animal treatment and sample collection
Twenty-four Sprague-Dawley rats (male, 220 ± 20 g) were purchased from Shanghai SLAC Laboratory Animal Co., Ltd. and housed under a 12-h light/dark cycle condition with a controlled temperature (22°C). The rats were randomly divided into three groups: the control group (n = 8), methomyl poisoning group (n = 8), and vitamin E treatment group (n = 8). Vitamin E treatment group was given vitamin E (50 mg/kg) by intraperitoneal injection, then given methomyl 10 mg/kg by intragastric injection. The methomyl poisoning group was given methomyl 10 mg/kg by intragastric injection. The control group was given normal saline by intragastric injection. All experimental procedures were approved ethically by the Animal Studies Ethics Committee of Wenzhou Medical University.
Serum and urine samples were collected from the rats from the control group, methomyl poisoning group, and vitamin E treatment group at 8:00 am after two days, respectively. The blood samples were collected and then centrifuged at 8000 g for 10 min at 4°C. The serum was stored at −80°C until measurement.
Biochemical tests
After metabolomics study, the blood was collected from the tail vein for biochemical tests of serum alanine aminotransferase (ALT), aspartate aminotransferase (AST), alkaline phosphatase (ALP), urea, creatinine (Cr), and uric acid (UA). Serum samples were analyzed to measure the serum activities of ALT, AST, ALP, urea, Cr, and UA, which were used to evaluate the liver and kidney function.
Data analysis
The GC-MS data were exported to Microsoft Excel, with the peaks normalized to the total sum of spectrum prior to multivariate analyses. The resulting data were processed through principal component analysis (PCA) and partial least squares discriminate analysis (PLS-DA) using SIMCA-P 11.5 software (Umetrics, Umea, Sweden). PCA was used to find the intrinsic variation in the data set. PLS-DA was focused on finding variation in the data, which revealed the differences in serum and urine composition of the two groups.
Statistical analysis
Statistical analysis was performed using SPSS software (version 18.0; SPSS). Independent samples t-test was applied in order to detect significant differences in all metabolites between two groups. A p value less than 0.05 was considered significant.
Results and discussion
Metabolomics study
Figure 1 provides the typical metabolic profiles of serum and urine acquired through GC-MS technique. Metabolic profile data pretreatment resulted in a final data set consisting of 70 metabolic features from GC-MS analyses. The endogenous metabolites in the serum and urine were identified using the NIST 2005 mass spectrometry database (Laboratory Animal Centre of Wenzhou Medical University).

Typical GC-MS total ion chromatogram of rat serum (a) and urine (b) after acute methomyl poisoning by vitamin E. GC-MS: gas chromatography-mass spectrometry.
In order to explore the metabolic profile alterations of the effect of vitamin E treatment on methomyl poisoning rats, we compared the GC-MS serum spectrum of PCA and PLS-DA in the methomyl poisoning group and vitamin E treatment group with the rats in the control group (Figures 2(a) and 3(b)). Figure 2(a) PCA and Figure 3(a) PLS-DA score charts show that the first principal components of the vitamin E treatment group were not distinguished from the control group, the corresponding load diagram is shown in Figures 2(a) and 3(b), and the PLS-3D is shown in Figure 3(c). Subsequently, we compared the GC-MS urine spectrum of the PCA and PLS-DA in the methomyl poisoning group and vitamin E treatment group with the rats in the control group (Figures 4(a) and 5(a)). Figure 4(a) PCA and Figure 5(a) PLS-DA score charts show that the first principal components of the vitamin E treatment group were not clearly distinguished from the control group, the corresponding load diagram is shown in Figures 4(b) and 5(b). The PLS-3D score chart in Figure 5(c) shows that principal components of the vitamin E treatment group were distinguished from the control group clearer than two-dimensional Figure 5(a) and 5(b).

PCA score results of rat serum samples (a) after acute methomyl poisoning by vitamin E. Vitamin E (class 1), acute methomyl poisoning (class 2), control (class 3); the corresponding load diagram (b). PCA: principal component analysis.

PLS-DA score results of rat serum samples (a) after acute methomyl poisoning by vitamin E. Vitamin E (class 1), acute methomyl poisoning (class 2), control (class 3); the corresponding load diagram (b); PLS-3D score result (c). PLS-DA: partial least squares discriminate analysis. PLS-3D: partial least squares three dimensional.
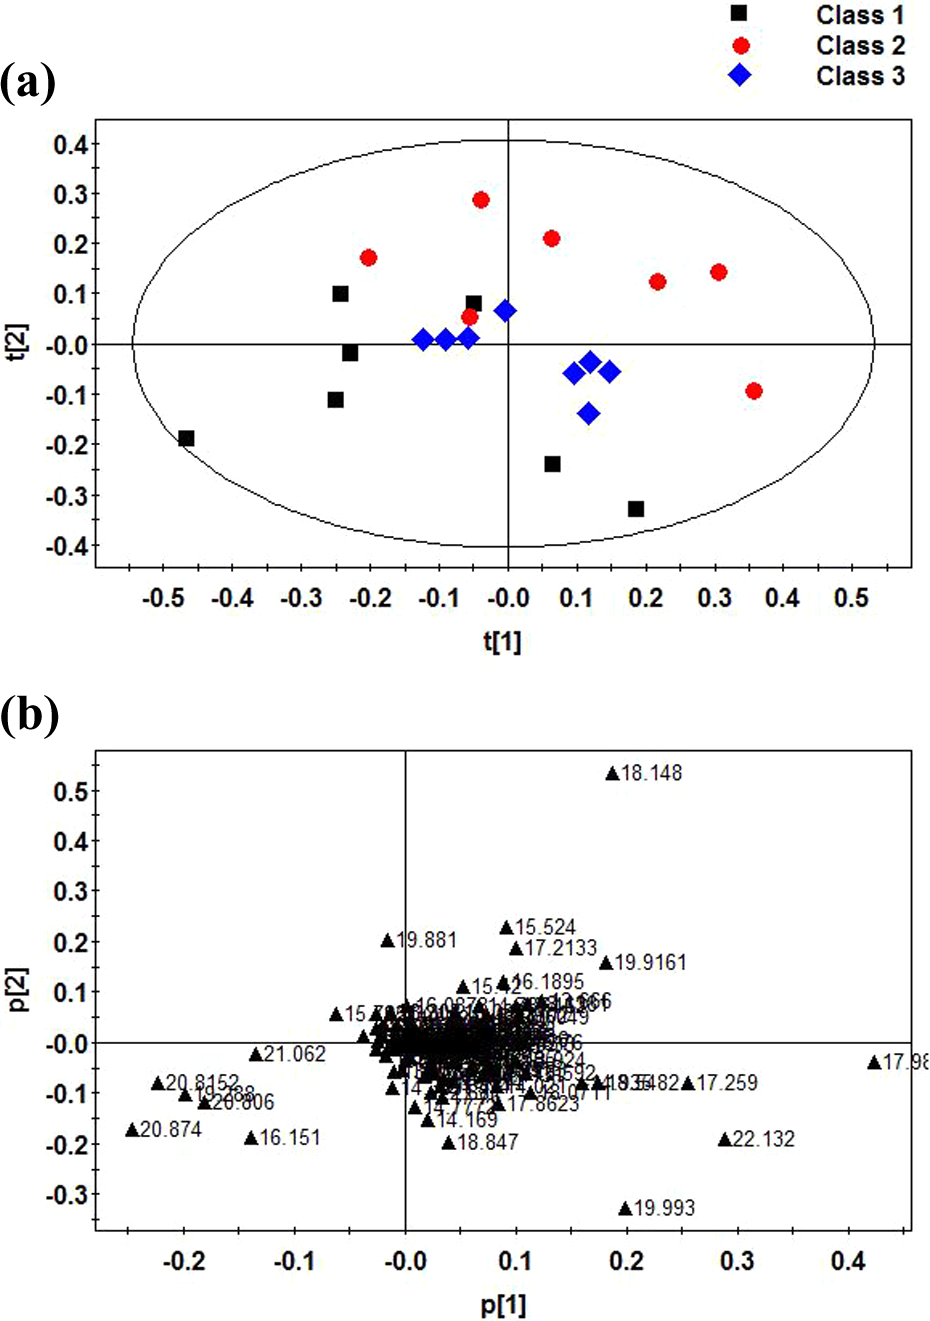
PCA score results of rat urine samples (a) after acute methomyl poisoning by vitamin E. Vitamin E (class 1), acute methomyl poisoning (class 2), control (class 3); the corresponding load diagram (b). PCA: principal component analysis.

PLS-DA score results of rat urine samples (a) after acute methomyl poisoning by vitamin E. Vitamin E (class 1), acute methomyl poisoning (class 2), control (class 3); the corresponding load diagram (b); PLS-3D score result (c). PLS-DA: partial least squares discriminate analysis. PLS-3D: partial least squares three dimensional.
Figure 3(c) shows that methomyl poisoning rats could be distinguished from control group, and then methomyl poisoning rats could be separated from vitamin E treatment group rats; however, the direction was different from the control group, indicating that the vitamin E pretreatment had a certain effect, but the rats were not restored to their original appearance as the control group.
We could see in Figure 5 that the data set to distinguish between serum was not very satisfactory, and only vitamin E treatment group was significantly different from the control group and poisoning group. It indicated that vitamin E pretreatment had a certain effect in methomyl poisoning rats. When compared Figure 5 to 3, the metabolomics data of serum was not good as that of urine metabolomics.
Biochemical tests
We could see the biochemical results from Table 3. There was no significant difference in ALT, urea, Cr, and UA among the three groups. However, the level of AST and ALP increased in the methomyl poisoning group compared to the control group, and the AST increased in the vitamin E group compared to the control group, while the AST decreased when compared to methomyl poisoning group. The level of ALP in vitamin E and the control group has no significant difference. According to the biochemical results, it indicated that vitamin E treatment could reduce the level of AST and ALP in methomyl poisoning. As a whole, it has no significant difference in serum biochemical results, which could not be the biomarkers for methomyl poisoning diagnosis and prognosis.
Changes in metabolite
Metabolomics, a newly emerging omics approach, was used to explore metabolic profiles induced by environmental or endogenous factors. 9 –15 It is based on the analysis of the entire spectrum of low-molecular-weight endogenous compounds that can be used as metabolic biomarkers that would represent an alternative approach of significant importance to detect hidden effects. In this study, the changes of metabolites between vitamin E treatment groups, the control group, and methomyl poisoning group are shown in Tables 1 and 2.
Summary of the changes in relative levels of metabolites in rat plasma after acute methomyl poisoning treated by vitamin E.

PLS-DA: partial least squares discriminate analysis.
aVariable importance in the projection (VIP) was acquired from the PLS-DA model with a threshold of 1.0. Marks indicate the direction of the change, i.e., ↓ for decrease, ↑ for increase.
bCompared with control group.
cCompared with acute methomyl poisoning group.
d p < 0.05, as indicated by the statistical analysis t-test.
e p < 0.01, as indicated by the statistical analysis t-test.
Summary of the changes in relative levels of metabolites in rat urine after acute methomyl poisoning by vitamin E.
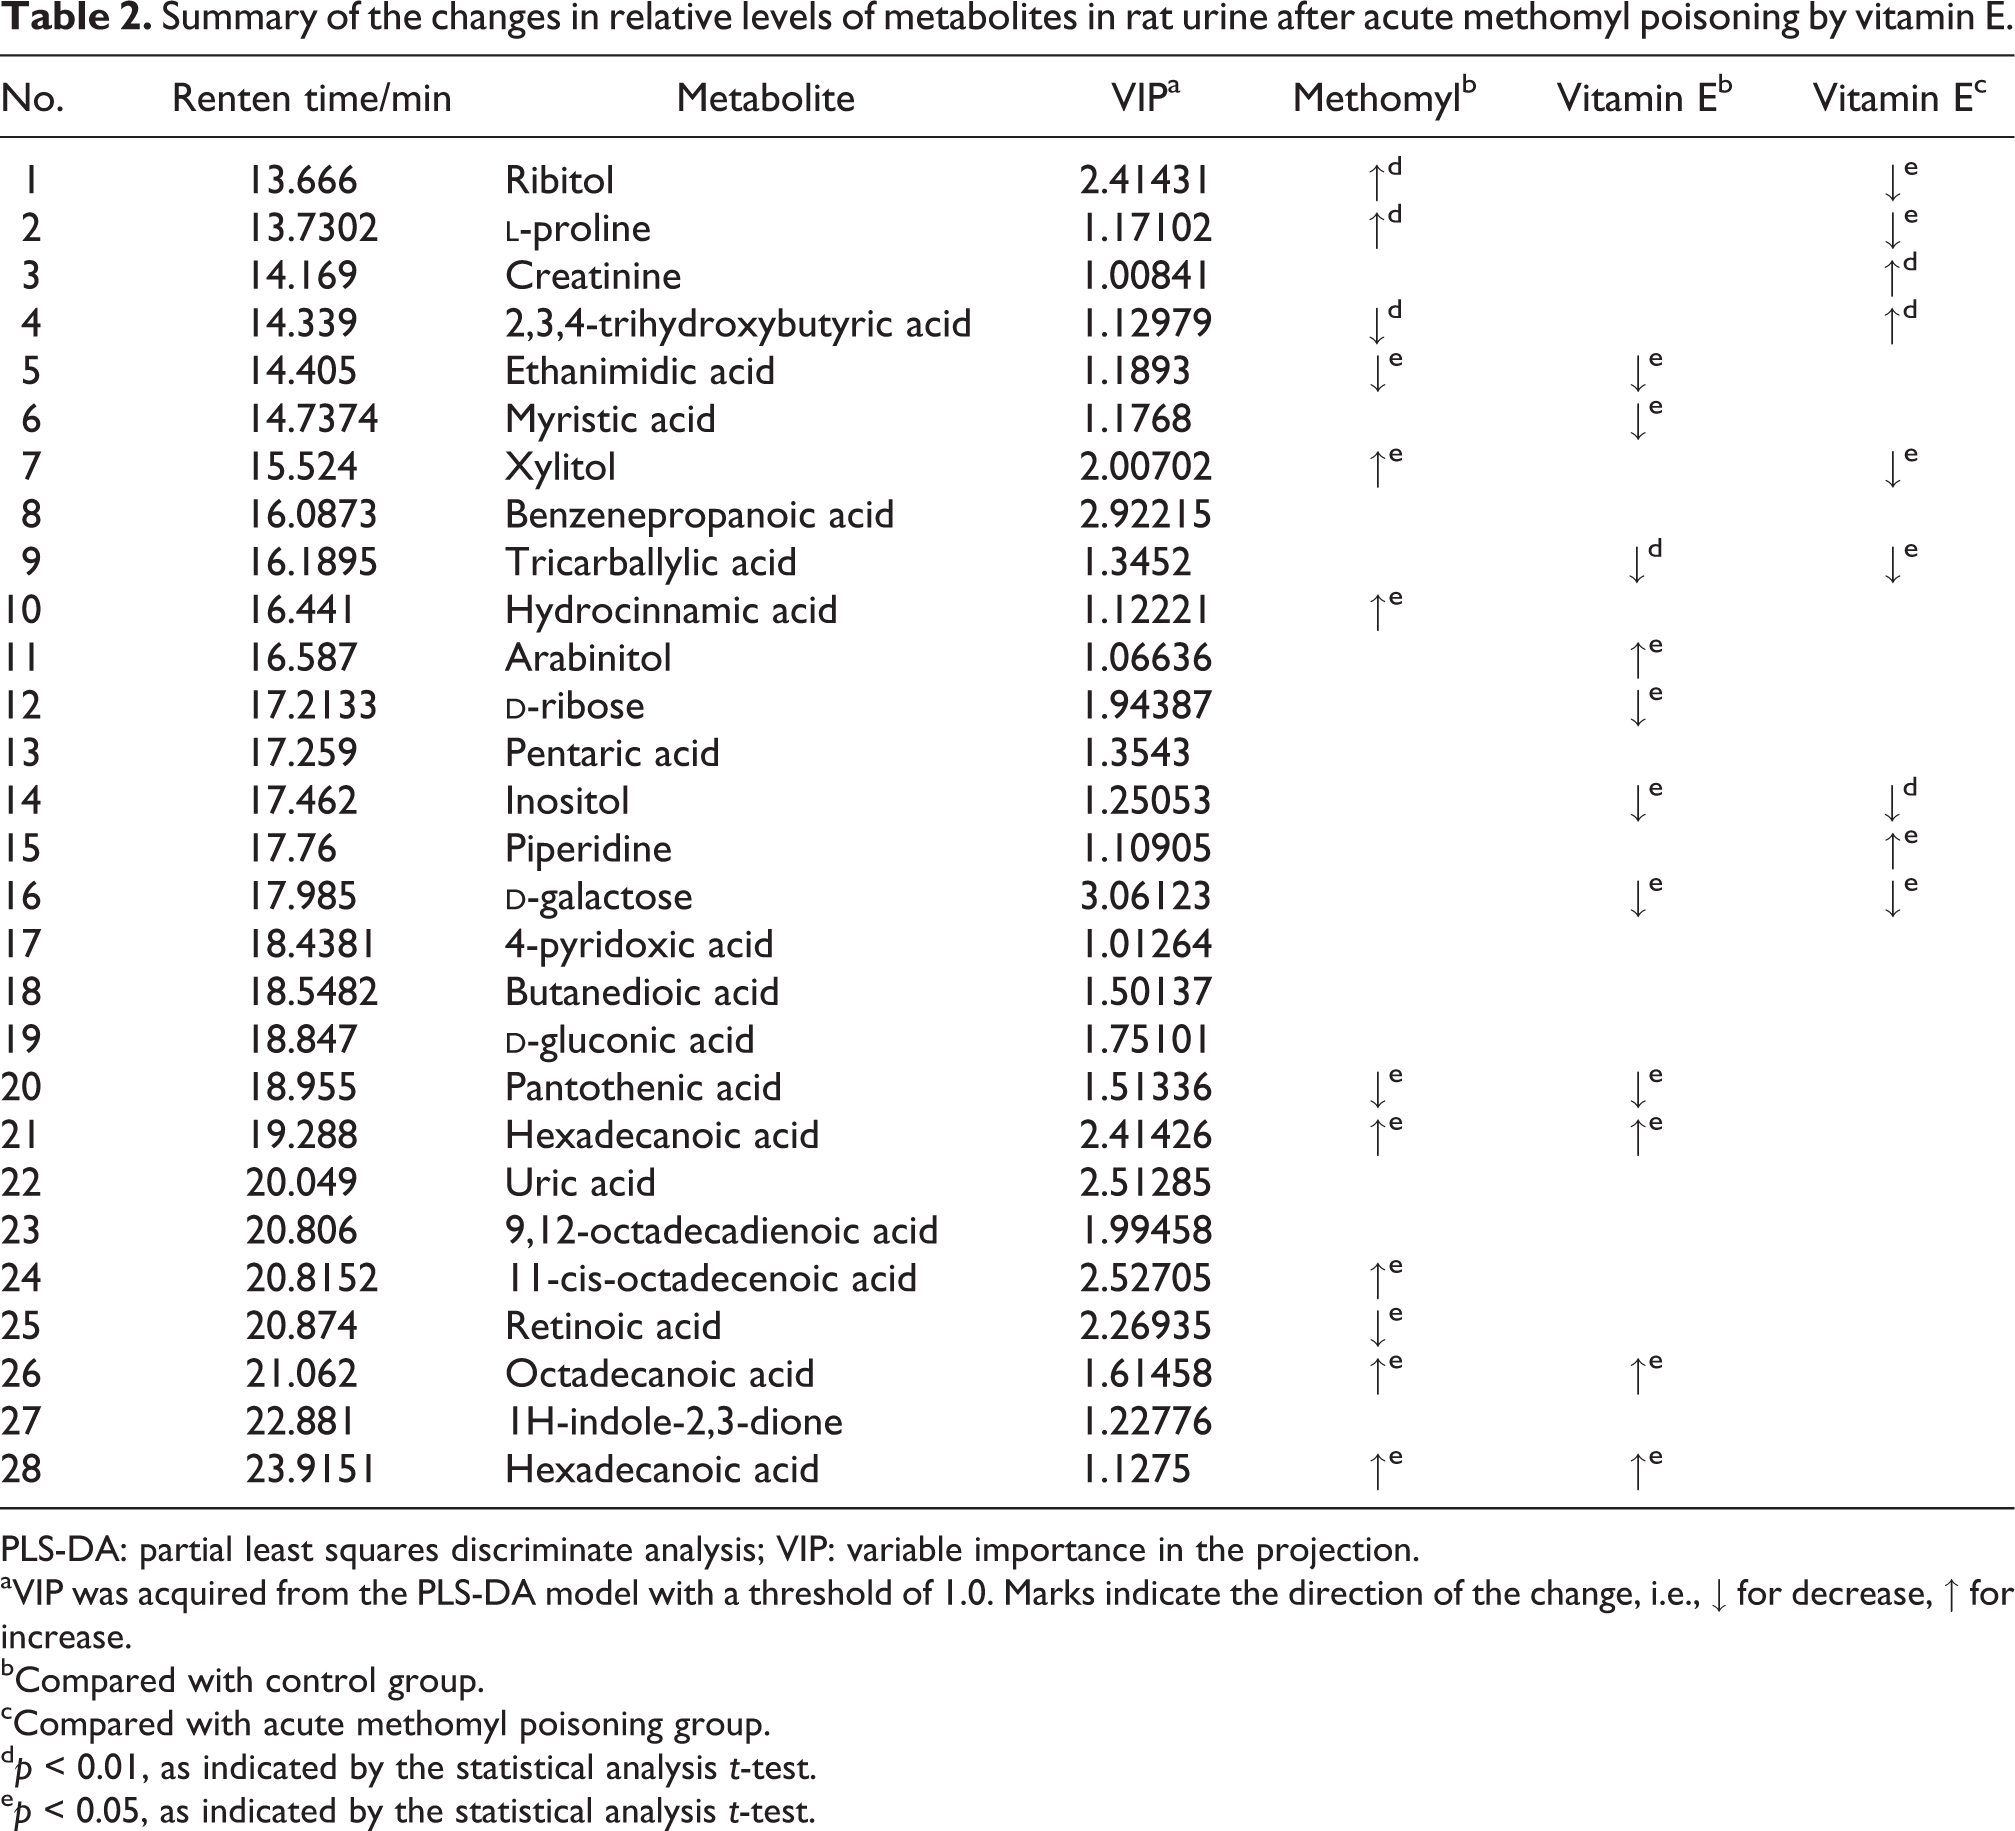
PLS-DA: partial least squares discriminate analysis; VIP: variable importance in the projection.
aVIP was acquired from the PLS-DA model with a threshold of 1.0. Marks indicate the direction of the change, i.e., ↓ for decrease, ↑ for increase.
bCompared with control group.
cCompared with acute methomyl poisoning group.
d p < 0.01, as indicated by the statistical analysis t-test.
e p < 0.05, as indicated by the statistical analysis t-test.
Biochemical results in rat serum after acute methomyl poisoning by vitamin E.

a p < 0.05; compared with control group as indicated by the statistical analysis t-test.
b p < 0.05; compared with acute methomyl poisoning group as indicated by the statistical analysis t-test.
c p < 0.01; compared with control group as indicated by the statistical analysis t-test.
We demonstrated that metabolomic methods based on GC-MS could provide a useful tool to evaluate the effect of vitamin E treatment for methomyl poisoning rats, combined with the biochemical results, and it indicated that vitamin E treatment could reduce the degree of methomyl poisoning. In this study, the changes of metabolites between control groups and acute methomyl poisoning group are shown in Tables 1 and 2. There was no significant difference between the control group and acute methomyl poisoning group in rat plasma. In rat urine, the level of ribitol,
Ribitol and xylitol are polyols that are formed by the reduction of sugars and classified based on the number of carbon atoms, and the urinary concentrations of polyols can be used to diagnose inborn errors of metabolism. 16 Studies showed that the ribitol and xylitol concentrations in urine were highly elevated in patients with transaldolase (TALDO) deficiency. 16,17 Our study showed that both of them increased in rat urine after acute methomyl poisoning, which may indicate that methomyl inhibited the activity of TALDO. A significant decrease in ribitol and xylitol concentrations was observed after vitamin E pretreatment. This decrease might be the result of improvement of TALDO activity.
Hexadecanoic acid, 11-cis-octadecenoic acid, and octadecanoic acid are metabolites of fatty acids. Fatty acids can be broken down into their metabolites via oxidation reaction, in the end generating acetyl-coenzyme A (CoA), for the tricarboxylic acid cycle (TCA).
18
In this study, most fatty acid metabolites in urine were increased significantly in acute methomyl poisoning group compared with that in control group, which demonstrated an enhanced metabolism rate of fatty acid decomposed by β-oxidation. As we know, methomyl can induce oxidative damage by increasing lipid peroxidation, which may perturb the glycometabolism.
18,19
This enhanced fatty acid metabolism was possibly related to the insufficient energy production of glycometabolism. And the increasing urine levels of
Hydrocinnamic acid, also called 3-phenylpropionic acid, is a kind of aromatic acids that are important organic chemicals widely used in food, pharmaceutical, and chemical industries. 20 Hydrocinnamic acid can serve as the starting unit for the production of pharmaceuticals such as rasagiline, which is used to treat Parkinson’s disease and in many other pharmaceuticals, 21 and its esters can be used to produce herbicides and pesticides. 22 Normal urine contains very little hydrocinnamic acid. In this study, the hydrocinnamic acid in urine was increased significantly in acute methomyl poisoning group compared to the control group, which may indicate that methomyl inhibited the metabolic pathway of hydrocinnamic acid. The hydrocinnamic acid was decreased significantly in vitamin E group which might mean that vitamin E can enhance the hydrocinnamic acid metabolism. But this is only a speculation, and more prospective studies will be required for a better understanding.
Retinoic acid, the metabolic intermediate of vitamin A, and pantothenic acid are critical micronutrients. Most of the actions of vitamin A are considered to be mediated primarily by retinoic acid, which regulated gene transcription by combining with the retinoic acid receptors and the retinoid X receptors. 22 –24 Vitamin A is metabolized to retinoic acid in two steps by oxidation. Vitamin A is first oxidized to retinaldehyde by retinol dehydrogenase. 25 Retinaldehyde is then further oxidized to retinoic acid by aldehyde dehydrogenase. 26 The retinoic acid in urine is decreased significantly after acute methomyl poisoning, which may indicate that methomyl attenuated the oxidative metabolism of vitamin A by inhibiting the activity of retinol dehydrogenases and aldehyde dehydrogenase. Pantothenic acid is a type of B vitamin and is water soluble, hence the body can’t store it. The extra pantothenic acid left the body through urine when the body can’t use all of it. Pantothenic acid is a substrate for the synthesis of the ubiquitous CoA that contributes to glycometabolism, lipid metabolism, and protein metabolism. In this study, the pantothenic acid in urine was decreased significantly after acute methomyl poisoning, which may be related to the enhanced catabolic and anabolic enzymatic reactions by oxidative metabolism.
2,3,4-Trihydroxybutyric acid (erythronic acid) is the diastereomer of threonic acid. A low concentration of 2,3,4-trihydroxybutyric acid is always observed in both urine and plasma. 27 Engelke et al. 28 found that the excretion of 2,3,4-trihydroxybutyric acid was increased in TALDO deficiency patients and speculated that the flux through the pentose phosphate pathway is disturbed, leading to the accumulation of 2,3,4-trihydroxybutyric acid. Our data show that acute methomyl poisoning would lead to a reduction of 2,3,4-trihydroxybutyric acid. It is an interesting observation that acute methomyl poisoning could lead to this change and one that has not been previously reported in poisoning patients.
The serum ethanimidic acid may provide a potentially metabolic biomarker in distinguishing hepatocellular carcinoma patients from the normal patients. However, the role of ethanimidic acid in the metabolism of acute methomyl poisoning needs to be identified by further research.
Conclusion
These biomarkers (ribitol,
Footnotes
Declaration of Conflicting Interests
The author(s) declared no potential conflicts of interest with respect to the research, authorship, and/or publication of this article.
Funding
The author(s) disclosed receipt of the following financial support for the research, authorship, and/or publication of this article: This study was supported by Zhejiang Provincial Natural Science Foundation of China (Nos. LY15H150008 and LQ17H010004), Zhejiang Medicines Health Science and Technology Program (Nos. 2016KYB189 and 2014KYA144), and WenZhou Science and Technology Bureau (Nos. Y20140493 and Y20140688).