
Abstract
The adrenocortical human cell line H295R is a valuable tool for screening endocrine disrupting compounds. In general, previous research focus has been on the production of the 2 sex steroids, 17β-estradiol and testosterone, and less attention has been paid to other important steroid end points in the steroidogenesis with a wide range of physiological functions, such as the glucocorticoids (corticosterone and cortisol). A newly developed and validated solid phase extraction (SPE) liquid chromatography–mass spectroscopy (LC-MS/MS) method was used to measure the production of cortisol and corticosterone in the H295R cell line. The method was applied by studying the effects of 2 model endocrine disrupters, ketoconazole and prochloraz, the pharmaceutical budesonide, and the inducer forskolin on the steroid production in this cell line. Dose–response curves were obtained for the correlation between hormone concentrations and the concentration of the individual disruptors. Exposing cells to ketoconazole resulted in a decrease in cortisol and corticosterone concentrations in a dose-dependent manner with EC50 values of 0.24 and 0.40 μmol/L, respectively. The same applied for cells exposed to prochloraz with EC50 values of 0.06 and 0.09 μmol/L for cortisol and corticosterone, respectively. Budesonide also inhibited glucocorticoid secretion. The EC50 value for cortisol was 19.50 μmol/L, whereas the EC50 value for corticosterone was 71.42 μmol/L. Forskolin induced the secretion of both cortisol (EC50 = 4.09 μmol/L) and corticosterone (EC50 = 0.28 μmol/L). The results obtained demonstrated the validity of the method. Based on these findings, quality criteria for the production of these steroids in this cell line were suggested.
Introduction
The H295R cell line is a human cell line developed from an adrenocortical carcinoma.1,2 Recently, the Organization for Economic Cooperation and Development (OECD) published a guideline for the testing of chemicals using the H295R cell line describing in vitro screening for endocrine disrupting effects. 3 This cell line expresses all the key enzymes necessary for steroidogenesis and produces all major steroids such as progestogens, sex steroids, mineralocorticoids, and glucocorticoids, corresponding to the 3 layers of the adrenal cortex.4,5 In general, previous research focus has been on the production of the 2 sex steroids, 17β-estradiol and testosterone,2,6 and recently Nielsen et al 7 published a chemical analytical method for the H295R assay, quantifying 7 key progestogens, androgens, and estrogens in the steroidogenic pathway. Less attention has been paid to other important steroid end points in the steroidogenesis with a wide range of physiological functions, such as the glucocorticoids, corticosterone, and cortisol. Presently, the OECD guideline only provides quality criteria for the determination of testosterone and 17β-estradiol, although this cell line is very useful for studies on several other steroids in this pathway. The human steroidogenesis is shown in Figure 1.
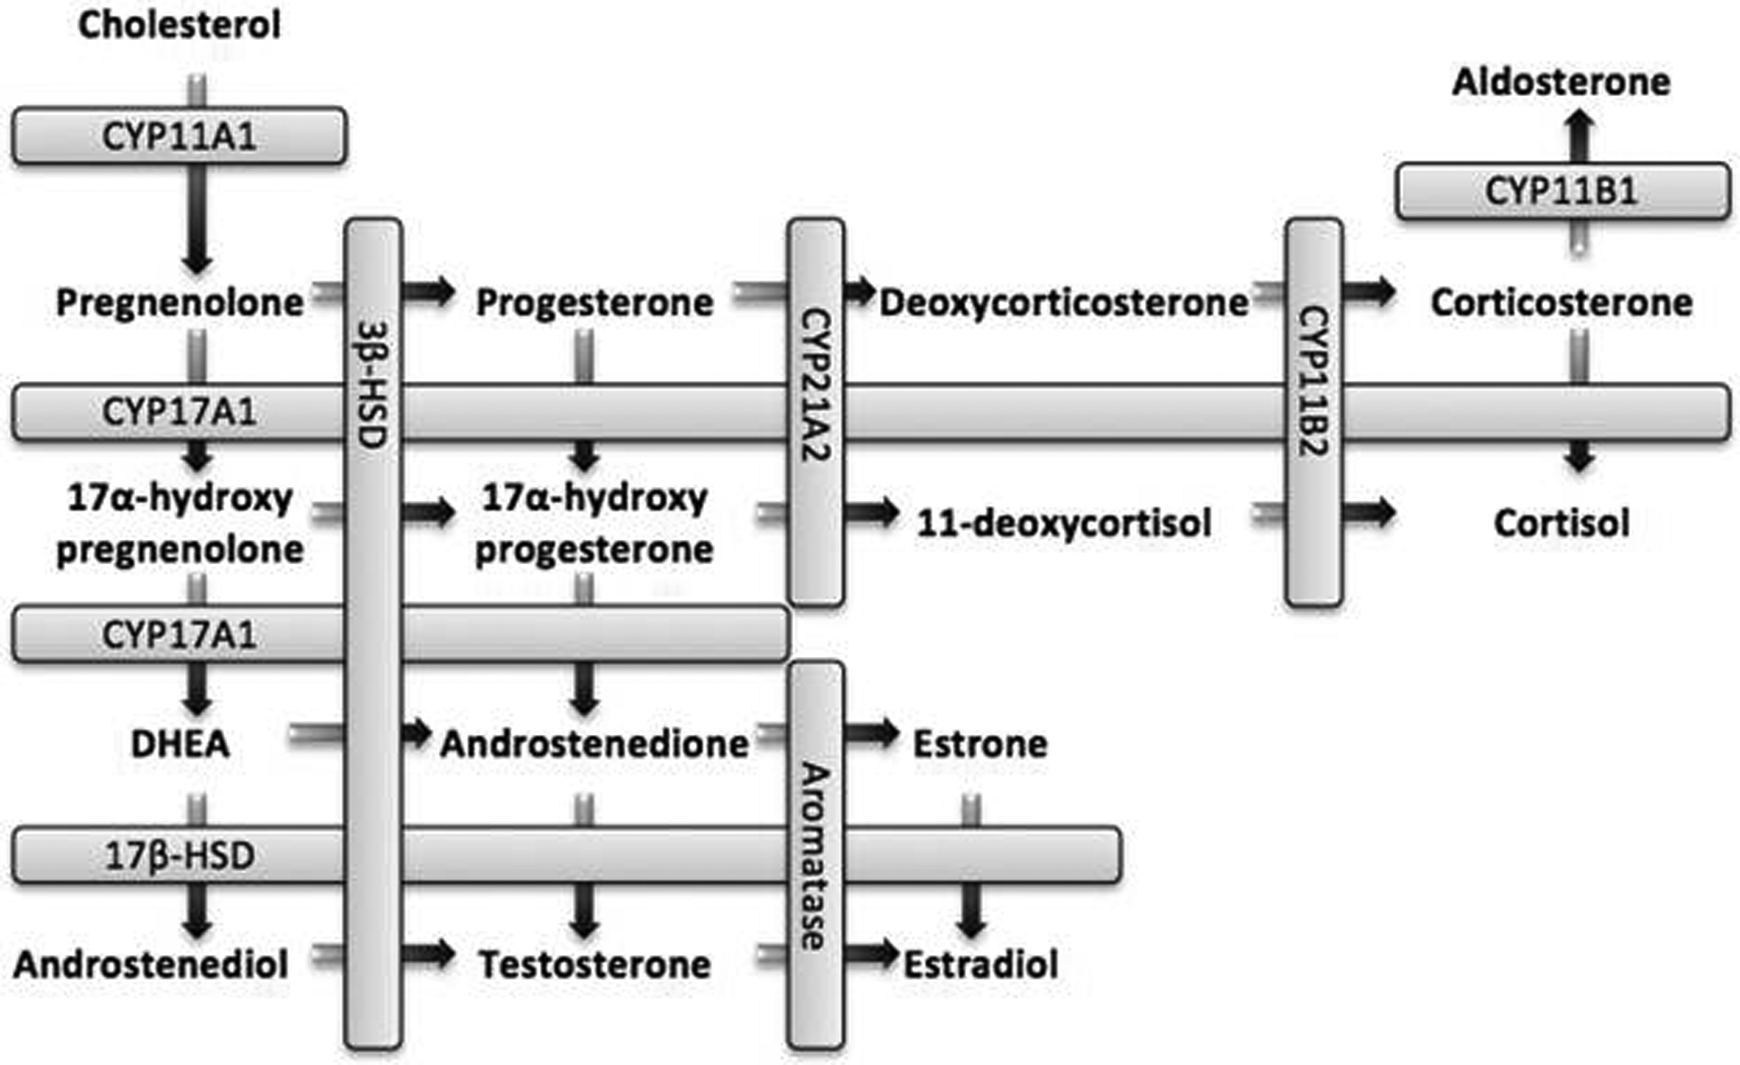
Overview of the human steroidogenesis. Also shown in boxes are the enzymes metabolizing the steroids in this pathway.
In vertebrates, glucocorticoids play a major role in response to stress. They are involved in the mobilization of glucose and amino acids in muscle and lipid tissues. These steroids also stimulate the production of the enzymes involved in the liver gluconeogenesis. Corticosterone is the precursor for cortisol and aldosterone, and Addison disease is characterized by a deficiency in the production of cortisol and corticosterone resulting in muscular weakness, low blood pressure, depression, loss of weight, and hypoglycemia. Cushing syndrome is caused by an excessive production of cortisol and corticosterone resulting in, for example, buffalo hump, thinning of the skin, thin arms and legs, increased abdominal fat, and poor wound healing. 8
In order to understand the effect of endocrine disrupting chemicals on corticosteroids, and in order to develop methods for high-throughput screening of such effects, a reliable analytical method is required for simultaneous determination of cortisol and corticosterone based on quality criteria similar to those of 17β-estradiol and testosterone in the OECD guideline. 3 Radioimmunoassay (RIA) and enzyme-linked immunosorbent assay (ELISA) are typically used to quantify for steroids. However, these methods can be time consuming, and since these techniques rely on antibody affinity some degree of cross-reactivity may occur. 2 To avoid especially the risk of erroneous quantification of the structurally similar steroid hormones or hormone mimicking xenobiotics, modern cleanup procedures such as solid phase extraction (SPE) and chromatographic techniques such as liquid chromatography–mass spectrometry (LC-MS) with continuously increasing sensitivity are becoming good alternatives. Carefully validated methods for such analyses should therefore be developed.
The objective of this study was to investigate endocrine disruption of corticosteroids in the H295R cell line, using a newly developed and validated SPE LC-MS/MS method for the simultaneous determination of the glucocorticoids cortisol and corticosterone. Two model endocrine disruptors (ketoconazole and prochloraz) and budesonide, a drug used in asthma treatment were investigated. Budesonide is particularly interesting to investigate for several reasons. It is a specific glucocorticoid analog, and interactions with cortisol and cortisone endocrinology may therefore be anticipated. Also, budesonide is 1 of the only 2 drugs approved for the treatment of asthma in both pregnant women and children,9,10 but it is used in much higher quantities than the other approved drug, fluticasone. 11 Furthermore, according to Martin et al, 12 budesonide is a more efficient cortisol suppressor than fluticasone when used in dry powder inhalers. Forskolin, a cyclic adenosine monophosphate inducer known to stimulate the production of steroids in the H295R cell line and recommended as a quality control (QC) in the OECD guideline 3 was also included in the study. Based on these findings, quality criteria for the production of these steroids in this cell line were suggested.
Materials and Methods
Cells and Chemicals
The H295R human adrenocortical carcinoma cell line was obtained from the American Type Culture Collection (ATCC, #CRL-2128, Manassas, VA). The cells were cultured in 75-mL flasks (Corning Costar, Fisher Scientific Biotech Line, Slangerup, Denmark; 430641), with 30 mL supplemented media at 37°C with 5% CO2 atmosphere as described by the OECD guideline. 3 The cells were grown in Dulbecco modified Eagle medium/F12 medium (GibcoBRL Life Technologies, Paisar, UK) supplemented with 10 mL/L of ITS + premix and 25 mL/L Nu-serum (BD Bioscience, Brøndby, Denmark). Ketoconazole, prochloraz, budesonide, and forskolin were obtained from Sigma-Aldrich (Glostrup, Denmark). Methanol was from Lab-scan Analytical Sciences (Fisher Scientific Biotech Line, Slangerup, Denmark). High purity (>99%) analytical standards of cortisol and corticosterone were obtained from Sigma-Aldrich. Two stock solutions (each with concentration of 1000 ppm) were prepared for cortisol and corticosterone in methanol, and combined working dilutions from 10 down to 0.01 ng/µL were prepared as well. The deuterated corticoid analog d4-cortisol used as an internal standard was obtained from Toronto Research Chemicals (Ontario, Canada) and had a deuterated purity above 98%. From a 100-ppm stock solution of d4-cortisol in methanol, a 300-ng/mL internal standard was prepared in methanol. All stock and diluted analyte solutions were stored in darkness at −18°C. All utilized solvents were of analytical grade and obtained from Lab-scan Analytical Sciences (Fisher Scientific Biotech Line). Stock solutions for forskolin, ketoconazole, prochloraz, and budesonide were prepared as 1000, 1000, 1000, and 33 000 μmol/L in methanol, respectively. From these stocks, dilutions in phosphate-buffered saline (PBS) buffer were prepared in the range 0.05 to 50, 0.05 to 50, 0.05 to 50, and 0.05 to 500 μmol/L for the 4 compounds, respectively. For the QC plates, stock solution of forskolin and prochloraz of 2000 and 1000 μmol/L, respectively, were prepared in methanol. Dilutions of 100 and 1000 μmol/L PBS buffers were prepared for forskolin, while PBS buffers of 5 and 50 μmol/L were prepared for prochloraz.
H295R Steroid Hormones Synthesis Assay
The H295R steroid hormones synthesis assay was performed and validated as described in the OECD guideline, 3 with minor modifications. In short, the cells were grown in 24-well plates (COSTAR, Bucks, UK) with 3 × 10⁵ cells in 1000 µL supplemented medium for each well and allowed to settle for 24 hours. The medium was then changed and 1000 µL medium containing the test compounds were added. Each compound was tested in 7 to 9 nominal concentrations (Forskolin: 0.001, 0.01, 0.03, 0.1, 0.3, 1.0, 10.0 μmol/L; ketoconazole: 0.001, 0.01, 0.03, 0.1, 0.3, 1.0, 10.0 μmol/L; prochloraz: 0.001, 0.01, 0.03, 0.1, 0.3, 1.0, 10.0 μmol/L; budesonide: 0.01, 0.1, 0.3, 1.0, 3.3, 10.0, 33.0, 100.0, 330.0 μmol/L) on 4 plates (2 plates for budesonide) and repeated on 2 different days. On each test plate, a solvent control (SC) was included with the growth medium containing 1.2% methanol. This is well below 3%, which is the maximum methanol content in the growth medium not causing cytotoxicity. 13 The 4 QC samples were included in each experiment as an internal control for the cell growth and hormone levels. The QC plate included a blank, a SC (1.2% methanol in medium), 2 concentrations of the inducer forskolin (1.0 and 10.0 μmol/L), and 2 concentrations of the inhibitor prochloraz (0.1 and 1.0 μmol/L). The test compounds were dissolved in methanol and not in dimethyl sulfoxide (DMSO; as otherwise suggested in the OECD guideline), as azol fungicides can potentially be difficult to dissolve in DMSO. 14 After 48 hours of incubation in the presence of the test compounds, the medium was carefully removed and transferred to the test tubes.
Potential cell cytotoxicity during experimentation was investigated using the highest concentrations of the test compounds and the solvent controls tested in the Alamar Blue Viability Assay. 15 The cells were incubated with test substances and solvents in their highest applied concentrations as described above. After 48 hours, the medium was replaced with fresh medium containing 5% rezasurin (Sigma-Aldrich, Steinheim, Germany). The plates were incubated for 3 hours, and the fluorescence from the formed resorufin was measured (Ex. 560/Em. 590 nm) on a Wallac Envision 2100 multilabel reader (Perkin ELMER, Waltham, MA). According to O’Brien et al, 15 there is a direct correlation between the formation of resorufin in the growth media and the number of living cells. No significant differences were found in the resorufin formed, between control cells and cells exposed to the highest test compound concentrations. Consequently, none of the tested concentrations resulted in cytotoxicity.
The SPE Cleanup
Sample cleanup was performed using 500 mg solid phase extraction cartridges (Bond Elut C18, Varian Inc, Canada). The cartridges were placed in a VacMaster manifold (IST, Biotage, Uppsala, Sweden), and conditioned with 6 mL methanol and 6 mL MilliQ water (adjusted to pH 3 with diluted sulfuric acid). Prior to loading on the cartridge, the cell medium (1 mL) was adjusted to pH 3 with diluted sulfuric acid and spiked with 50 μL of a 300 ng/mL dilution (in methanol) containing the deuterated analog d4-cortisol as internal standard. The samples were loaded onto the cartridges and washed with 3 mL MilliQ water (pH 3) and dried by vacuum for 30 minutes, followed by elution of the analytes with 1.0 mL acetone. The extracts were evaporated to dryness at 60°C using a gentle flow of nitrogen, prior to reconstitution in 100 μL methanol and diluted with 100 μL MilliQ water. Finally, the samples were transferred to the vials and analyzed using LC-MS/MS.
The LC-MS/MS Steroid Hormone Analysis
The high-performance liquid chromatography was an Agilent 1100 series system (Agilent Technologies, Palo Alto, California) equipped with a degasser, a cooled autosampler (4°C), and a cooled column oven (13°C). Tandem MS was performed using a Sciex API 3000 triple-quadrupole instrument (Applied Biosystems, Foster City, California) equipped with an electro spray ionization source. For both cortisol and corticosterone, the MS was operated in positive ionization mode. The ion transitions and relevant MS parameters are presented in Supplementary Table 1. The LC-MS/MS analyses were performed using a Waters XTerra MS C18 (Waters DK, Hedehusene, Denmark), 2.1 × 100 mm, 3.5 µm column with an isocratic mobile phase consisting of methanol–water (45:55, v/v), at a flow rate of 300 μL/min. The column oven was 40°C, and 5 μL injection volume was used. The total analysis time was 12 minutes. Collection and treatment of data were performed using Analyst 1.4 software (Applied Biosystems) in a Windows XP platform-based data processing system. The LC-MS/MS parameters for cortisol, corticosterone, and the internal standard d4-cortisol can be found in Supplementary Table 1. A chromatogram for a standard containing cortisol and corticosterone and the deuterated analog d4-cortisol, all at a 50 ng/mL concentration level, are shown in Supplementary Figure 1. With the developed method, the steroids were clearly separated.
Validation of the SPE Cleanup and LC-MS/MS Method to Quantitate Cortisol and Corticosterone in H295R Medium (n = 3 at Each Concentration Level; ± SD).
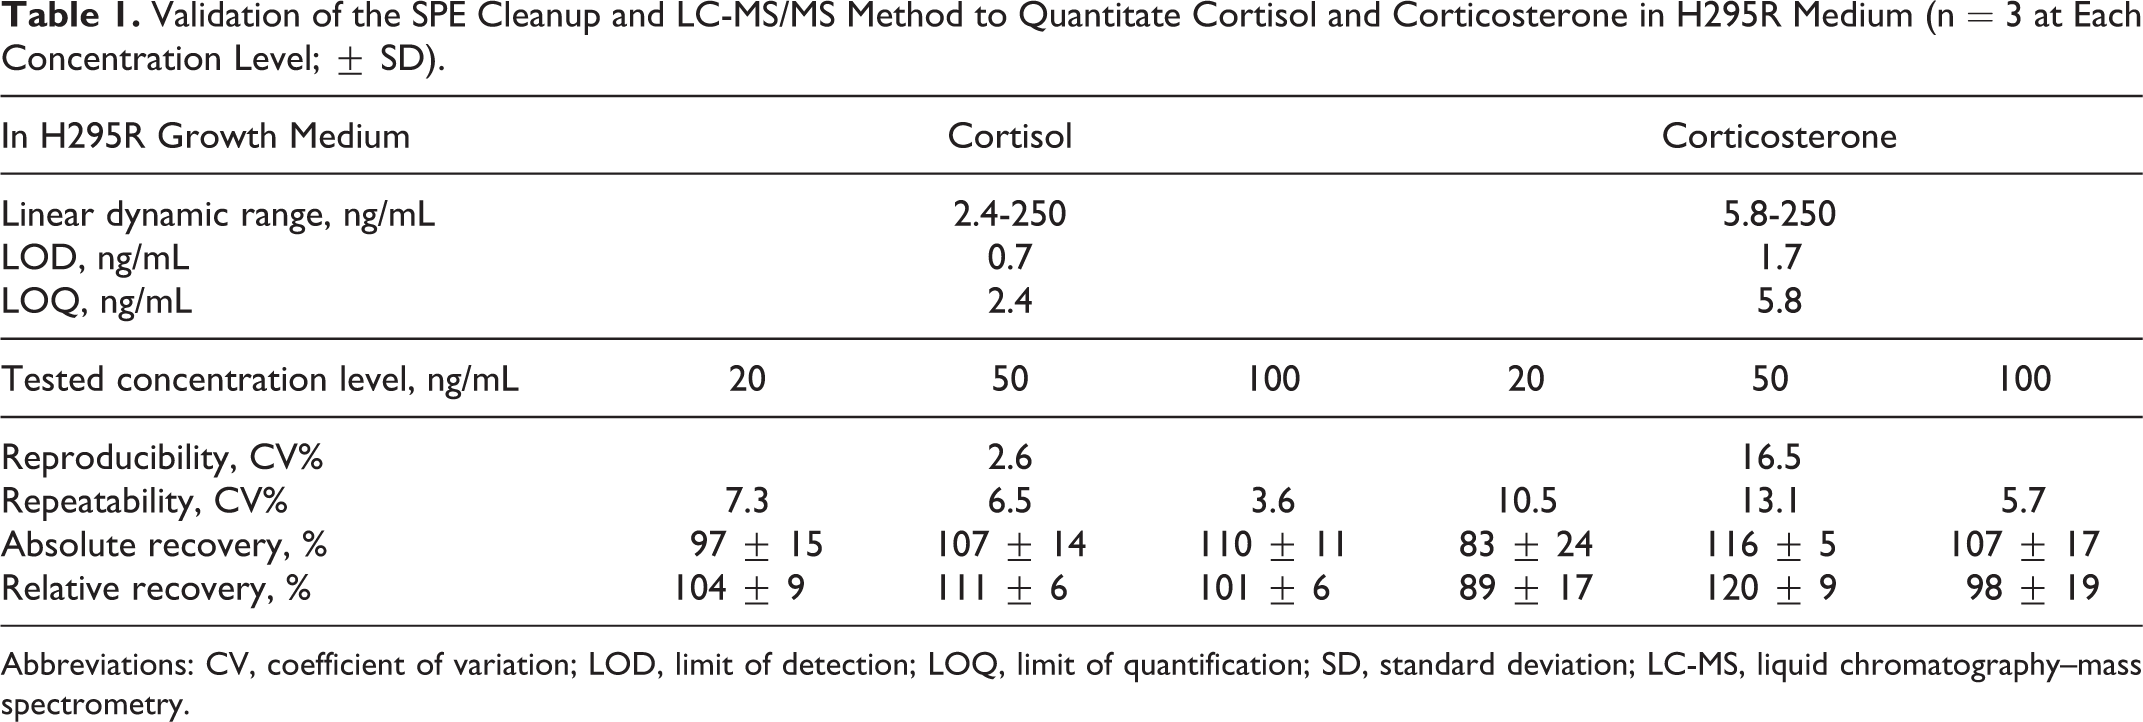
Abbreviations: CV, coefficient of variation; LOD, limit of detection; LOQ, limit of quantification; SD, standard deviation; LC-MS, liquid chromatography–mass spectrometry.
Method Validation
Once the LC-MS/MS separation was set, the linear dynamic range was determined from the calibration curves based on steroid hormone and internal standard peak area ratio versus steroid hormone concentration. The calibration curves for the 2 steroids were established with a 10-point calibration of standards, ranging from 10 to 250 ng/mL, with internal standard fixed at 50 ng/mL at all calibration points. The calibration curves were linear in the entire investigated interval (Table 1). Using a signal-to-noise ratio (S/N) of 3 for the instrument limit of detection (LOD) and 10 for the instrument limit of quantification (LOQ), these limits were calculated from the chromatogram of a 50 ng/mL standard (Table 1). The LOD and LOQ were expressed as absolute amount of individual steroid hormones required in the LC vial containing a 1 mL of sample, extracted and redissolved in 100 μL methanol and 100 μL water. For cortisol, the LOD and LOQ were 0.7 and 2.4 ng/mL, respectively, whereas the LOD and LOQ were 1.7 and 5.8 ng/mL for corticosterone (Table 1).
Validation of the developed SPE method was obtained by experiments studying the method’s accuracy and repeatability (Table 1). The method accuracy was assessed using a steroid hormone pre- and post-spike recovery experiment 16 at 20, 50, and 100 ng/mL concentration levels in blank H295R growth medium (n = 3). This experiment demonstrated good absolute recoveries in the range 97% to 110% for cortisol and 83% to 116% for corticosterone. The relative recoveries (to the internal standard) were also very good, being in the range of 101% to 111% for cortisol and 89% to 120% for corticosterone (Table 1). Method repeatability was assessed using the coefficient of variation (CV %) from the pre-spiked growth medium at the 3 concentration levels and was also very good with low values in the range 3% to 7% and 5% to 13% for cortisol and corticosterone, respectively (Table 1). Day-to-day variation in method, or reproducibility, was investigated by pre-spiking 3 blank H295R growth medium with 50 ng/mL steroid hormones at 2 different days. The reproducibility was 2.6% and 16.5% for cortisol and corticosterone, respectively (Table 1).
Data Processing and Statistical Analysis
The sample chromatograms obtained from the LC-MS/MS were inspected and verified. All results were expressed as means ± standard deviations (SDs). To account for interplate variability, all data from each plate were normalized relative to the control. Analysis of variance (ANOVA) was conducted to test for significant differences between investigated concentrations after initial confirmatory tests for normality. Differences between control cells and exposed cells were evaluated using the Holm-Sidak method applied to relative changes in hormone production. If possible, 4 parametric log-logistic curves were fitted and the EC50 values were calculated. All statistical analyses were conducted using SigmaPlot 11.0 (Systat Software Inc, San Jose, California).
Results
Quality Control
The basal hormone production of cortisol and corticosterone from passage 5 to 16 were 9.72 ± 4.82 and 15.1 ± 6.22 ng/mL, respectively (n = 12). For these passages, the induction of forskolin and the inhibition of prochloraz were also investigated (Table 2). For cells exposed to 10.0 μmol/L forskolin, the induction was on average 5.1 ± 2.4 (SD)-fold for cortisol and 2.7 ± 0.7-fold for corticosterone. For cells exposed to 1.0 μmol/L forskolin, the induction was 2.4 ± 0.7- and 1.9 ± 0.4-fold for cortisol and corticosterone, respectively. Exposure to 1.0 μmol/L prochloraz resulted in an 11.8 ± 4.4-fold inhibition for cortisol and an 8.8 ± 8.0-fold inhibition for corticosterone. The high SD for corticosterone was due to a single outlier in passage 6, in which the corticosterone production was inhibited 29.5-fold. Without this outlier the inhibition was 6.2 ± 2.1-fold. For 0.1 μmol/L prochloraz, a 2.5 ± 0.7-fold and a 1.7 ±0.6 fold-inhibition were observed for cortisol and corticosterone, respectively.
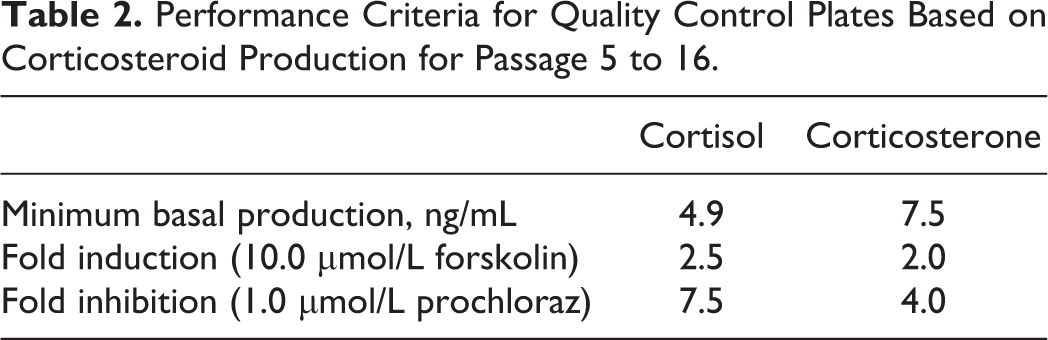
Performance Criteria for Quality Control Plates Based on Corticosteroid Production for Passage 5 to 16.
Investigating Endocrine Disruption in H295R Cells Using the SPE LC-MS/MS Method
A dose-dependent inhibition of cortisol and corticosterone secretion was demonstrated during exposure to ketoconazole (Figure 2). For treatment with 0.001 to 0.1 μmol/L ketoconazole, the secretion of cortisol and corticosterone corresponded to 100% of the control level. For increased ketoconazole concentrations, the cortisol and corticosterone secretion decreased in a log-logistic dose-dependent manner to approximately 35% and 60%, respectively, at 0.3 μmol/L ketoconazole. The corresponding EC50 values for cortisol and corticosterone were 0.24 (± 0.02) and 0.40 (± 0.11) μmol/L (P < .05), respectively.
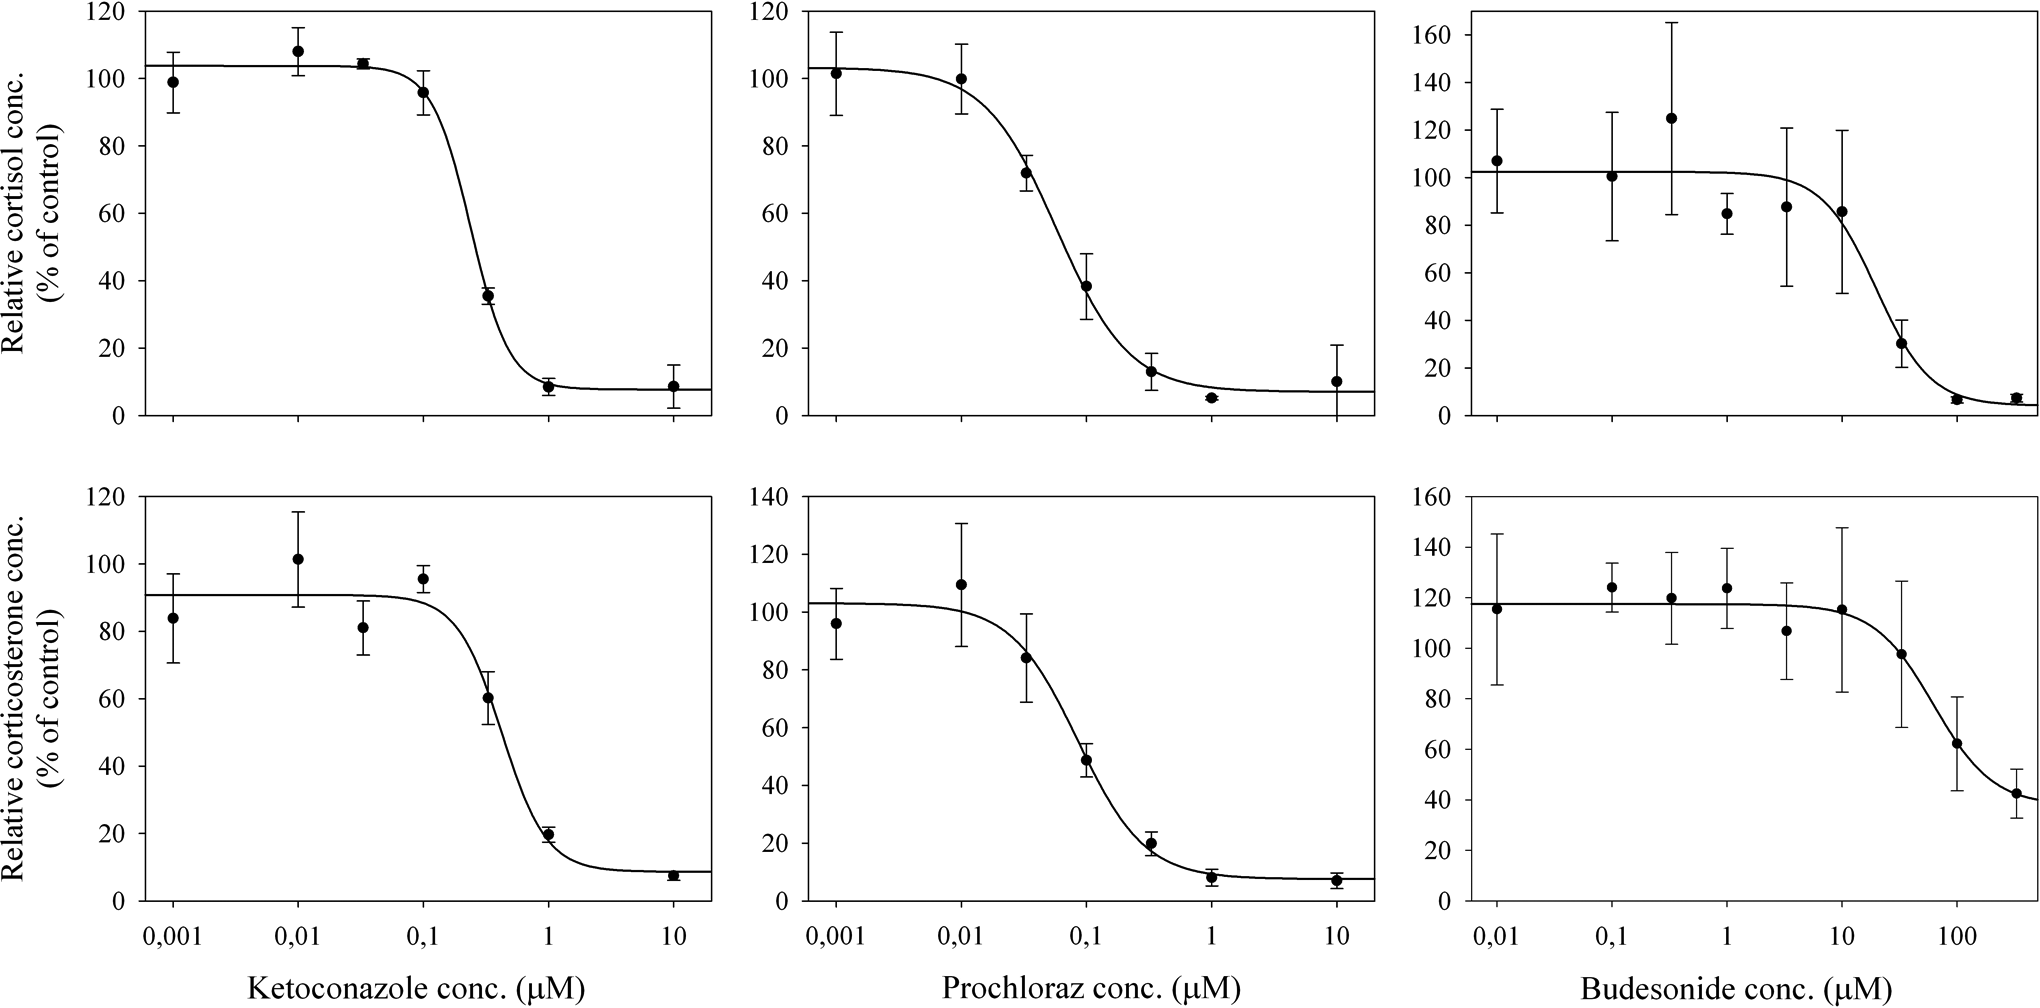
Effects of ketoconazole, prochloraz, and budesonide exposure on steroidogenic hormone production (y-axis) in H295R cells. Cells were treated for 48 hours with the indicated concentrations of ketoconazole, prochloraz, and budesonide (x-axis). Hormone data are given as relative changes compared to solvent controls (defined as 100%). The EC50 values for ketoconazole, prochloraz, and budesonide were 0.24 (± 0.02), 0.06 (± 0.01), and 19.5 (± 6.82) μmol/L for cortisol, respectively, and 0.40 (± 0.11), 0.09 (± 0.02), and 71.4 (± 28.4) μmol/L for corticosterone, respectively. Values represent mean ± standard deviation (n = 6).
For prochloraz exposure, a dose-dependent inhibition was also demonstrated for the secretion of cortisol and corticosterone. Exposure to 0.001 μmol/L prochloraz corresponded to a secretion of cortisol and corticosterone in 100% of the control level, whereas increased prochloraz concentration reduced the secretion of cortisol and corticosterone to approximately 38% and 49%, respectively, at 0.1 μmol/L. The EC50 values for cortisol and corticosterone were 0.06 (± 0.01) and 0.09 (± 0.02) μmol/L (P < .05), respectively.
Compared to ketoconazole and prochloraz, much higher budesonide concentrations were needed to inhibit cortisol and corticosterone production (Figure 2). Exposure up to 10 μmol/L budesonide did not result in cortisol and corticosterone productions significantly different from that of the control level (100%). Cortisol secretion was reduced to approximately 30% of the control level following a 33.0 μmol/L budesonide treatment. The secretion of corticosterone was reduced to 62% at 100.0 μmol/L budesonide. The corresponding EC50 values for cortisol and corticosterone were calculated as 19.5 (± 6.82) and 71.4 (± 28.4) μmol/L (P < .05), respectively (Table 3).
Basal Hormone Production (ng/mL ± SD; n = 12) for Passage 5 to 16 and the Corresponding EC50 Values (µmol/L) in Media From H295R Cells Exposed to Ketoconazole, Prochloraz, Budesonide, and Forskolin for 48 hours.
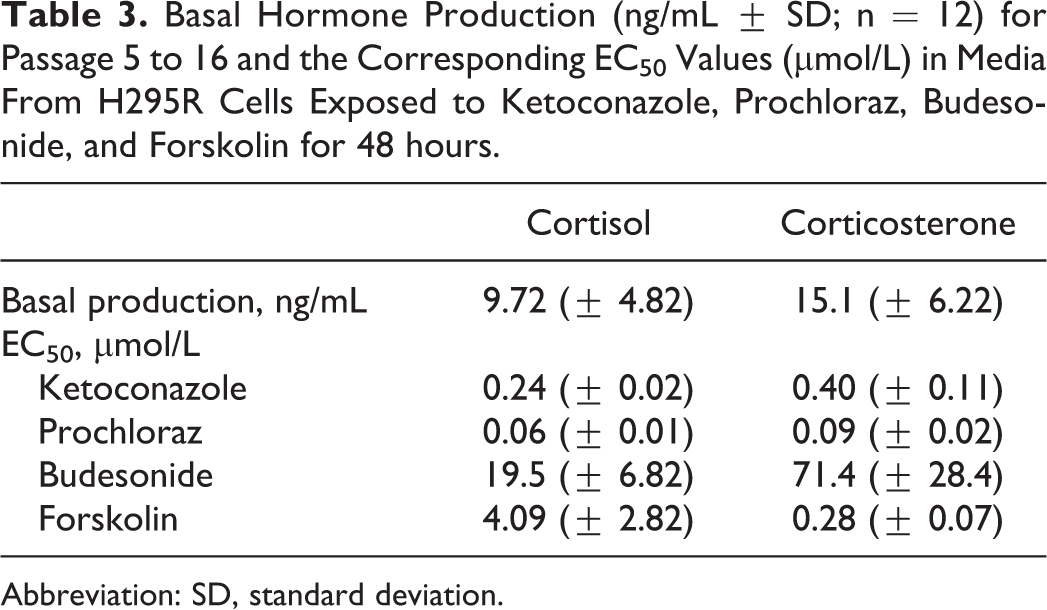
Abbreviation: SD, standard deviation.
Forskolin stimulated the secretion of cortisol and corticosterone in a dose-dependent manner. For the concentration range of 0.001 to 0.1 μmol/L, the secretion of cortisol and corticosterone corresponded to 100% of the control level; but for forskolin concentrations above 0.1 μmol/L, the cortisol and corticosterone secretion increased. Cortisol secretion was increased to approximately 275% of the control level following a 10 μmol/L forskolin treatment. The secretion of corticosterone was increased to 300% at 1.0 to 10.0 μmol/L forskolin. The EC50 values for the cortisol and corticosterone inductions were 4.09 (± 2.82) μmol/L (P < .05) and 0.28 (± 0.07) μmol/L (P < .05), respectively (Table 3). The induction of cortisol and corticosterone by forskolin is shown in supplementary Figure 2.
Discussion
Using ELISA, Ullerås et al 4 showed a strong inhibitory effect of ketoconazole on cortisol secretion at 10 μmol/L in H295R. Also using ELISA, Ohlsson et al 17 found that ketoconazole inhibited cortisol secretion in H295R cells with an EC50 value of 0.15 μmol/L. In the present experiments, the cortisol and corticosterone production decreased during ketoconazole exposure with EC50 values of 0.24 and 0.40 μmol/L, respectively. These values are in accordance with the values mentioned above and demonstrate that the presently developed cleanup and chromatographic method may be a useful alternative to the ELISA method.
To the best of our knowledge, no completely validated LC-MS/MS method for the analysis of cortisol and corticosterone has yet been published. Three other studies have used LC-MS/MS to determine corticosteroids in the H295R assay, and 2 of those have also reported basal steroid production from their studies.18–20 Using a 24-hour testing period, Liu et al 18 observed a basal concentration of 4.93 ± 0.20 (standard error of the mean) and 21.33 ± 0.53 ng/mL for cortisol and corticosterone, respectively. Liu et al 18 provided no information on detection limits and recoveries, and QC experiments with forskolin and/or prochloraz was not reported, but results were similar to that presented here (cortisol: 9.72 ± 4.82 ng/mL; corticosterone: 15.1 ± 6.22 ng/mL). Cheng and Li 19 also used LC-MS/MS to quantify cortisol in H295R during flavonoid exposure, but no information on the basal hormone production was reported during their 24-hour testing period, and no information on quality criteria was provided.
Most recently, Schloms et al 20 developed a ultra performance LC-MS/MS for the determination of 21 steroids in H295R medium. Schloms et al 20 used forskolin as QC and reported a 7.2- and a 9.1-fold induction for cortisol and corticosterone, respectively. These results are somewhat higher than the inductions reported for forskolin in the present study. Furthermore, Schloms et al 20 observed very high basal production levels of cortisol (209 ± 14 ng/mL) and corticosterone (84.8 ± 6.8 ng/mL) after a 48-hour testing period as recommended by the OECD guideline. In general, these 4 experiments demonstrate some variation in the methods and quality criteria implemented when studying glucocorticoids in the H295R cell line. Developing quality criteria for studying glucocorticoids in the H295R cell line may allow better direct comparisons between the results obtained in these experiments.
Ketoconazole inhibits CYP11A1, which is the rate-limiting step in steroidogenesis.21,22 In the present study, the inhibition of this step probably affected the downstream pathways in steroidogenesis and decreased the amount of substrate available for further synthesis, thereby decreasing the production of cortisol and corticosterone. In H295R, Nielsen et al 7 found a decreased production of pregnenolone by ketoconazole with an EC50 value of 1.51 μmol/L, and Johansson et al 23 found inhibition of the enzyme CYP11B1 by ketoconazole with an IC50 value of 2.5 μmol/L. Thus, the decrease in the production of cortisol and corticosterone is likely due to both an inhibition of the first step in steroidogenesis and an inhibition of the last enzyme in the synthesis of cortisol and corticosterone.
When studying the effects of endocrine disruptors, it is important to take the level of human exposure into account. According to the drug information for 200 mg Nizoral tablets, 24 an average plasma ketoconazole peak concentration of 6.6 μmol/L is reached within 1 to 2 hours after a single dose. Yuen and Peh 25 found plasma peak concentration of 5 to 13 μmol/L ketoconazole, 2 hours after administration of 200 mg ketoconazole. These levels exceeded the reported EC50 values of 0.24 to 0.40 μmol/L found in the present in vitro study by more than a factor of 10. This indicates that ketoconazole may have endocrine disrupting effects at therapeutic doses. However, ketoconazole is known to exhibit strong plasma protein binding (approximately 99%), but whether or not this protein binding affects ketoconazole activity and decreases its endocrine disrupting potential is not clear, and contradicting results have been obtained. 26 In general, extrapolations from in vitro models to in vivo systems should be made with caution, since in vitro systems will not adequately reflect important processes found in intact individuals such as absorption, distribution, metabolism, and elimination. 27
In a previous study, the inhibition of CYP17A1 and CYP21A2 by prochloraz resulted in a decrease in cortisol and corticosterone secretion and accumulation of progesterone. Cortisol was inhibited by prochloraz with the EC50 value 0.13 μmol/L. 28 Also, Ohlsson et al 28 found no inhibition of CYP11B1 and CYP11B2. Using gas chromatography MS, Nielsen et al 7 found an increase in the concentration of pregnenolone and progesterone when H295R cells were exposed to prochloraz with an EC50 value of 0.21 μmol/L for progesterone. In the present study, prochloraz decreased the concentration of cortisol and corticosterone with the EC50 values of 0.06 and 0.09 μmol/L, respectively, values very similar to those reported previously. Consequently, the results obtained for prochloraz also confirm the reliability of the developed method. The decrease in the production of cortisol and corticosterone was probably due to an inhibition earlier in steroidogenesis, probably CYP17A1 and CYP21A2, resulting in a downregulation of cortisol and corticosterone secretion.
Screening studies have shown that prochloraz elicits multiple mechanisms of action in vitro, as it antagonizes the androgen receptor as well as the estrogen receptor, agonizes the aryl hydrocarbon receptor, and inhibits the aromatase.29–32 The ability of prochloraz to act via more than 1 mechanism may enhance biological effects in intact organisms, due to interactions with several pathways. 32 No data on human exposure to prochloraz are available, but an in vivo Hershberger study on male rats demonstrated decreased weight of reproductive organs, reduced expression of androgen-regulated genes, and elevated serum luteinizing hormone levels. 31 These studies and the rather low EC50 values found for prochloraz in the present study clearly indicate the potential of prochloraz to impact human health.
In general, the present data correlate with previous data for the model compounds ketoconazole and prochloraz. Furthermore, the basal production of cortisol and corticosterone in the H295R cells were found to be 9.72 (± 4.82) and 15.1 (± 6.22) ng/mL, respectively. This is in accordance with previous reported basal hormone production levels in H295R cells in the range, 4.9 (± 0.2) to 13.7 (± 2.7) ng/mL for cortisol and 19.4 (± 1.7) to 21.3 (± 0.5) ng/mL for corticosterone28,33. Thus, this new method can be used as an alternative to immunoassays without the risk of cross-reactivity. It should be noted that analyzing steroid levels with either RIA or chromatographic techniques only provide information on changes in hormone concentration but not on the mechanisms responsible for this change. Combining these methods with other techniques such as quantitative polymerase chain reaction is highly needed and would also provide information on genes and enzymes involved in steroidogenesis. This approach would assist in understanding the mechanism by which endocrine disruptors affect steroidogenesis.
Presently, the OECD guideline only provides performance criteria for the analysis of testosterone and 17β-estradiol. The performance criterion for induction of testosterone with forskolin is ≥1.5 times the SC, whereas the criterion for prochloraz is ≤0.5 times SC. For 17β-estradiol, induction with forskolin should be ≥7.5 times SC and inhibition with prochloraz should be ≤0.5 times SC. Neither testosterone nor 17β-estradiol was analyzed in the present study, and therefore these quality criteria cannot be implemented. Since the H295R cell line is evidently very useful for studying hormones other than testosterone and 17β-estradiol, quality criteria should be suggested for other hormones produced by this cell line. Based on the glucocorticoids production for passage 5 to 16 in the present study, QC criteria for the minimum induction and inhibition of these steroids may be suggested. Exposing H295R cells to 10.0 μmol/L forskolin should give an induction of 2.5-fold and 2.0-fold for cortisol and corticosterone, respectively. Exposure to 1.0 μmol/L prochloraz should result in at least a 7.5-fold and a 4.0-fold inhibition for cortisol and corticosterone, respectively (Table 3). These quality criteria values correspond to the average corticosteroid production minus the SD for passage 5 to 16.
Budesonide was found to significantly inhibit the production of cortisol and corticosterone but at much higher concentrations than that observed for ketoconazole and prochloraz. There is presently no literature describing the inhibition of specific steroidogenesis enzymes by budesonide. Consequently, the results obtained on budesonide in the present study cannot be compared with results from other quantification methods. Inhibition of the production of cortisol by budesonide could result from the inhibition of 1 or more of the enzymes CYP11A1, CYP17A1, 3β-HSD, CYP21A2, or CYP11B1, or it could be due to other mechanisms. Suppression of plasma cortisol is an established and sensitive marker for the systemic effects of glucocorticoids suppression on the hypothalamo–pituitary–adrenal axis (HPA axis). 34 Exogenous glucocorticoids suppress cortisol production by feedback mechanisms that act on the HPA axis in a manner similar to that of the endogenous glucocorticoids. 35 An increased systemic concentration of budesonide may therefore cause suppression of pituitary adrenocorticotropic hormone production leading to adrenal insufficiency, and additionally the steroidogenesis may be suppressed. 36
In a meta-analysis including 27 studies of adrenal suppression performed during 1966 to 1998, it was concluded that inhalation of steroid analogs (triamcinolone, fluticasone, budesonide, or beclomethasone) corresponding to 1500 μg/d result in a marked adrenal suppression. 37 Edsbäcker and Andersson 38 showed both plasma and urinary cortisol suppression after oral administration of 3000 to 15 000 μg budesonide per day. The suppression was dose dependent, with cortisol suppression increasing with increasing dosage. The present study showed a significantly lower production of cortisol compared to control at concentrations >10 μmol/L budesonide. According to the product information for Pulmicort Turbohaler, 9 the maximum plasma concentration of 0.004 μmol/L was reached 30 minutes after inhalation of 800 μg budesonide. This plasma level is more than 2000 times lower than the effect levels found in the present in vitro study (EC50 values of 19.5-71.4 μmol/L). Nevertheless, Carlsen and Gerritsen 37 and Edsbäcker and Andersson 38 showed cortisol suppression in humans at therapeutic doses, indicating that budesonide may have several targets in vivo, which may be more sensitive than effects on the H295R steroidogenesis. Considering the excessive use of budesonide in asthmatic treatment and the possibility that budesonide may exert endocrine disrupting effects at therapeutic doses, this issue should be further studied. There may be a need for screening all used glucocorticoid analogs.
Presently, ELISA and RIA are more sensitive than most chromatographic methods available. Nevertheless, ELISA and RIA can only measure 1 hormone at the time and may be influenced by cross-reactivity, whereas chromatographic techniques allows for the simultaneous detection of several steroids in the pathway without any cross-reactivity. 39 The very low detection limits in future chromatographic techniques may therefore be suitable alternatives to RIA and ELISA as the most widely used methods for quantifying steroids. Since these chromatographic techniques allow a suite of hormones to be analyzed in single samples, quality criteria for hormones other than 17β-estradiol and testosterone must be developed.
Footnotes
Acknowledgments
The authors wish to acknowledge Lisbeth Stenør at the University of Copenhagen for her excellent help with the development of the analytical method as well as the scholar stipend for the first author from the Research school of environmental chemistry, microbiology and toxicology (RECETO).
Declaration of Conflicting Interests
The author(s) declared no potential conflicts of interest with respect to the research, authorship, and/or publication of this article.
Funding
The author(s) received no financial support for the research, authorship, and/or publication of this article.
References
Supplementary Material
Please find the following supplemental material available below.
For Open Access articles published under a Creative Commons License, all supplemental material carries the same license as the article it is associated with.
For non-Open Access articles published, all supplemental material carries a non-exclusive license, and permission requests for re-use of supplemental material or any part of supplemental material shall be sent directly to the copyright owner as specified in the copyright notice associated with the article.