
Abstract
The Armed Forces are developing new explosives that are less susceptible to unintentional detonation (insensitive munitions [IMX]). 2,4-Dinitroanisole (DNAN) is a component of IMX. Toxicokinetic data for DNAN are required to support interpretation of toxicology studies and refinement of dose estimates for human risk assessment. Male Sprague-Dawley rats were dosed by gavage (5, 20, or 80 mg DNAN/kg), and blood and tissue samples were analyzed to determine the levels of DNAN and its metabolite 2,4-dinitrophenol (DNP). These data and data from the literature were used to develop preliminary physiologically based pharmacokinetic (PBPK) models. The model simulations indicated saturable metabolism of DNAN in rats at higher tested doses. The PBPK model was extrapolated to estimate the toxicokinetics of DNAN and DNP in humans, allowing the estimation of human-equivalent no-effect levels of DNAN exposure from no-observed adverse effect levels determined in laboratory animals, which may guide the selection of exposure limits for DNAN.
Keywords
Introduction
2,4-Dinitroanisole (DNAN, CAS no. 119-27-7) is a component of a new class of explosives under development by the Armed Forces that are less susceptible to unintentional detonation (insensitive munitions [IMX]). Components of these new IMX formulations have a potential for migration from soil to surface and ground water sources during environmental releases when incomplete or unexploded detonations occur. 1 It is important that environmental and toxicological impacts of new munitions be assessed in a proactive manner to minimize risks to military personnel, the community, and the environment.
Effects on multiple organ systems have been observed in male and female Sprague-Dawley rats exposed subchronically to DNAN (tested doses of 0, 1.25, 5, 20, or 80 mg/kg/d, 7 days/wk for 90 days via gavage in corn oil). 2 Males in the 80 mg/kg/d group exhibited reduced body mass gain, decreased mass of the testes, degeneration and atrophy of testicular seminiferous tubules, and decreased mass and aspermia of the epididymides. Neurotoxicity of DNAN was also observed in both males and females receiving the highest dose (gait irregularities and cerebellar glial lesions). A preliminary analysis indicates that the most sensitive effects may have occurred in the spleens of female rats (eg, splenic enlargement and extramedullary hematopoiesis; E. M. Lent, Ph.D., personal communication, April 2015). From this study, a benchmark dose (95% lower confidence limit on the dose producing a 10% increase in incidence, BMDL10) of 2.3 mg/kg/d was derived based on extramedullary hematopoiesis in females and reported in Lent et al. 2
Toxicokinetic data (eg, blood and tissue concentrations measured at various times after dosing) for DNAN are required to extend the understanding of how DNAN is distributed, metabolized, and eliminated in rats and provide insight into the possible fate of these components in exposed humans. Limited toxicokinetic data for DNAN have been reported in the literature. Both rats and rhesus macaques are capable of metabolizing DNAN to 2,4-dinitrophenol (DNP), resulting in high internal doses of DNP. 3 The DNP has been promoted as a weight loss agent but has serious side effects, including greatly elevated body temperatures (as high as 43°C) and 62 human fatalities between 1918 and 2010 have been identified. 4 Assuming an adult body weight of ∼70 kg, a typical acute human lethal dose of DNP of ∼40 mg/kg can be estimated from these reports, but the lowest published lethal dose is 4.3 mg/kg. 4 These lethal human doses of DNP are less (∼5- to 50-fold less) than the median acute lethal dose of DNAN determined for rats (200 mg/kg). 2 The DNP is among the chemicals tested in high-throughput screening assays as part of the US Environmental Protection Agency (EPA) Toxicity Forecaster (ToxCast) program, 5 which consists largely of in vitro tests conducted using human-derived cells or cell lines. The DNP was tested at 15 concentrations ranging from 1.18 nmol/L to 92.2 µmol/L and found to be active for 14 of the 685 assay end points. The lowest effective concentration producing a 50% effect (EC50) values for DNP was for mitochondrial toxicity to cultured human HepG2 (hepatocellular carcinoma) cells, “Mitochondrial Toxicity—ratio (mitochondrial membrane potential)” and “Mitochondrial Toxicity—viability (adenosine triphosphate content),” at 0.831 and 4.27 µmol/L, respectively (0.16 and 0.79 mg/L). Because of the accompanying decrease in viability, DNP was considered to be an “inconclusive antagonist (cytotoxic)” of mitochondrial function. 6 The DNP is therefore a critical consideration in the development of a toxicokinetic model, as the toxicity of DNAN may be related to its metabolism to DNP.
In the current study, male Sprague-Dawley rats were exposed to DNAN by gavage and blood and tissue samples were collected from 0.5 to 24 hours postdosing. Blood and tissue samples were analyzed to determine the levels of DNAN and DNP. These data and data from a previous study of DNAN in rats and rhesus macaques 3 were used for calibration and validation of a preliminary physiologically based pharmacokinetic (PBPK) model. The rat and macaque PBPK model for DNAN was extrapolated to estimate the toxicokinetics of DNAN and DNP in humans, allowing the estimation of human-equivalent no-effect levels of DNAN exposure from no-observed adverse effect levels (NOAELs) determined in laboratory animals. The DNAN toxicokinetics work described here is part of a larger effort focused on providing a strong toxicology data package from which to develop more certain toxicity criteria for IMX components. 1 These data will assist in sustaining range operations (readiness), reduce potential for cleanup operations, and aid in the selection of environmental and occupational exposure limits.
Materials and Methods
In Vivo Studies
Study design
The Organisation for Economic Cooperation and Development recommends the use of a pilot study of a single oral dose to aid the selection of experimental parameters for toxicokinetic studies. 7 The pilot study used 3 male rats per time point with sampling at 0.5, 1, 2, 8, and 24 hours after gavage dosing at 20 mg/kg. Blood was collected at all sampling times so that basic toxicokinetic parameters could be addressed. Tissue collection in the pilot study was conducted at t = 2 hours and t = 8 hours only to test whether or not achieved tissue–blood concentration ratios were time dependent. These 2 points in time were selected to allow adequate chemical distribution and equilibration while allowing adequate detection levels before significant clearance occurs in blood and tissue samples. The dose used in the pilot study, 20 mg/kg, was chosen because it was the desired middle dose for the definitive study, pending verification of dose ranges in which DNAN and/or DNP detection was anticipated. Blood and tissue samples were collected, stored, and analyzed for content of parent compound (DNAN) and a known important metabolite, DNP, as described subsequently (“Sample collection and storage” and “Sample analysis”).
The definitive oral kinetics study used male rats, 3 (gavage) dose levels, and blood and tissue samples were collected at 7 or 8 time points (n = 4/time point). Based on the results of the pilot study, blood sampling times expected to adequately characterize the blood time course of DNAN and DNP were selected. Ideally, points along the time course would include at least 1 sample prior to the achievement of peak concentrations of parent compound (so that absorption rate may be determined), a sample near the time of peak concentration, and sufficient samples after the peak to characterize the clearance phase(s). Doses (5, 20, and 80 mg/kg) and vehicle (corn oil) were chosen for consistency with the 90-day subchronic study. 2 These doses were well below the median lethal acute oral dose of 200 mg/kg DNAN for rats. 2 Collection times were 0.5, 1, 2, 4, 8, 10, and 12 hours postdosing for the 5 mg/kg group (28 rats); 0.5, 1, 2, 4, 8, 12, and 18 hours for the 20 mg/kg group (28 rats); and 0.5, 1, 2, 4, 8, 12, 18, and 24 hours postdosing for the 80 mg/kg group (32 rats). Blood and tissue samples were collected, stored, and analyzed for DNAN and DNP in the same manner as in the pilot study.
Animals
All experiments involving animals were conducted in accordance with the Institute of Laboratory Animal Resources Guide for the Care and Use of Laboratory Animals and were approved by the Wright-Patterson Air Force Base Institutional Animal Care and Use Committee. Male Sprague-Dawley (Rattus norvegicus) rats (Crl: CD(SD) BR rats), 7 to 9 weeks old, were purchased from Charles River Laboratories (Raleigh, North Carolina). Upon arrival, the animals were segregated for a quarantine and acclimation period of 14 days. Animal rooms were maintained within a temperature range of 68 to 79°F and relative humidity of 30% to 70%, in accordance with the recommendations of the National Research Council’s Guide for the Care and Use of Laboratory Animals, 8 with approximately 15 complete air changes per hour, and a 12–12-hour electronically controlled light–dark cycle. The rats were individually housed in polycarbonate rodent cages with cell-sorb bedding and had access to rodent chow and water ad libitum. All animals were observed twice daily by vivarium personnel for any signs of pain, distress, or any other abnormalities.
Animals were exposed between 9 and 10 weeks of age. Exposures were conducted on 3 separate days over an 8-day period. Animals were separated into dose groups by weight to adjust for weight gain over the 8-day period.
Test article and dosing
The DNAN was supplied by BAE Systems (Batch number 11097) and manufactured by Ordnance Systems, Inc (Kingsport, Tennessee); purity was 99.0% or greater (Matt Hathaway, BAE Systems, personal communication to Matt Roberts, NAMRU-D). Meijer brand 100% pure corn oil with no additives was bought locally. Dosing solutions were prepared 1 day prior to exposure. The DNAN was weighed using an analytical balance and transferred to a ceramic mortar. Approximately 5 mL of corn oil was added and the DNAN was finely ground. It was then quantitatively transferred to a 50-mL volumetric flask and the mortar and pestle rinsed more than 5 times with corn oil to ensure all DNAN was off of the mortar and pestle. The solution was brought to volume and transferred to a 100-mL jar with a stir bar. An additional 25 mL of corn oil was measured using a volumetric flask and used to rinse the 50 mL volumetric flask and added to the 100 mL jar (total final volume 75 mL). The jar was capped and put on a stir plate where it stirred overnight and throughout the dose administration.
Doses were delivered in a volume of 10 mL/kg using an 18 to 20 gauge, 3-in long stainless steel gavage needle to unfasted animals. Postgavage, all rats were returned to their cages with food and water ad libitum to await anesthesia, blood and tissue collection, and euthanasia.
Sample collection and storage
Rats were anesthetized by inhalation exposure to 70% CO2 until they were no longer responsive to toe pinch. The abdomen of the anesthetized rat was opened with scissors, the diaphragm was cut (bilateral pneumothorax), the intestines moved to 1 side, and blood was drawn from the caudal vena cava or heart using a 5 or 10 mL syringe with a 21 to 23 gauge, 1/2 to 1-in needle. All needles and syringes were treated with heparin as an anticoagulant. Following blood draw, the rat was rapidly decapitated with a rat guillotine. Following rapid decapitation, the liver, the kidneys, and samples of perirenal adipose tissue were harvested sequentially (in the order listed), blood removed from the organs with a Kimwipe (if present), frozen in liquid nitrogen between 30 minutes and 8 hours, and stored in a −80°C freezer until analysis.
Sample analysis
The DNAN and DNP in extracts (prepared as described subsequently) from individual animals’ blood and tissue samples were analyzed by splitless injection on an Agilent (Santa Clara, California) 6890 gas chromatograph (GC) with dual electron capture detectors using a modification of US EPA method 8095. 9 The quantitation column was the RTX-TNT 6 m, 0.53 mm ID, and 1 µm df (Restek Corp, Bellefonte, Pennsylvania, 12998) and the confirmation column was the RTX-TNT2 6 m, 0.53 mm ID, and 1.5 µm df (Restek Corp, 12999). Each sample was confirmed simultaneously using a deactivated guard column and split to both columns using a universal “Y” siltek press-tight connector (Restek Corp). The injector temperature was 250°C with a pressure of 6.83 psi using helium as the carrier gas and a detector temperature of 330°C. The initial oven temperature was 80°C with a ramp of 4°/minute to 110°C, 1°/minute to 120°C, 4°/minute to 127°C, 2°/minute to 157°C, and 5.5°/minute to 250°C with a total run time of 51.16 minutes.
Calibration
Naive rat target organs and blood (same sex and strain as the toxicokinetic studies) were collected and stored according to the same methods as the toxicokinetic studies. Tissues and blood were thawed at room temperature and divided to appropriate weight or volume when necessary. Each tissue was injected with known concentrations of DNAN, DNP (Restek Corp), and hexahydro-1,3,5-trinitro-1,3,5-triazine (RDX; Restek Corp) to calibrate the instrument and account for matrix interference caused by the tissue. The quantitation column calibration had a minimum of 5 points with ≤20% relative standard deviation or R 2 ≥0.98. The instrument calibration was verified after no more than 20 samples by reinjecting a mid-point continuing calibration verification (CCV) standard in accordance with EPA methods. 9 Target analytes had to have less than 15% deviation from the true value for the instrument to still be considered in calibration. The surrogate spike (RDX) was the last analyte to elute and was subject to peak broadening and tailing at the end of each batch; therefore, 30% deviation was considered passing for the post-CCV. Any samples that were over the range of the calibration were diluted and reanalyzed.
Blood analysis
Whole blood was thawed at room temperature and 1 mL of blood was taken and added to a 20-mL borosilicate glass scintillation vial with a foil lined screw top cap (Fisher Scientific, Pittsburgh, Pennsylvania). A known amount of RDX was added to the blood to serve as an extraction surrogate spike. Deionized water (3 mL) was added to each vial and mixed. Blood from a naive rat was also spiked with RDX to serve as a method blank (MB). Isoamyl acetate (IAA, greater than or equal to 99% pure; Fisher Scientific) of 1 mL was added to each scintillation vial and tightly capped. The scintillation vials were put on their sides on an orbital plate shaker for 60 minutes at approximately 700 rpm. The entire portion was transferred to a borosilicate glass test tube and centrifuged at 1200g for 10 minutes. The IAA layer was removed and put into 2 mL GC vials with a crimp cap (Restek Corp) and analyzed via the instrument conditions mentioned previously. The calibration range for all compounds in blood was 0.5 to 10 µg/mL. A method detection limit (MDL) study was run using 99% confidence of a 1-sided t test with 7 low-level spiked samples to determine the lowest detectible limit. The MDLs were determined to be 0.101 µg/mL for DNAN and 0.662 µg/mL for DNP.
Tissue analysis
Extraction and analysis of DNAN and DNP in tissue were conducted in a manner similar to the approach described previously for blood; sample sizes and resulting MDLs are summarized in Table 1. Tissue from each animal (eg, a single kidney per rat, left lateral lobe, or another portion of the liver) was thawed at room temperature, weighed, and injected with a known amount of RDX to serve as the surrogate spike. The rest of the liver was repacked and frozen in anticipation of some samples needing to be reextracted due to instrument problems caused by the matrix interference. Many liver samples needed to be reextracted for this reason. The portion of the liver used for reextraction was of similar size to the left lateral lobe. The tissues were finely minced and chopped in a plastic weigh boat with a razor blade until no pieces with a dimension greater than 1 mm could be discerned within the sample. The resulting paste like (kidney) to gelatinous (adipose) homogenate was then transferred into a borosilicate glass scintillation vial with a foil-lined screw top cap. The weigh boats were rinsed with 2 to 4 mL of deionized water, which was added to the scintillation vial. Tissue from naive rats was also spiked with a known amount of RDX to serve as the MB. The IAA (2 mL for liver and 1 mL for other tissues) was added to each scintillation vial and tightly capped. The shaking and centrifugation of the vials containing tissue extracts were conducted in the same manner as described previously for blood extraction.
Extraction and Analysis of DNAN and DNP in Rat Blood and Tissue Samples.
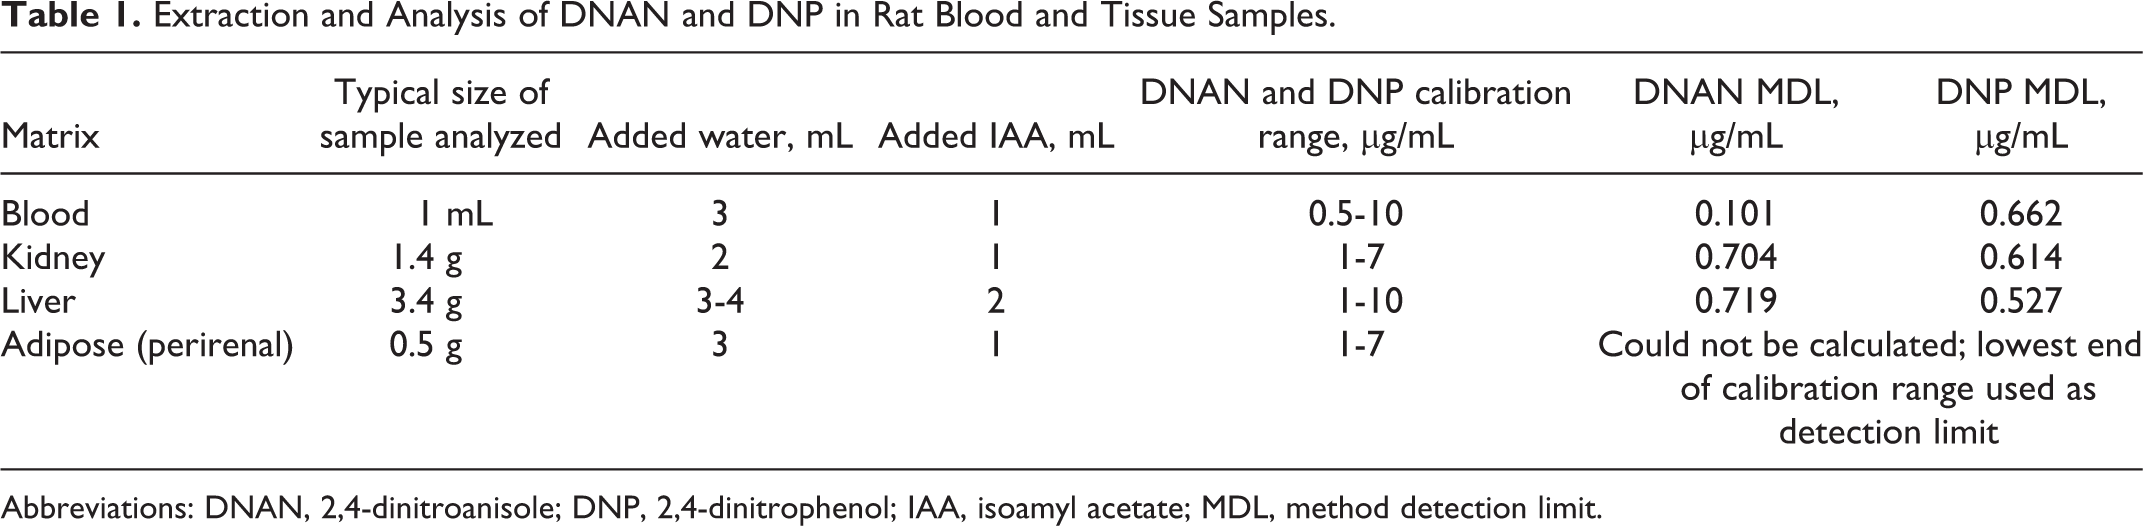
Abbreviations: DNAN, 2,4-dinitroanisole; DNP, 2,4-dinitrophenol; IAA, isoamyl acetate; MDL, method detection limit.
A storage blank of liver from an untreated rat and a known amount of DNAN was prepared shortly after the definitive toxicokinetics study and analyzed along with those samples. Due to substantial loss of DNAN from the storage blank, the in vivo liver data were deemed unsuitable for quantitative use in toxicokinetic modeling.
The MDLs were not calculated for adipose because of matrix issues. The bottom point of the calibration curve was used as the lowest detection limit.
Nondetects
For kinetic analyses, samples below the detection limit were assumed to be present at a concentration equal 10 to the MDL/√;2 if the analyte was detected in other samples at the same dose and time postgavage.
In vitro partition coefficient determination
In vitro partition coefficients were determined for adipose, kidney, muscle, and liver using naive tissue using an adaptation of the method described by Jepson et al 11 for compounds with low volatility. Tissues were thawed at room temperature, weighed (∼0.5 g tissue per vial), and finely minced using a razor blade to increase the surface area for absorption. The tissue was then placed in a borosilicate glass scintillation vial with a foil-lined screw top cap. A volume of 2 mL of 10 or 15 µg/mL DNAN solution was added to each vial immediately prior to being placed into a shaking incubator. An MB was prepared using naive tissue in a phosphate-buffered saline solution and a laboratory control sample (LCS) was prepared using no tissue and the 10 or 15 µg/mL DNAN solution. All samples including the MB and LCS were incubated in an upright position at a temperature of 37°C and agitated at 150 rpm for time points of 0.5, 1, 2, 4, 6, 8, 10, 12, 18, and 24 hours (n = 3 per time point). Following each time point, vials were removed from the incubator and 1 mL of DNAN solution was transferred to a second scintillation vial with 3 mL of deionized water and known amount of RDX as a surrogate spike. The IAA of 1 mL was added to each vial. Vials were then placed on their sides and taped to an orbital plate shaker and agitated for 60 minutes at approximately 700 rpm. The liquid contents of the scintillation vials were decanted into borosilicate glass test tubes and centrifuged for 2 minutes causing a separation of the IAA layer from the remainder of the sample. The IAA layer was pipetted into 2 mL GC test vials with a crimp cap and analyzed via the instrument conditions noted previously.
For each series, the concentrations of DNAN remaining in the saline solution were plotted against the incubation time in Microsoft Excel and compared to an exponential trend line, since first-order losses (via metabolism or other loses) were expected. After inspection of the figure (on a logarithmic scale), a range of points that appeared to be well-described by an exponential relationship were identified. Potential reasons for lack of linearity at short or long duration might be diffusion limitation (short duration) or depletion of cofactors (long duration). The data in the selected range (typically from 2 to 6 hours after the start of incubation) were used to estimate a hypothetical initial concentration in saline (CSal0) presumed to be in thermodynamic equilibrium with the minced tissue. Based on these assumptions and mass balance, the tissue–saline partition coefficient was calculated.
In silico partition coefficient predictions
Tissue–water, plasma–water, and erythrocyte–water partition coefficients were estimated using algorithms developed by Poulin and coworkers. 12 –14 The algorithms were based on tissue composition (water, phospholipid, and neutral lipid content) and the octanol–water partition coefficient (KOW). The algorithms and tissue composition information are provided in Appendix A. An experimental value of 1.61 for log KOW for DNAN was determined by Boddu et al 15 ; the reported log KOW for DNP was within 4% of the experimental value for DNAN (1.67), 16 so the available experimental KOW value for DNAN was also used for DNP. Blood–water partition coefficients were estimated from hematocrit, plasma–water partition coefficient, and erythrocyte–water partition coefficients. Tissue–blood partition coefficients were estimated as the ratio of the tissue–water and blood–water partition coefficients.
Pharmacokinetic Model Development
Software and implementation
Modeling was conducted in acslX (AEgis Technologies, Huntsville, AL, v. 3.0.2.1). Differential equations were integrated using Gear’s algorithm for stiff equations. Optimization was done using the Nelder-Mead method by means of the built-in parameter estimation subroutines, with the heteroscedasticity fixed at 2 (ie, error in the measured data was assumed to be proportional to the response variable). The optimization criterion was the maximizing of the log likelihood function.
Model structure and parameter values
The preliminary model structure and rat and human anatomical parameter values were taken from the models developed for the structurally related, nitrogen-rich compound RDX 17 –19 and the literature. 20 A model compartment for the testes was added due to concerns regarding potential reproductive/endocrine effects of IMX components 1 and the desire to use a common model structure for PBPK models for both DNAN and 3-nitro-1,2,4-triazol-5-one. The model structure is depicted in Figure 1. The DNP clearance was assumed to occur in the liver, based on identification of several DNP metabolites (eg, 2-amino, 4-nitrophenol, DNP sulfate, and glucuronides) in the bile of an overdose victim. 21 Anatomical and physiological parameters for the rhesus macaque were derived from the literature (Table 2). Initial values for tissue–blood partition coefficients were estimated in silico as described previously. Because the observed loss of DNAN from liver samples in storage blanks (as noted previously under “Tissue analysis” section) precluded the use of in vivo data to optimize liver partition coefficients and the in silico and in vitro estimates of partition coefficients tended to be similar among richly perfused tissues (kidney, brain, and liver), partition coefficients for the liver and the richly perfused tissues compartment were assumed to be equal. Initial estimates of absorption and first-order metabolism rates for the rat were taken from the RDX models. Refined estimates of chemical-specific values to describe DNAN pharmacokinetics were first estimated via trial and error, and visual inspection of the agreement between model predictions and experimental data for the rat. After modification of the model structure (eg, saturable metabolism of DNAN, rather than first-order metabolism), final estimates of chemical-specific model parameters to describe disposition in the rat were derived via optimization using acslX. The stability of the optimized values was confirmed by altering the starting values of individual parameters and repeating the optimization. The optimized parameter values from the rat model were used as starting values for the monkey model. As previously described for the rat, chemical-specific parameters for the monkey PBPK model were first refined by trial and error and visual inspection, and then finalized using a formal optimization in acslX. The body weight normalized, chemical-specific parameter values estimated for the macaque were assumed to also be applicable to human disposition of DNAN, with the exception that an alternate DNAN absorption rate (the rate estimated for rats) was also used in model applications.
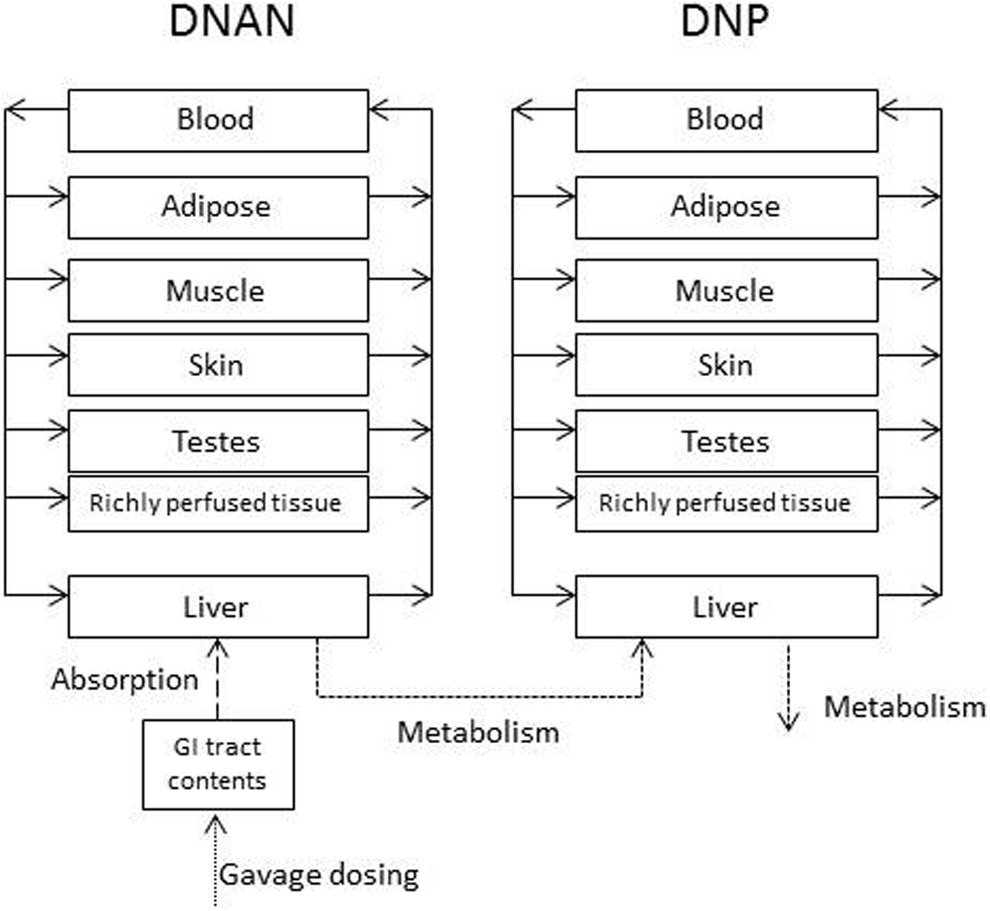
Physiologically based pharmacokinetic (PBPK) model for disposition of 2,4-dinitroanisole (DNAN) and 2,4-dinitrophenol (DNP).
Anatomical and Physiological Parameters for the DNAN PBPK Model.
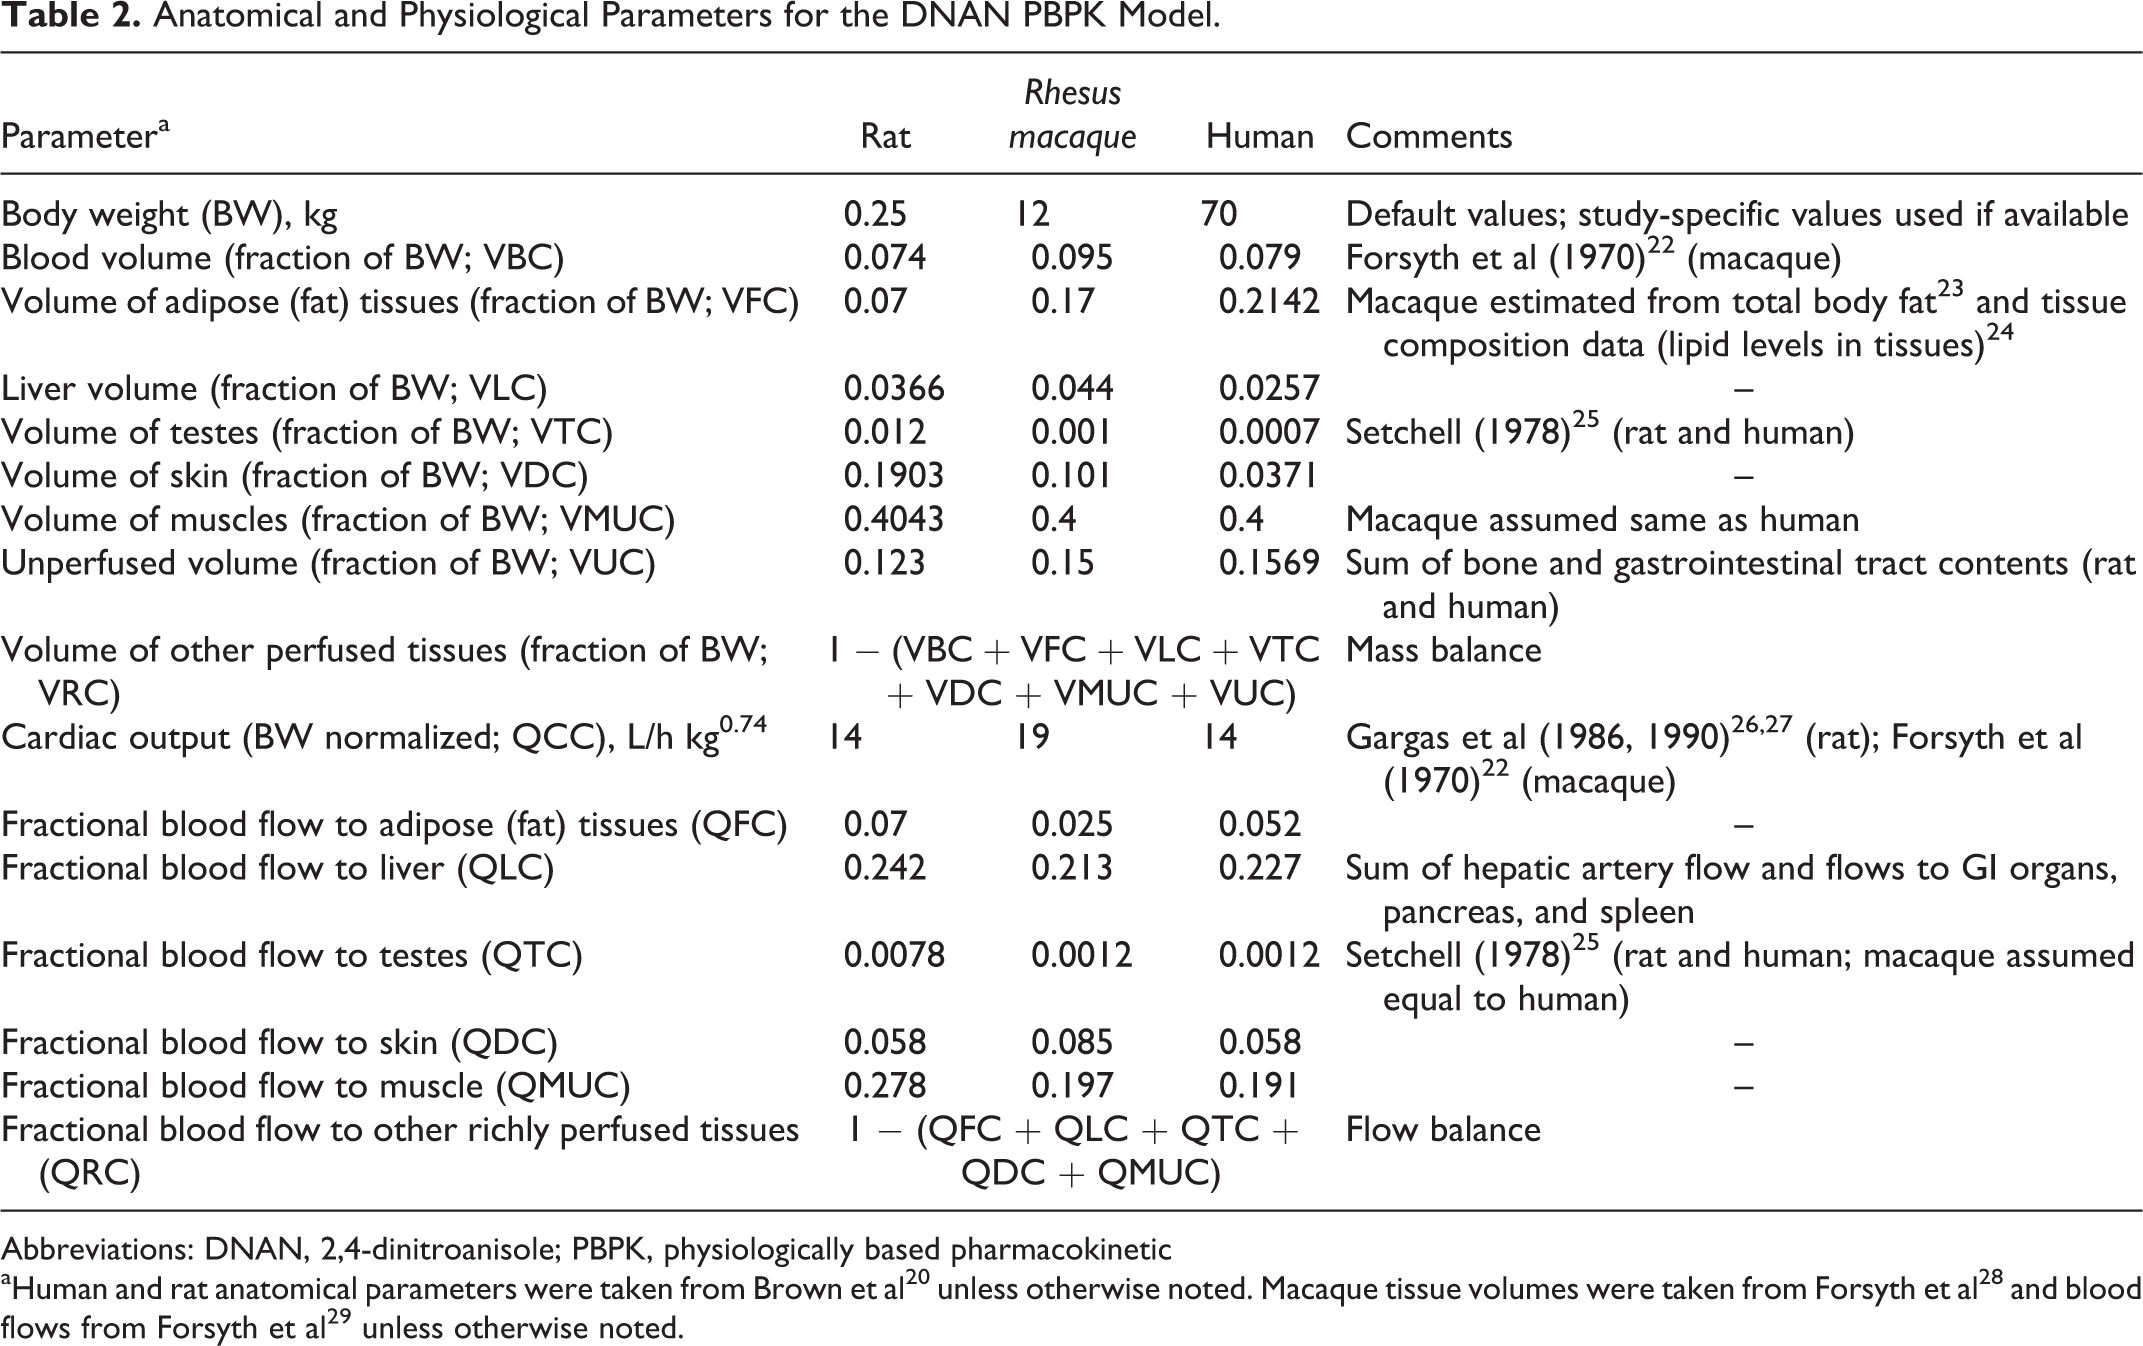
Abbreviations: DNAN, 2,4-dinitroanisole; PBPK, physiologically based pharmacokinetic
Model evaluation
The agreement between the model predictions and data was generally deemed acceptable if, on average, the difference between the model predictions and the mean of the experimental data is not more than a factor of 2. Consideration was given not only to the quantitative agreement but also to the extent to which the model captures trends (eg, dose-related behavior and timing of peak concentration) and the agreement between the model and the predictions in the dose range of greatest interest, that is, at or near the NOAEL. 30 The level of agreement was quantified via the computation of a discrepancy ratio for each individual blood/tissue concentration measurement. For each datum, the maximum of the experimental value/predicted value or predicted value/experimental value was deemed the discrepancy ratio. For a given metric (eg, blood DNAN), a cumulative discrepancy index was computed as the geometric mean of all discrepancy ratios; an index of 1 indicates perfect agreement between the model and the data.
Local sensitivity analyses, recommended by the International Programme on Chemical Safety for models being considered for use in risk assessment, 30 were implemented in acslX using the built-in routines. The central difference method was employed with a delta of 0.001, and the changes were normalized to the response and the parameter, that is, the normalized sensitivity coefficient (NSC) for a given response (eg, blood DNAN or DNP concentration) was computed as the fractional change in output (eg, change in blood concentration divided by the baseline blood concentration) divided by the fractional change in the test parameter (eg, change in dose divided by the baseline dose). The NSC values of 1 indicate a positive, linear relationship between the test parameter and the output (a 1% increase in the parameter produces a 1% increase in the response), while an NSC value of -1 likewise indicates a linear relationship, but the response decreases, rather than increases. Sensitivity analysis was applied to the time history of predicted blood DNAN and DNP concentrations after administration of doses used for model parameterization (rats: 5 or 80 mg/kg DNAN and rhesus macaque: 51 mg/kg). The time frame for these analyses was the period during which detectable levels of DNAN and DNP were observed. Sensitivity of the measured outputs (eg, blood concentration) to the optimized parameters (eg, metabolic rates) demonstrates that the unique (or limited ranges of) values of the optimized parameters are identifiable from the available experimental data. For the human model sensitivity analysis, the scenario of interest was to evaluate the impact of model parameter uncertainty or variability on the computed values of cumulative blood DNAN or DNP exposure for a long-term (90 days) ingestion exposure (12 hours continuous intake alternating with 12 hours unexposed for a total of 90 days). The daily ingestion rate was assumed to be 2 mg/kg/d, based on similarity to the BMDL for extramedullary hematopoiesis in the subchronic study 2 and possible human-equivalent doses computed with the model (see “Model Application” section).
Results
Model Calibration
The rat model was calibrated using the blood and kidney data from the “definitive” study (3 dose levels), with the kidney data assumed to be representative of the “other richly perfused tissues” compartment (Figure 1). The estimated chemical-specific parameter values are summarized in Tables 3 and 4. The comparisons of predicted and measured rat blood and kidney concentrations of DNAN and DNP for the calibration study are depicted in Figure 2. Comparisons between the rat model predictions and the calibration and validation data (pilot study and data from Hoyt et al 3 ) are presented in Figure 3 and Table 5.
Partition Coefficients.a
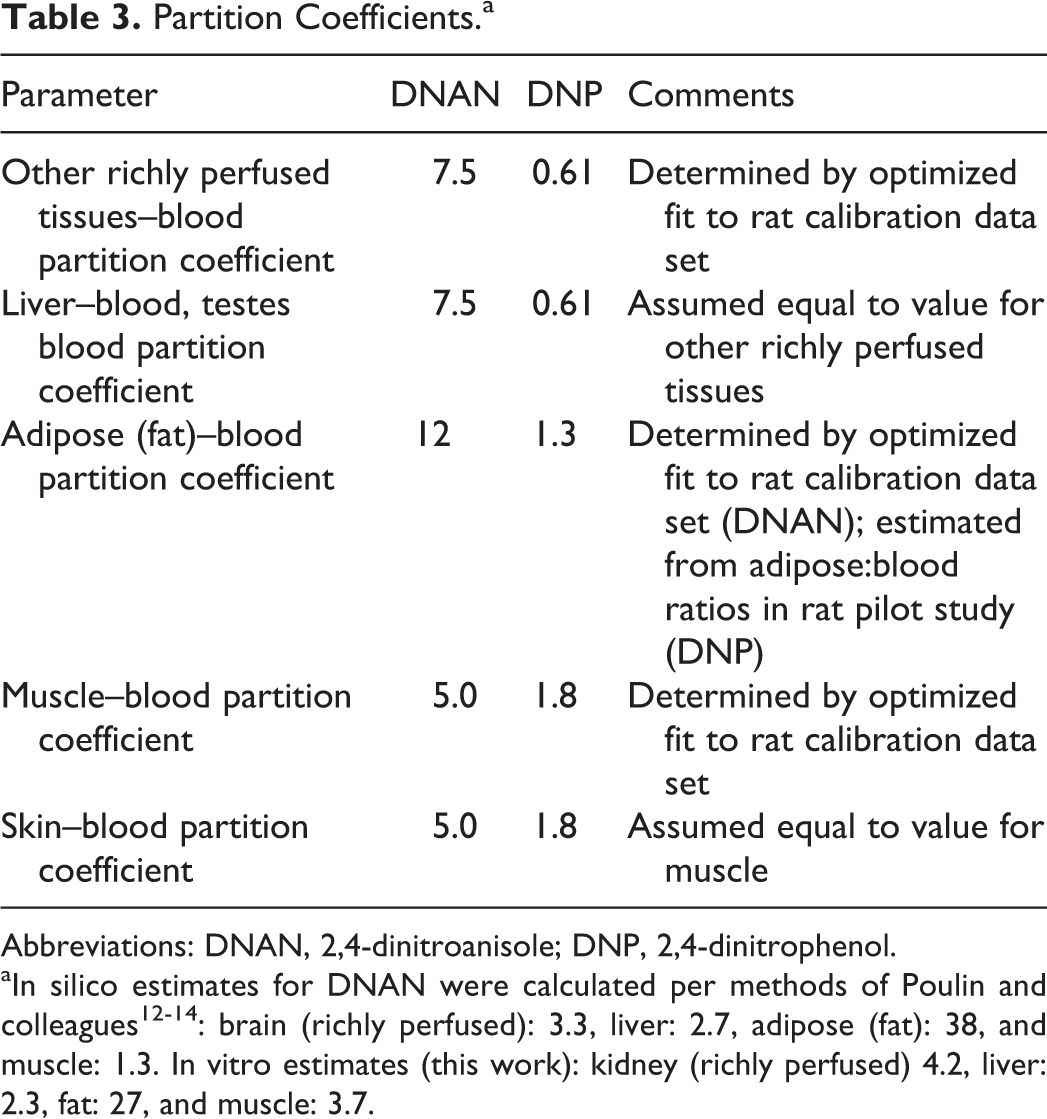
Abbreviations: DNAN, 2,4-dinitroanisole; DNP, 2,4-dinitrophenol.
Absorption and Metabolism/Elimination Parameters.
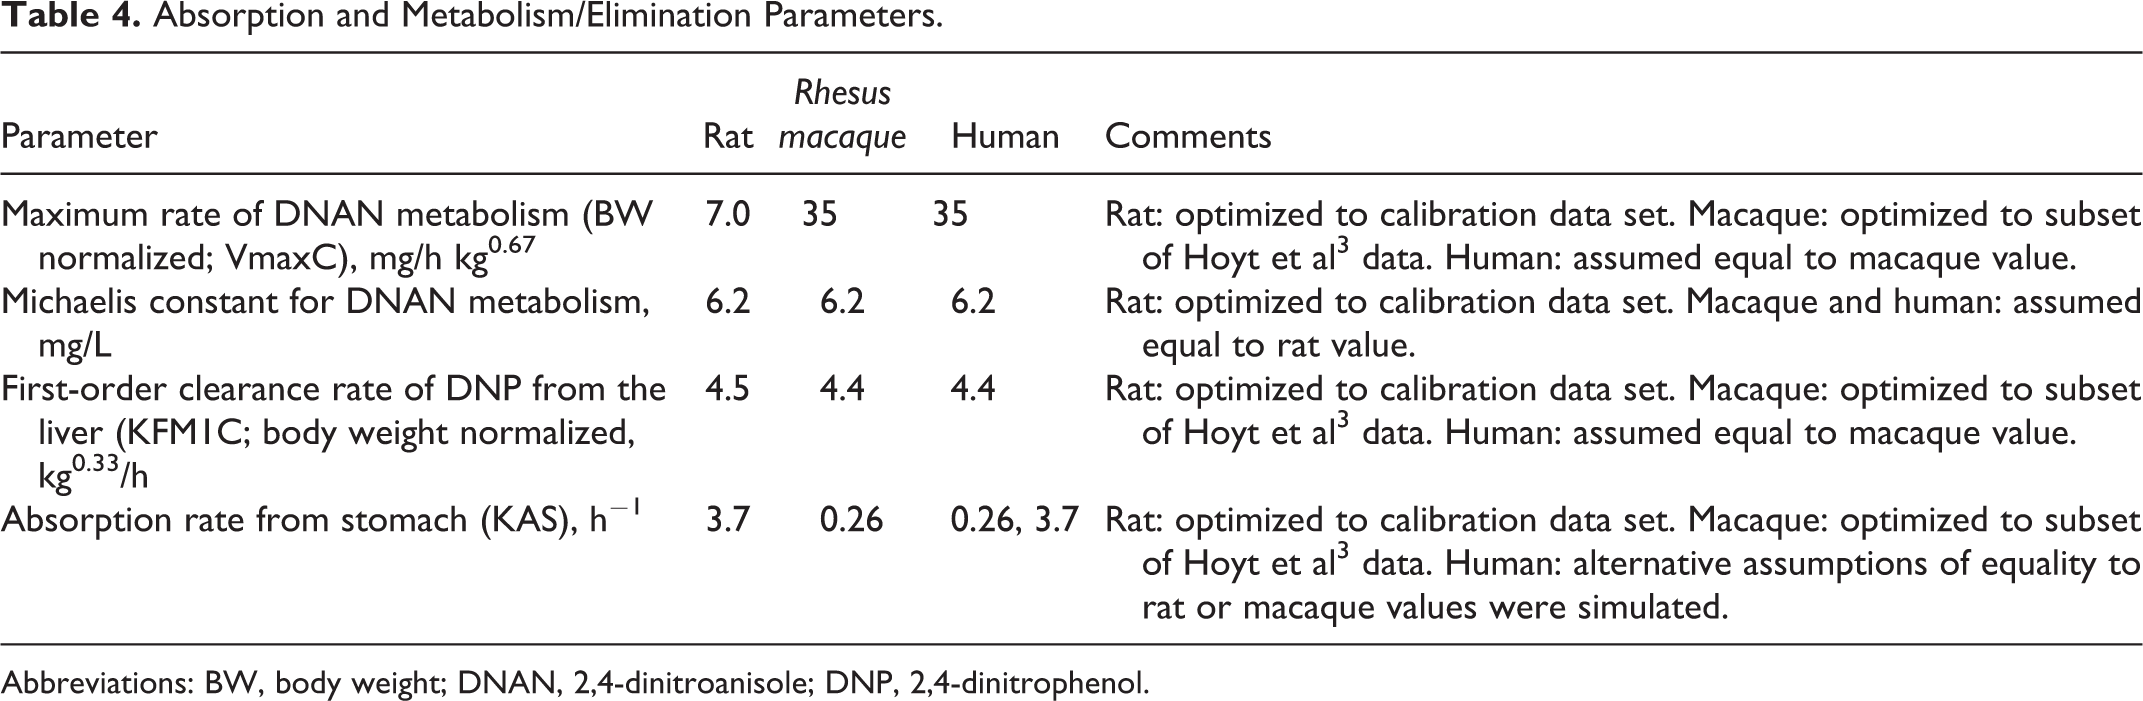
Abbreviations: BW, body weight; DNAN, 2,4-dinitroanisole; DNP, 2,4-dinitrophenol.
Rat Model Performance–Concentration Ratios of Model Predictions Versus Experimental Data.a
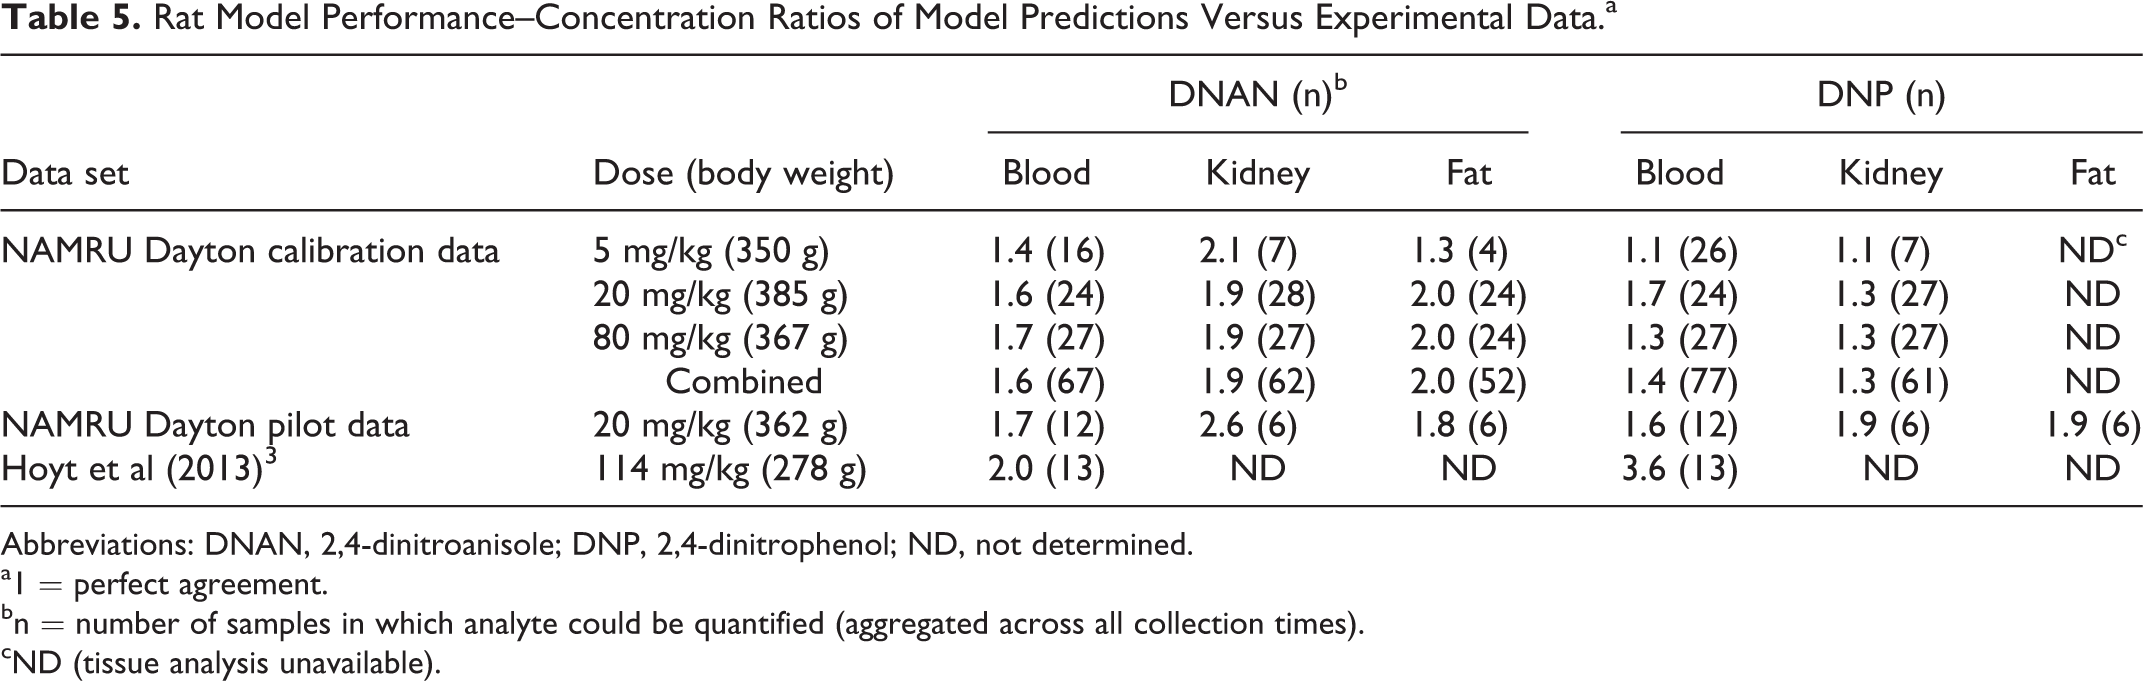
Abbreviations: DNAN, 2,4-dinitroanisole; DNP, 2,4-dinitrophenol; ND, not determined.
a1 = perfect agreement.
bn = number of samples in which analyte could be quantified (aggregated across all collection times).
cND (tissue analysis unavailable).
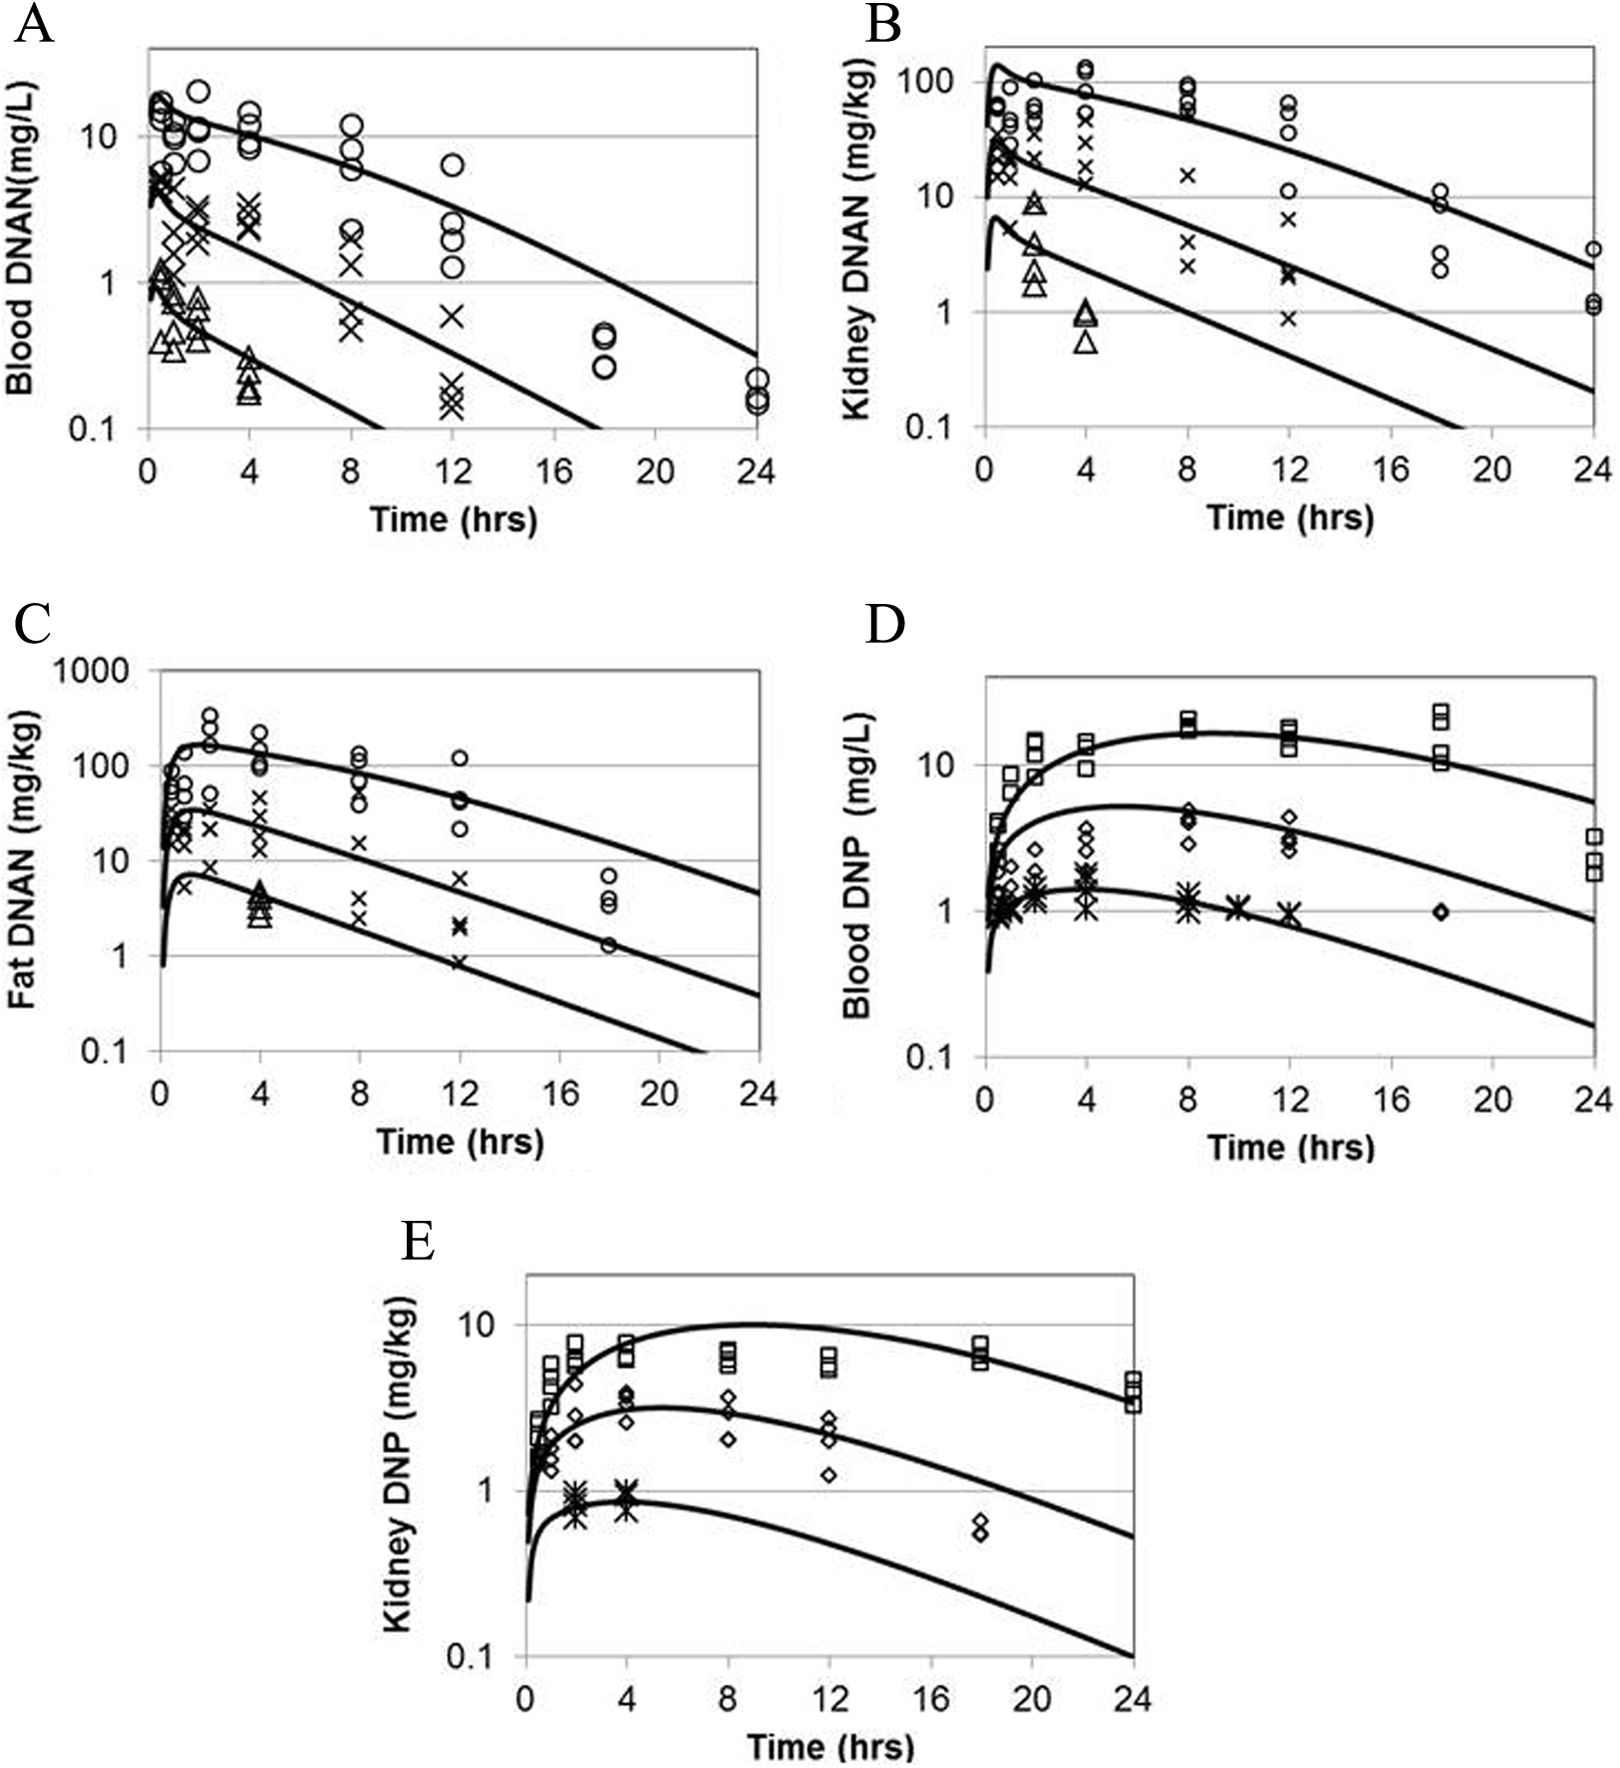
Measured and predicted blood and kidney concentrations of DNAN and DNP in male Sprague-Dawley rats dosed by gavage with 5, 20, or 80 mg/kg DNAN in corn oil (average weight 350, 385, and 367 g, respectively). Symbols: experimental data (n = 4 per time and dose). Lines: model predictions. (A) Blood DNAN, (B) kidney DNAN, (C) adipose DNAN, (D) blood DNP, and (E) kidney DNP. DNAN indicates 2,4-dinitroanisole; DNP, 2,4-dinitrophenol.
Measured and predicted blood and kidney concentrations of DNAN and DNP in male Sprague-Dawley rats dosed by gavage with 20 mg/kg DNAN in corn oil (average weight 362 g). Symbols: experimental data (n = 3 per time, x = DNAN, diamond = DNP). Lines: model predictions (solid = DNAN, dashed = DNP). (A) Blood DNAN and DNP, (B) kidney DNAN and DNP, and (C) adipose DNAN and DNP. DNAN indicates 2,4-dinitroanisole; DNP, 2,4-dinitrophenol.
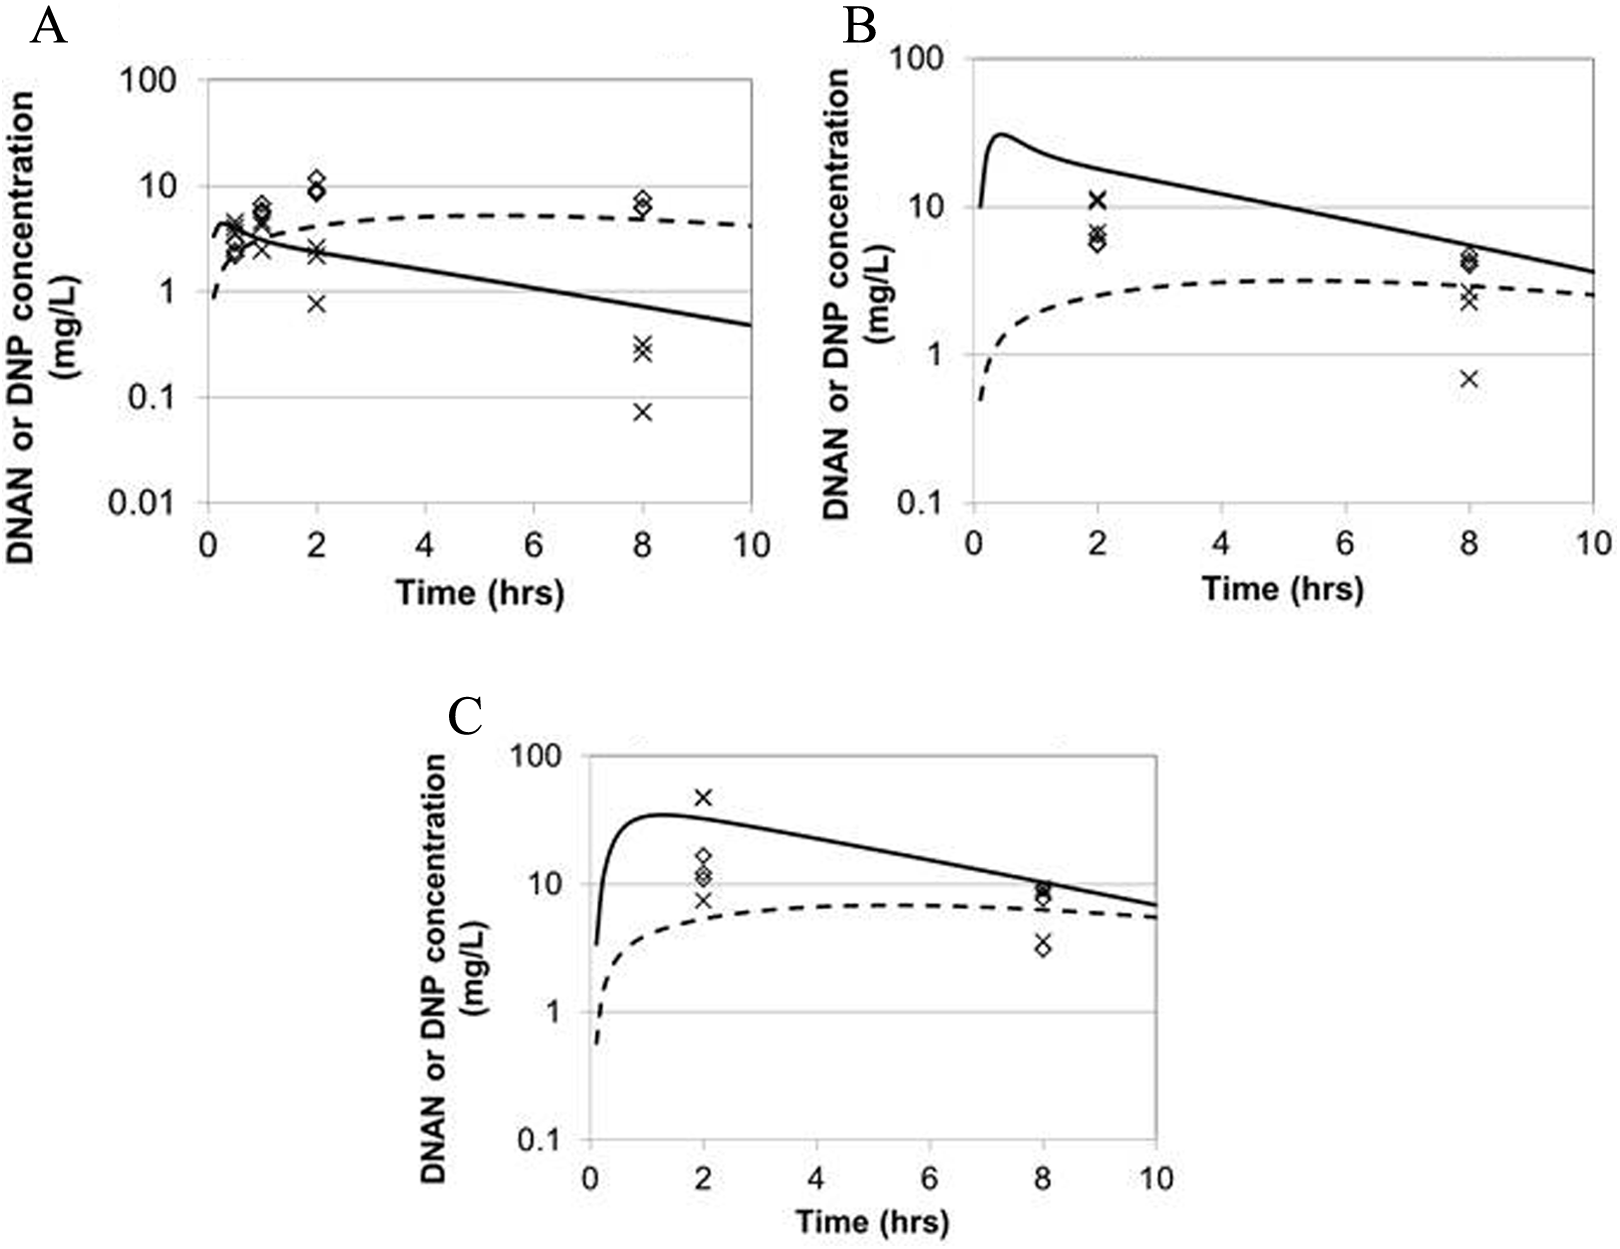
Only limited data were available for the parameterization of the PBPK model for the rhesus macaque. Since tissue–blood partition coefficients are typically very similar among species, 31 it was assumed that the optimized partition coefficients determined for the rat would be applicable to other species; likewise, the Michaelis constant for DNAN metabolism was assumed to be species invariant. 32 Of the 4 monkeys with detectable levels of DNAN and DNP in blood, one had modestly higher dose-normalized DNAN blood concentrations (∼2-fold higher) and substantially higher dose-normalized blood DNP concentrations (as much as 9-fold higher) than the other animals. Only the data from the 3 animals with similar kinetics were used for model calibration of the maximal rate of DNAN metabolism, first-order DNAN absorption rate, and first-order DNP liver clearance rate (Table 4). The agreement between the model predictions and experimental data is depicted in Figure 4 and tabulated in Table 6.
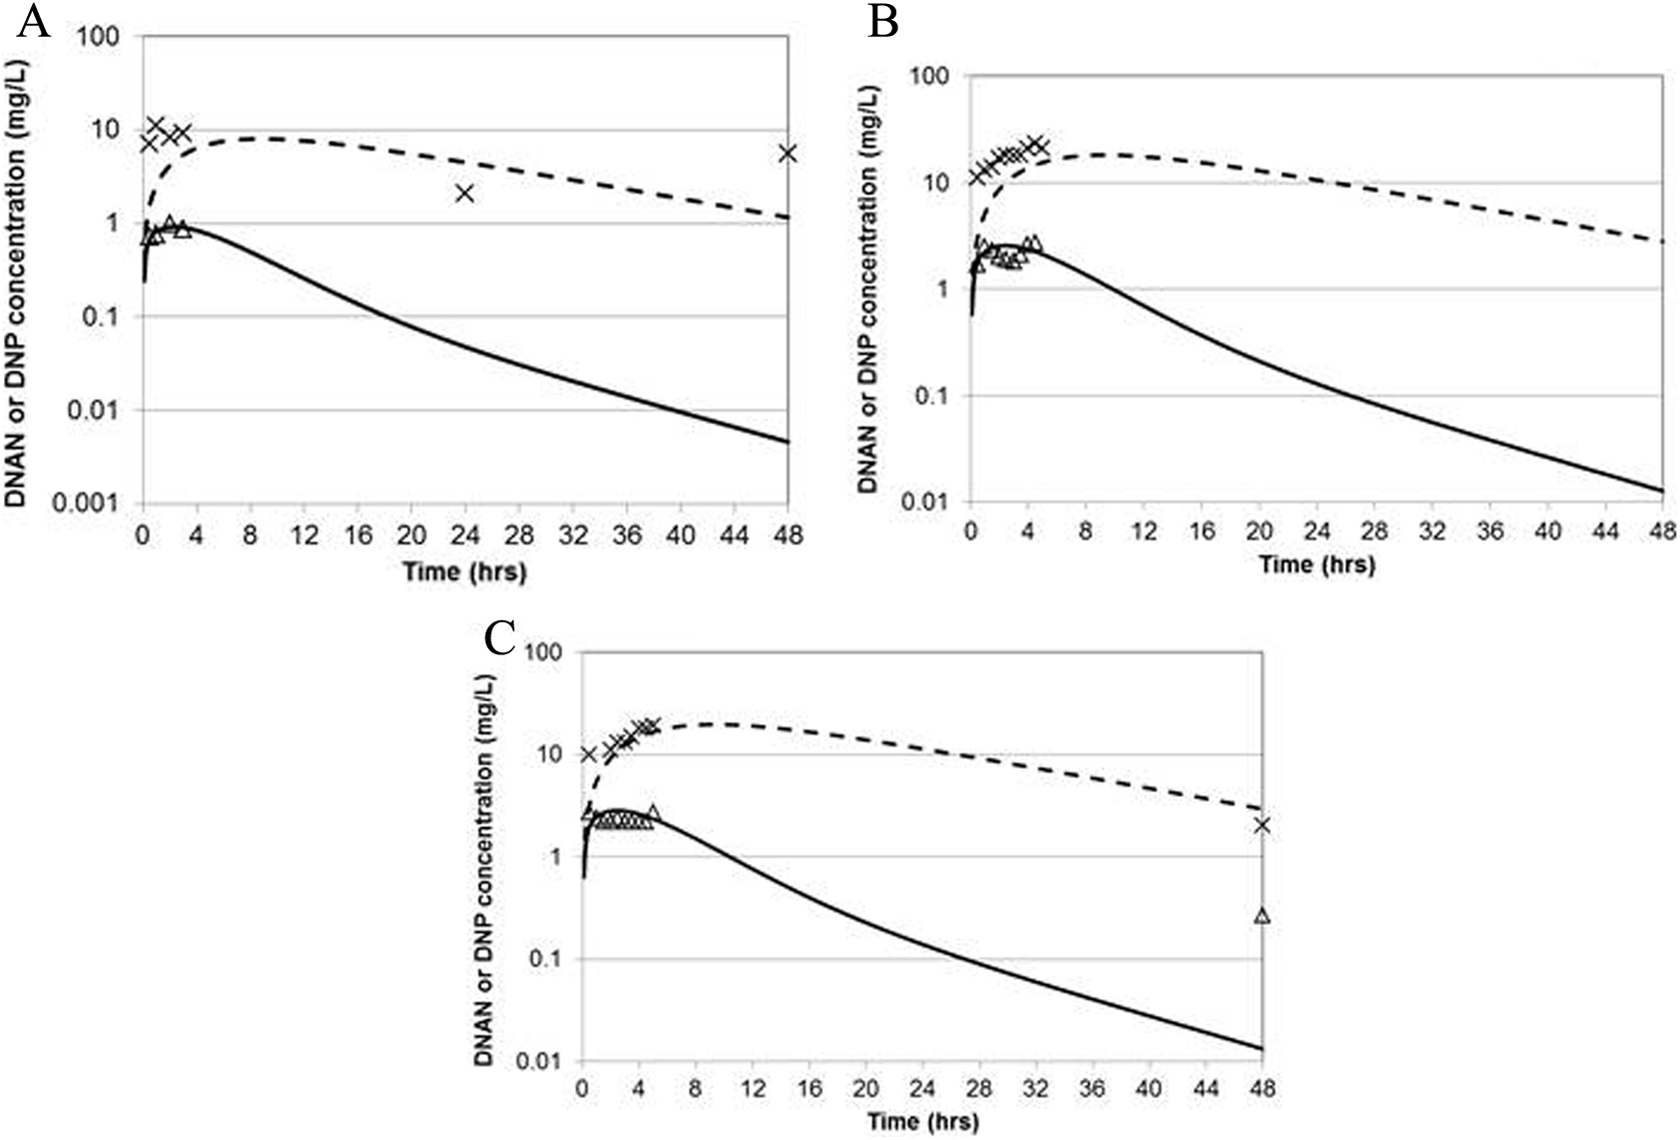
Measured 3 and predicted blood concentrations of DNAN and DNP in 3 male rhesus macaques dosed by gavage DNAN in corn oil. Symbols: experimental data. Solid line: DNAN prediction. Dashed line: DNP prediction. (A) 20 mg/kg (12.7 kg), (B) 47 mg/kg (12.9 kg), and (C) 51 mg/kg (12.2 kg). DNAN indicates 2,4-dinitroanisole; DNP, 2,4-dinitrophenol.
Rhesus Macaque Model Performance–Concentration Ratios of Model Predictions Versus Experimental Data. 3,a
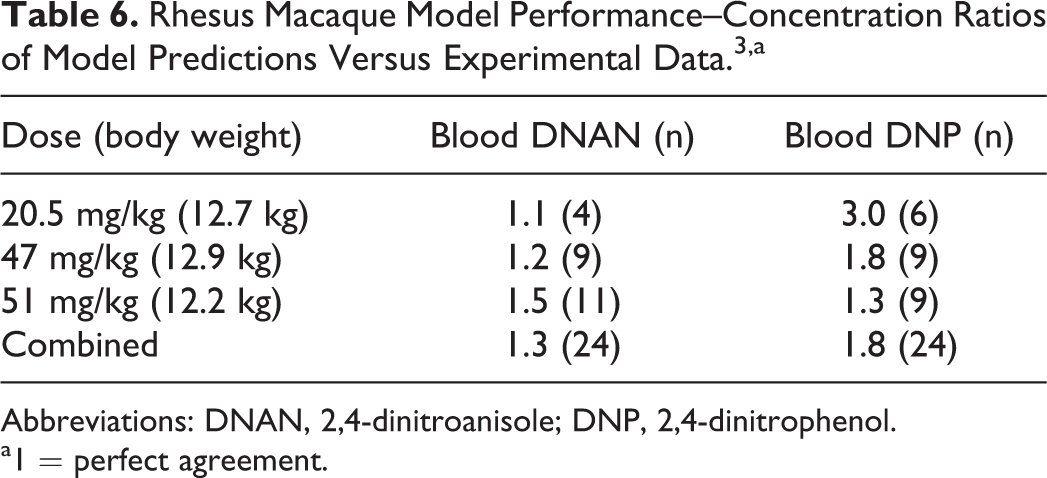
Abbreviations: DNAN, 2,4-dinitroanisole; DNP, 2,4-dinitrophenol.
a1 = perfect agreement.
Parameterization of the Human Model
Anatomical and physiological parameters for the human model were taken from the literature (Table 2). Partition coefficients and the Michaelis constant for DNAN metabolism were assumed to be equal to the optimized rat values (Table 3); as noted for the macaque model parameterization, these values tend to be similar across species, so this assumption is commonly used in PBPK modeling. 31,32 The optimal DNAN VmaxC (bodyweight normalized maximum rate of DNAN metabolism) value for the macaque was observed to be 5-fold larger than the VmaxC value for the rat (Table 4). To provide context for this primate/rat difference, rat versus human metabolic rate differences reported in the literature were investigated for the structurally similar compounds 2,6-dinitrotoluene (2,6-DNT) and RDX. Units were adjusted, as necessary, based on microsomal protein yield 33 and liver mass. 20 The computed human–rat VmaxC ratio for 2,6-DNT was 6 or 7, based on data from rat and human liver slices 34 or microsomes, 35 respectively. The computed human–rat VmaxC ratio from the optimized RDX in vivo metabolism rates (adjusted for liver volume) was 3. Given the similarity among these primate/rat metabolism ratios, the DNAN-specific metabolism rate for the macaque was assumed to be applicable to humans. Likewise, the DNP clearance rate derived from optimization of fit to the macaque data was also used for humans. Absorption rates may vary based on factors such as feeding status and vehicle. Lacking any clear rationale for identifying either the rat- or macaque-derived DNAN absorption rate as being preferable to the other, and acknowledging the variability of potential human exposure scenarios, both absorption rates were considered in applications of the human model.
Model Application
The rat model was used to estimate measures of internal dose associated with the subchronic study of DNAN. 2 Internal dose metrics that would be considered in dose-response analyses or extrapolation (eg, interspecies and route to route) include peak or cumulative (area under the curve [AUC]) blood concentrations of parent compound (DNAN) or a stable metabolite (eg, DNP). The selection of a dose metric for a particular extrapolation (eg, human equivalent dose [HED] for a particular toxic end point) would ideally be guided by mode of action information. In order to accommodate multiple potential modes of action, 4 internal dose measures were calculated for the tested doses and the BMDL for extramedullary hematopoiesis (the most sensitive effect) for female rats in the subchronic study 2 (Table 7). Each of these dose metrics demonstrates a different relationship between external and internal dose. For cumulative blood DNP, the relationship is linear, while peak DNP concentrations increase sublinearly, due to saturation of the metabolism of DNAN to DNP. Correspondingly, a 64-fold increase in external dose across this range produces a 91-fold increase in peak blood DNAN and cumulative DNAN concentrations show an even steeper increase (143-fold).
Internal Dose Estimates for the Subchronic Study of DNAN. 2 ,a
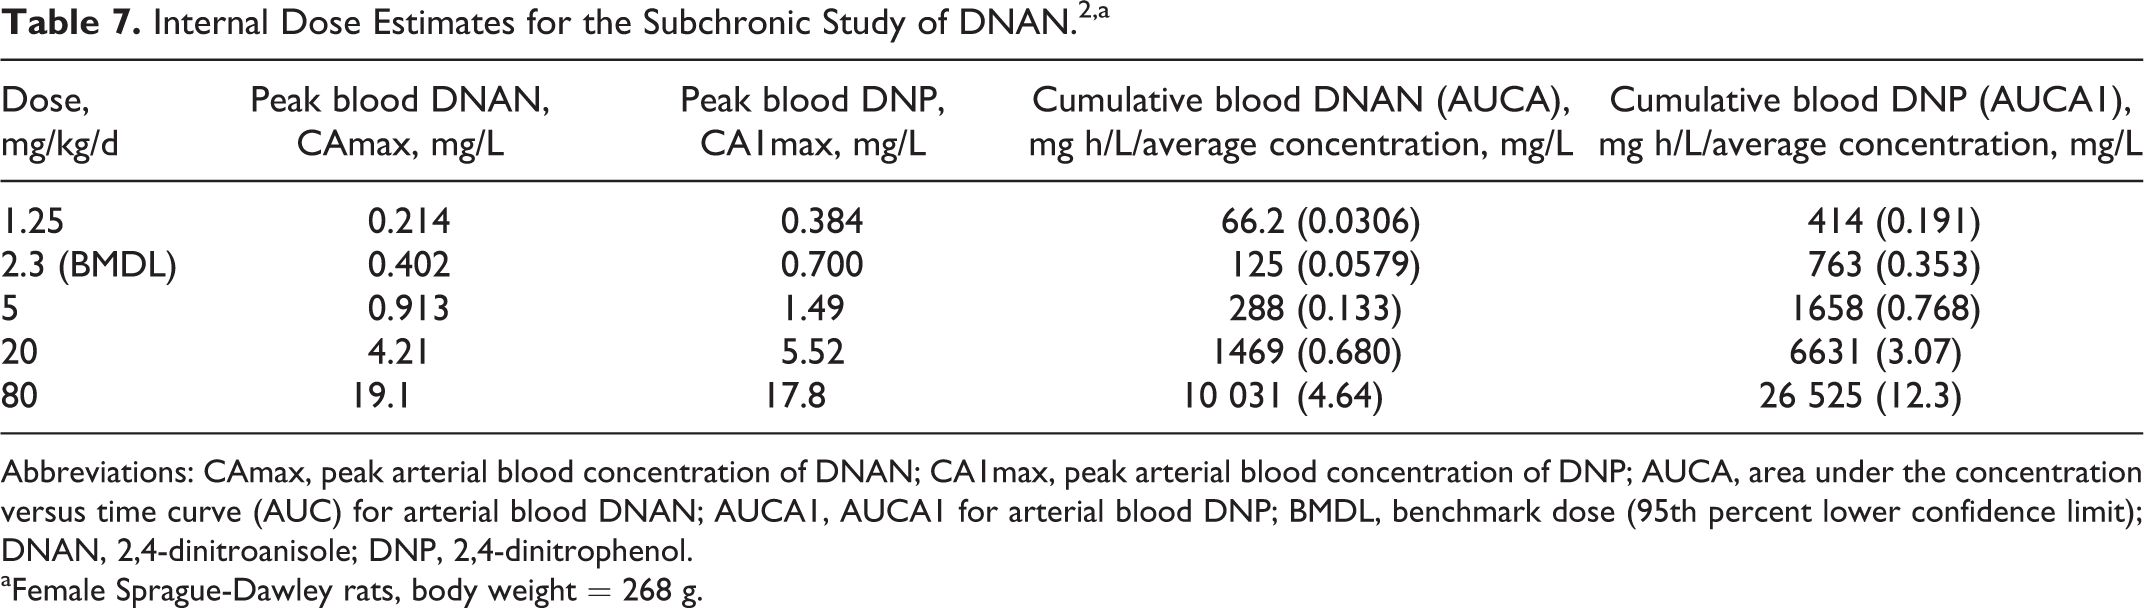
Abbreviations: CAmax, peak arterial blood concentration of DNAN; CA1max, peak arterial blood concentration of DNP; AUCA, area under the concentration versus time curve (AUC) for arterial blood DNAN; AUCA1, AUCA1 for arterial blood DNP; BMDL, benchmark dose (95th percent lower confidence limit); DNAN, 2,4-dinitroanisole; DNP, 2,4-dinitrophenol.
aFemale Sprague-Dawley rats, body weight = 268 g.
Extrapolations were made from the subchronic rat BMDL for a 10% incidence of extramedullary hematopoiesis (2.3 mg/kg/d) 2 to HEDs based on equality between rat and human model predictions of the 4 different internal dose metrics that were computed (Table 7). Because of uncertainty in human model parameterization, extrapolations were completed using 2 different estimates of the DNAN absorption rate (Table 6). Two different human exposure scenarios were considered. In the first, the daily exposure is assumed to be received as a single bolus. In the second, the intake is assumed to be continuous (at a constant rate) for 12 h/d. More realistic scenarios (eg, multiple short pulses of varying magnitude) could be constructed but would likely produce results intermediate between these 2 extremes evaluated here. Candidate HEDs are summarized in Table 8. The predicted cumulative measures were almost insensitive to the assumptions about the human rate of absorption or exposure scenario. Both peak DNAN and DNP levels were more sensitive to the estimated absorption rate if exposure was assumed to occur as a bolus rather than to occur continuously. The only internal dose metric for which there was greater than 25% variation among the estimated HEDs was the peak blood concentration of DNAN.
Estimated Human-Equivalent Doses (mg/kg/d) for a Rat Subchronic Dose of 2.3 mg/kg/d for 2 Intake Scenarios, With 2 Possible Human Gastrointestinal Absorption Rates.
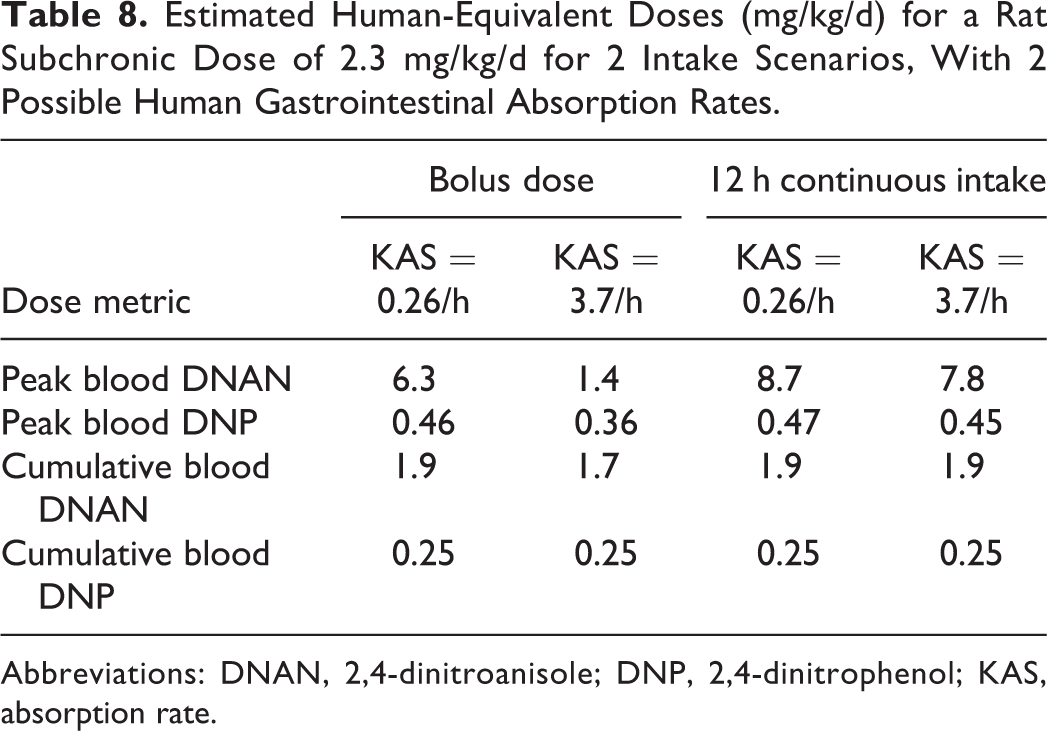
Abbreviations: DNAN, 2,4-dinitroanisole; DNP, 2,4-dinitrophenol; KAS, absorption rate.
Model Sensitivity Analysis
Local sensitivity analyses were conducted to evaluate the extent to which uncertainty in model parameters affects model predictions. In particular, sensitivity of blood concentrations in rats and rhesus monkeys to optimized model parameters was of interest to confirm that these parameters are identifiable from the experimental data, and sensitivity to dose was of interest because of the implications for dose–response analysis. The rat results are summarized in Figure 5. At the lowest dose in the rat kinetic study, 5 mg/kg, predicted blood DNAN and DNP concentrations had an approximately linear relationship with dose (NSC ≈ 1) at all times when DNAN and DNP were measured (Figure 5A and B). At the high dose, greater sensitivity of predicted blood DNAN concentrations to administered dose was identified at increasing times after administration (NSC >2 at 2 hours after dosing), because the duration for which the dose yields liver concentrations of DNAN that saturate metabolism will be longer at higher administered doses (Figure 5C). At the low dose, DNAN concentrations are equally sensitive to the values for the maximal rate of metabolism (VmaxC) and the Michaelis constant (KM) but in opposite directions (Figure 5A). In contrast, at the high dose, predicted blood DNAN concentrations were consistently more sensitive to the VmaxC value than the KM value (Figure 5C). This pattern indicates that metabolism was not saturated at the low dose but was at the high dose. Predicted DNP concentrations were increasingly sensitive to the first-order clearance rate for DNP as the time elapsed since dose administration increased (Figure 5B and D). Predicted blood concentrations of DNAN and DNP were also dependent on partitioning to muscle (PMu, PMu1) and, to a lesser extent, fat (PF), because of the size of the muscle compartment and the relatively high affinity of DNAN for adipose tissue.
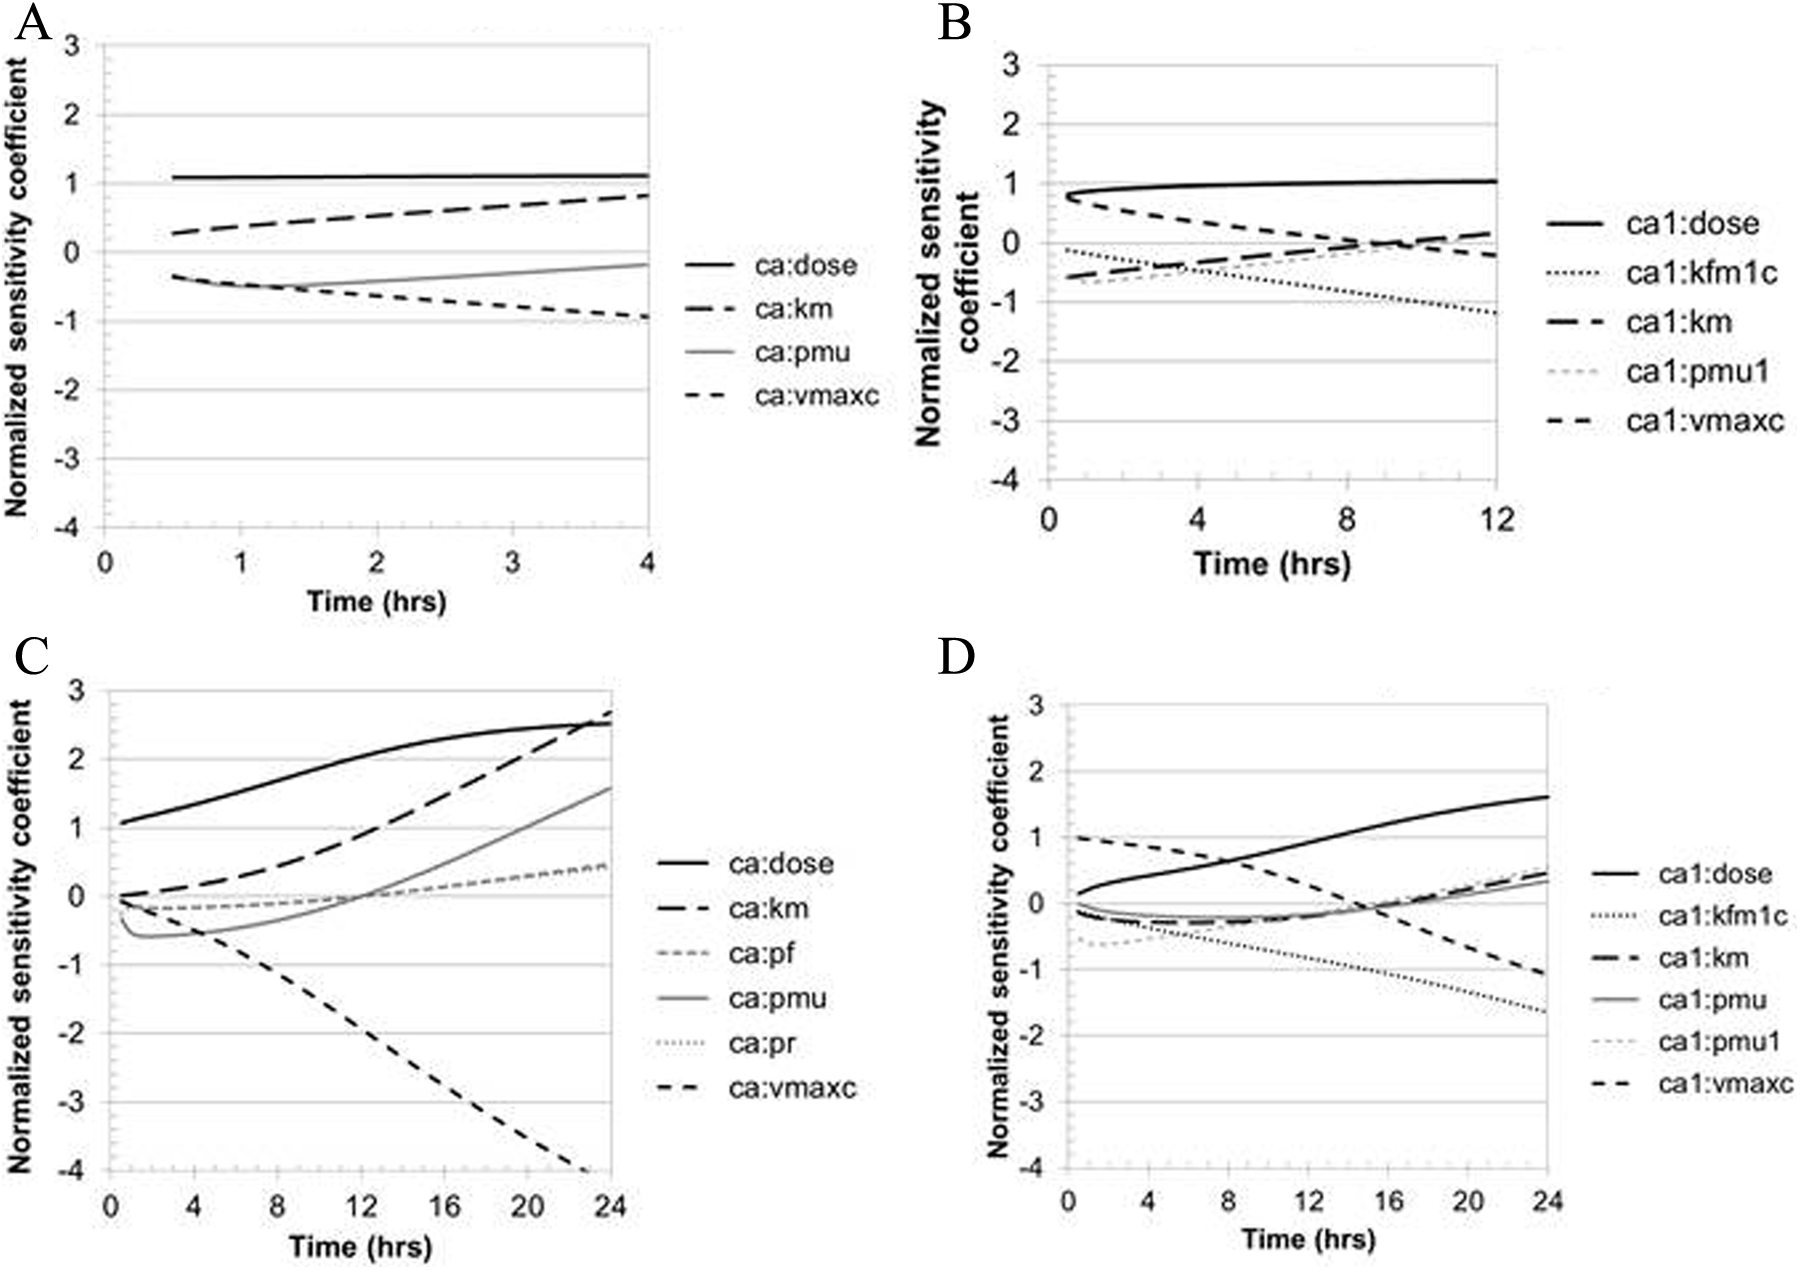
Sensitivity of model predictions of rat blood DNAN or DNP concentrations to dose or optimized model parameters. Parameters are only included if the |NSC| >0.3 during the period where the compound was detectable in the blood. (A) Sensitivity of blood DNAN and (B) DNP predictions after low-dose DNAN (5 mg/kg). (C) Sensitivity of blood DNAN and (D) DNP predictions after high-dose DNAN (80 mg/kg). DNAN indicates 2,4-dinitroanisole; DNP, 2,4-dinitrophenol.
Figure 6 displays the results of the local sensitivity analysis for predicted blood concentrations of DNAN and DNP in rhesus monkeys. Similar to the findings for rats, blood concentration of DNP in monkeys had a nearly linear relationship with dose, but DNAN concentrations would be predicted to increase more than in a linear relationship, suggesting the tested dose is near the range of metabolic saturation. Likewise, in terms of absolute value, blood DNAN and DNP concentrations are slightly more sensitive to VmaxC than KM, as would be expected at doses in the range between linear kinetics and essentially zero-order kinetics. The rhesus monkey simulations show greater sensitivity to the absorption rate than did the rat blood simulations—the normalized sensitivity coefficients for the predicted blood concentrations for rat blood were just below the threshold of |NSC| >0.3 that was used for inclusion in the figures, since they would be hard to discern in figures where NSC ranges from −4 to 3.
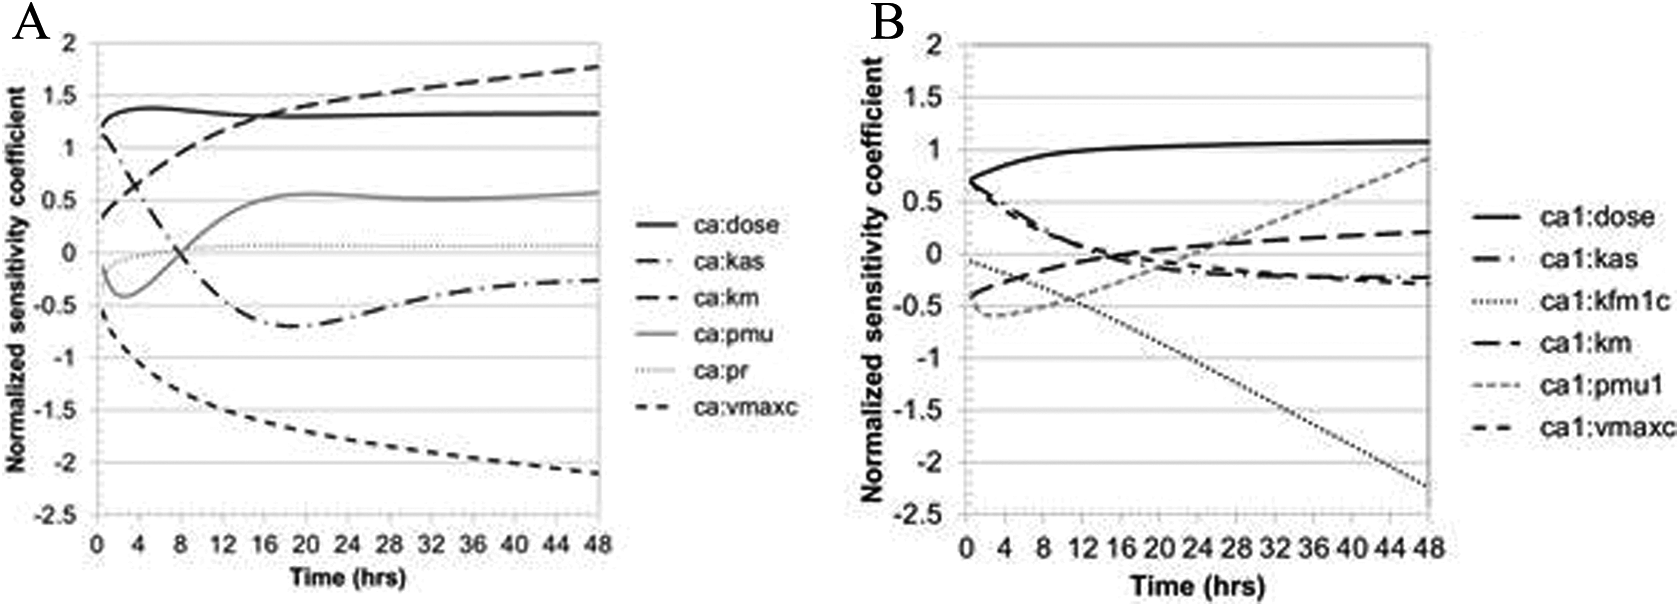
Sensitivity of model predictions of rhesus macaque blood DNAN or DNP concentrations to dose or optimized model parameters. Parameters are only included if the |NSC| >0.3 during the period where the compound was detectable in the blood. (a) sensitivity of blood DNAN and (b) DNP predictions high-dose DNAN (51 mg/kg). DNAN indicates 2,4-dinitroanisole; DNP, 2,4-dinitrophenol; NSC, normalized sensitivity coefficient.
The sensitivity analysis of the human model output was focused on dose metrics for potential risk assessment application at a dosage of 2 mg DNAN/kg/d. This dosage was selected because it is in the range of the rat BMDL for extramedullary hematopoiesis 2 and the HEDs derived for this BMDL (Table 8). The cumulative internal dosimetry of DNAN and DNP in humans at this dosage (Figure 7) was found to have linear relationships to the daily dose (DDOSE) and was sensitive to the metabolic parameters for DNAN and DNP clearance, respectively.
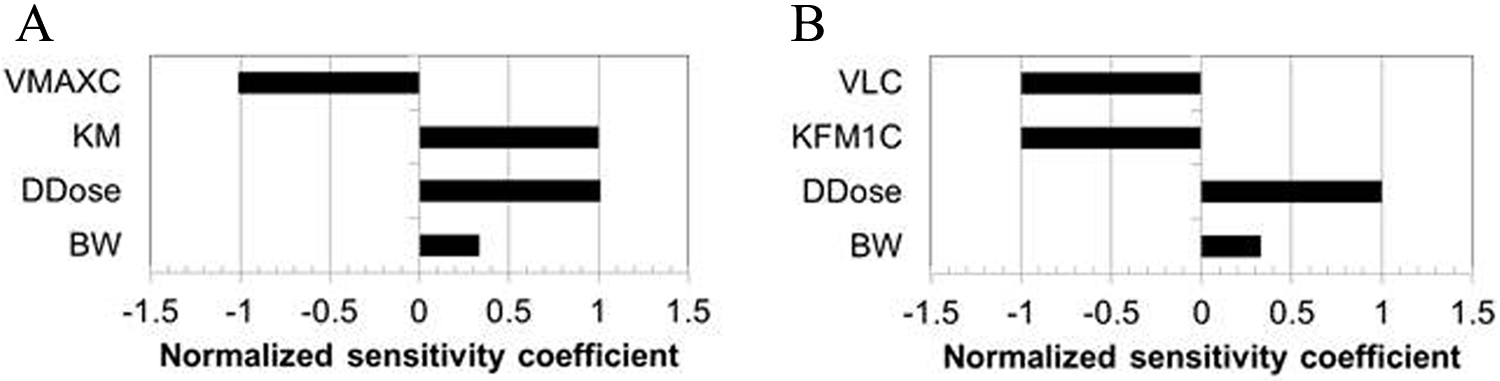
Sensitivity of model predictions of cumulative human blood DNAN or DNP levels to all model parameters for adults exposed to 2 mg DNAN/kg/d (ingested continuously over 12 hours) for 90 days. (A) DNAN AUC and (B) DNP AUC. DNAN indicates 2,4-dinitroanisole; DNP, 2,4-dinitrophenol.
Discussion
The rat PBPK model for DNAN and DNP was calibrated using blood and tissue (kidney and adipose) data collected for this purpose (Figure 2). The agreement between the model structure and the individual data points was very good for the DNAN calibration data (on average, within 1.6- to 2.0-fold) and excellent for DNP (on average, within 1.3- to 1.4-fold). The calibration data sets encompassed 3 dosage levels (16-fold range of applied doses) and included >50 measurements per analyte per matrix. Smaller validation data sets were also reasonably well described by the model, including one that was for a dose modestly above the calibration range (Table 5). 3 The in vitro, in silico, and optimized in vivo partition coefficient estimates for rat tissues were generally within 3-fold of each other. While limited data were available for the rhesus macaque, an optimized model was consistent with the kinetics of DNAN and DNP in 3 of 4 animals (Figure 4 and Table 6).
The model structure differs slightly from that previously used for RDX. 18,19 For the simulations of rat RDX gavage studies, oral absorption appeared to be better described by a 2-compartment gastrointestinal (GI) tract model, rather than a single compartment. The same structure was tested for the DNAN gavage data but the optimized model fits for DNAN returned values of zero for the rate of transfer to the second GI compartment, so the simplified 1-compartment GI model is depicted in the model structure (Figure 1). The other difference in model structure as compared to RDX is that the DNAN/DNP model describes the metabolism of DNAN to DNP as being saturable. From direct inspection of the blood and tissue concentration data for the parent compound DNAN, it was not obvious that first-order kinetics would yield an inadequate model fit. The lack of a first-order relationship was evident particularly in the 12- and 18-hour DNP concentrations for the 20 and 80 mg/kg doses. At the high dose, blood and kidney DNP concentrations at 18 hours were virtually unchanged from the concentrations at 12 hours, whereas at the middle dose, DNP concentrations had decreased sharply between 12 and 18 hours. This kinetic behavior was more faithfully reproduced by incorporating saturable metabolism of DNAN into the model. The difference between the RDX and DNAN models may be because the RDX data were, for the most part, collected at lower doses, compared to the DNAN data and no kinetic information on metabolites was available to aid model parameterization.
The rat and rhesus macaque clearly have toxicokinetic differences with respect to DNAN and DNP at the tested dose of 20 mg/kg in corn oil (Hoyt et al 3 and current data). The peak blood DNAN concentrations in the macaque are roughly 4-fold higher than in the rat, while the peak DNP concentrations are about 50% higher in the macaque than in the rat. The optimized model parameters point to substantial differences in absorption and DNAN metabolism rates as potential explanations (Table 4). As noted in “Parameterization of the Human Model” section, the conclusion that monkeys had relatively high rates of DNAN metabolism as compared to rats is consistent with estimated rates of in vivo metabolism of RDX in rats versus humans 18 and in vitro metabolism of 2,6-DNT. 34,35 The greater than 10-fold difference in absorption rates between monkeys and rats (higher in rats) is harder to explain. The monkeys were fasted and anesthetized with ketamine and acepromazine, 3 while the rats were fed and not anesthetized but fasting would typically be expected to increase the absorption rate than to decrease it. Because of this uncertainty, when human kinetic predictions were made, both monkey- and rat-derived absorption rates were simulated.
Several rat model parameters were determined by optimization, including partition coefficients. Time course tissue concentration data are not nearly as common as blood concentration data, and the use of partition coefficients determined in vitro or in silico is generally well accepted in pharmacokinetic modeling. However, because this study involved high nitrogen compounds, we wished to test whether in vitro and in silico methodologies more commonly applied to other classes of chemical compounds (eg, halogenated compounds, aromatic hydrocarbons, and drugs) could yield results comparable to in vivo data. The similarities observed in this study for DNAN increase confidence in using the in silico approaches for related compounds where measuring tissue concentrations may not be practical or feasible. Because of loss of DNAN from stored spiked liver tissue samples, the partition coefficient for liver (PL) could not be independently determined and was assumed equal to that of richly perfused tissues (PR). Since predicted blood concentrations of DNAN and DNP in rats, macaque, and humans showed relatively little sensitivity to PR, it is unlikely that the inability to independently measure PL had an impact on the other parameter values that were estimated from the rat or macaque data or the model predictions for humans (Figures 5 –7).
The rat PBPK model was used to simulate internal doses associated with a previously conducted subchronic study of DNAN toxicity (Table 7). 2 These internal dose metrics demonstrated different relationships to external dose (eg, linear, sublinear, and superlinear at high dose). As noted by McLanahan et al, the choice of conducting first the benchmark dose modeling then the PBPK modeling or vice versa can have an impact on the quality of the fit for the benchmark dose analysis and the resulting BMDL. 36 When mode of action information can guide the selection of the most appropriate internal dose metric, PBPK modeling prior to benchmark dose analysis should be considered preferred. Lent et al conducted benchmark dose–response modeling for the finding of extramedullary hematopoiesis in female rats because of a preliminary determination that this end point was among the more sensitive end points in the study. 2 The BMDL of 2.3 mg/kg/d (gamma, quantal-linear, and Weibull models) for extramedullary hematopoiesis was associated with the lowest Akaike Information Criterion values (indicating the best fit, after a penalty for higher numbers of adjustable variables). This point of departure should be considered a preliminary assessment of key effects in the study because additional histopathological examination is being considered, and other end points have not been evaluating using benchmark dose analysis. Other end points with the same NOAEL (5 mg/kg/d) as found for extramedullary hematopoiesis were also identified (eg, urine volume, color, and specific gravity) but were deemed less appropriate for risk assessment. Nonetheless, an interspecies extrapolation based on the point of departure for extramedullary hematopoiesis can demonstrate the impact of the choice of internal dose metric, dosing rate, and absorption rate on the derived human-equivalent external dose. The application of a PBPK model parameterized using data from male rats and rhesus macaques for an end point observed in female rats only introduces some uncertainty into the extrapolation, as kinetic differences between the sexes is a possibility.
Internal doses associated with the benchmark dose derived on the basis of external dose of DNAN 2 were used as the basis for potential HEDs for extramedullary hematopoiesis (Table 8). Blood metrics were used as the internal dose metric because the selected end point is associated with the blood system, and blood predictions are effectively proportional to predicted concentrations in richly perfused tissues such as the spleen and kidney (Figure 2), which rapidly achieve equilibrium with the blood. Depending on the dose metric, the HEDs were greater than, less than, or almost equivalent to this rat benchmark dose. The uncertainty regarding the GI absorption rate of DNAN has little impact on the HED unless the rate is assumed to be relatively high and human intake is delivered as a bolus, rather than continuous, and the relevant internal dose metric is believed to be peak blood concentration of DNAN. Some uncertainty in the DNAN absorption rate is consistent with the previous determination that optimal RDX absorption rates from the stomach or intestines varied with the form in which the chemical was delivered, for example, capsule versus gavage and fine versus coarse chemical (range of 0.0050-0.83/h). 18,19
In summary, in vivo blood and tissue concentration data describing the time course of DNAN and its metabolite DNP after DNAN gavage administration were developed for the rat; these data permitted the development of a PBPK model for DNAN and DNP in the rat. This model structure and some species-insensitive chemical-specific values were used to aid in calibration of a DNAN/DNP PBPK model for the rhesus macaque from a more sparse time course study 3 by optimizing a more limited set of chemical-specific disposition parameters. The macaque-derived parameters were concluded to be the most appropriate basis for a human PBPK model based on phylogenetic proximity and based on supporting information from structurally related chemicals. The rat and human PBPK models were used to estimate potential human-equivalent doses for a benchmark dose of an important effect in a subchronic study of DNAN in the rat; this example demonstrates how the models can be used to reduce uncertainty related to interspecies-, high-to-low dose-, and exposure scenario-related extrapolations and inform the selection of human toxicity reference values.
Footnotes
Appendix A
Acknowledgments
We thank Kathy Frondorf, Nathan Gargas, Elizabeth Phillips, and Antonio Brown from NAMRU Dayton for their assistance in the completion of these studies. We thank the following individuals from the US Army at Aberdeen Proving Ground: Art O’Neill for providing pharmacokinetic data, Karl Kroeck for advice on analytical aspects of the study, Mark Johnson for advice on data interpretation, and Emily Lent for additional insights on findings from the subchronic study of DNAN in rats.
Author Contribution
L. M. Sweeney contributed to conception and design, analysis and interpretation, and drafted the article. M. R. Goodwin contributed to design, acquisition and analysis, and drafted the article. A. D. Hulgan contributed to analysis and drafted the article. C. P. Gut contributed to acquisition and analysis and drafted the article. D. I. Bannon contributed to acquisition and interpretation and critically revised the article. All authors gave final approval and agree to be accountable for all aspects of work ensuring integrity and accuracy.
Authors’ Note
The views expressed in this article are those of the authors and do not necessarily reflect the official policy or position of the Department of the Navy, Department of Defense, nor the US Government. The experiments reported herein were conducted in compliance with the Animal Welfare Act and in accordance with the principles set forth in the “Guide for the Care and Use of Laboratory Animals,” Institute of Laboratory Animal Resources, National Research Council, National Academy Press, 1996. This work was prepared as part of their official duties. Title 17 U.S.C. §105 provides that “Copyright protection under this title is not available for any work of the United States Government.” Title 17 U.S.C. §101 defines a US Government work as a work prepared by a military service member or employee of the US Government as part of that person’s official duties. Individuals with an interest in any of the underlying research materials (eg, model code) should contact Dr Sweeney, the corresponding author.
Declaration of Conflicting Interests
The author(s) declared the following potential conflicts of interest with respect to the research, authorship, and/or publication of this article: The authors are contract employees or direct employees of the US Government.
Funding
The author(s) disclosed receipt of the following financial support for the research, authorship, and/or publication of this article: This work was funded by the US Army Environmental Quality Technology, Ordnance Environmental Program through the Army Research, Development, Engineering Command, Environmental Sustainment Acquisition and Logistics Program through coordination with the Army Institute of Public Health, Toxicology Portfolio and conducted under work unit number (WUN) H1263.