
Abstract
3-Nitro-1,2,4-triazol-5-one (NTO) is a component of insensitive munitions that are potential replacements for conventional explosives. Toxicokinetic data can aid in the interpretation of toxicity studies and interspecies extrapolation, but only limited data on the toxicokinetics and metabolism of NTO are available. To supplement these limited data, further in vivo studies of NTO in rats were conducted and blood concentrations were measured, tissue distribution of NTO was estimated using an in silico method, and physiologically based pharmacokinetic models of the disposition of NTO in rats and macaques were developed and extrapolated to humans. The model predictions can be used to extrapolate from designated points of departure identified from rat toxicology studies to provide a scientific basis for estimates of acceptable human exposure levels for NTO.
Keywords
Introduction
3-Nitro-1,2,4-triazol-5-one (NTO, CAS no. 932-64-9) is a component of insensitive munitions that are being developed as potential replacements for conventional explosives such as 1,3,5-trinitrohexahydrotriazine (RDX), octahydro-1,3,5,7-tetranitro-1,3,5,7-tetrazocine (HMX), and 2,4,6-trinitrotoluene. The synthesis of NTO was initially described in 1966, but it was only later (in the 1980s) that its potential for transmission of “shock and impact insensitive explosive chemical energy” was described by researchers at Los Alamos National Laboratory. 1 Because of its high water solubility (12.8 g/L at 19°C) 2 and potential for environmental persistence, it was recommended that gaps in the toxicological database for NTO be filled by further experimentation. 3
3-Nitro-1,2,4-triazol-5-one has low acute toxicity to mammals 4 (median oral lethal dose in rats and mice >5 g/kg). 3-Nitro-1,2,4-triazol-5-one was not genotoxic in the in vitro Ames test, SOS Chromotest, Chinese hamster ovary cell chromosomal aberration test, and mouse lymphoma mutagenesis test, and negative with regard to in vivo clastogenicity and aneugenicity when administered by gavage to male and female Sprague-Dawley rats in a 14-day subacute study. 5 Decreased testes’ weights were identified as the key effect in a subacute oral toxicity study of NTO in Sprague-Dawley rats (no observed adverse effects level [NOAEL] = 250 mg/kg/d, lowest observed adverse effects level [LOAEL] = 500 mg/kg/d). 6 In a subchronic oral study of NTO in rats, the lowest tested dose, 30 mg/kg/d by gavage in polyethylene glycol (PEG) 200, microscopic changes in the testes were observed, in addition to statistically significant reductions in testis weights at doses of 315 mg/kg/d. 6 3-Nitro-1,2,4-triazol-5-one (at doses up to 1000 mg/kg/d) was found to be neither estrogenic nor antiandrogenic in the in vivo Hershberger and uterotrophic tests. 7 The mode of action for the testicular effects of NTO is not yet known, but it does not appear to act as an endocrine disruptor.
Toxicokinetic data can aid in the interpretation of toxicity studies and interspecies extrapolation, but only limited data on the toxicokinetics and metabolism of NTO are available. Le Campion and coworkers 8,9 investigated the metabolism of NTO by microsomes isolated from livers of male Sprague-Dawley rats. Uninduced rat liver microsomes metabolized NTO by denitrification to 5-amino-1,2,4-triazol-3-one. Cytochrome P450 (CYP) induction by treatment with dexamethasone, phenobarbital, and 3-methylcholanthrene had minimal effect on the rate of NTO metabolism, expressed as the rate per milligram microsomal protein. However, treatment with clofibrate, a CYP4A inducer, increased the rate of NTO metabolism almost 5-fold, suggesting that CYP4A enzymes are important in the hepatic metabolism of NTO in rats. Hoyt et al 10 dosed male rhesus macaques with nominal doses of 5, 25, or 50 mg/kg NTO by gavage in deionized (DI) water and measured NTO in blood, serum, or urine for up to 48 hours. They also reported blood NTO measurements in rats that had received a single gavage dose of 24 or 25 mg/kg. To supplement these limited data, further in vivo studies of NTO in rats were conducted, tissue distribution of NTO was estimated using an in silico (computational) method, and a physiologically based pharmacokinetic (PBPK) models of the disposition of NTO in rats and macaques were developed. These models can be used to aid the interpretation of dose–response relationships in test species and to provide a stronger scientific basis for the extrapolation of effect/no effect levels in test animals to human equivalent NTO exposures.
Materials and Methods
In Vivo Studies
Study design
The Organisation for Economic Cooperation and Development recommends the use of a minimum of 2 doses and 4 or more animals per sex, per dose, and per time point for the main plasma/blood kinetics time course study. 11 The study used only male rats because the effects observed at the lowest doses in the subchronic NTO study were limited to male rats. 6 Based on the results of a pilot study, doses of 100, 200, and 400 mg/kg were selected. Blood samples were collected from 6 animals per time point at 0.5, 1, 2, 4, 6, 8, 10 (low dose only), and 24 (medium and high doses only) hours after administration. A total of 18 rats were used for each dose group; multiple blood samples (up to 3) were collected from each rat.
Animals
All experiments involving animals were conducted in accordance with the Institute of Laboratory Animal Resources Guide for the Care and Use of Laboratory Animals and were approved by the Wright-Patterson Air Force Base Institutional Animal Care and Use Committee. Pathogen-free male Sprague-Dawley rats (Crl: CD(SD) BR rats; 5-6 weeks old upon receipt) were obtained from Charles River Laboratories (Raleigh, North Carolina). Animals were quarantined for at least 14 days prior to dosing. Animal care and housing was provided in accordance with the recommendations in the National Research Council, 12 with approximately 15 complete air changes per hour and a 12 hour:12 hour electronically controlled light:dark cycle, temperatures maintained between 68°F and 79°F, and relative humidity maintained between 30% and 70%. The rats were individually housed in polycarbonate rodent cages with cell-sorb bedding and had ad libitum access to rodent chow and water. The rats were observed twice per day by vivarium personnel for any signs of pain, distress, or any other abnormalities. Rats were 7 to 9 weeks old at the time of dosing. The animal weights at dosing were as follows (mean ± standard deviation, range, in g): low dose 350 ± 9 and 338 to 367; medium dose 323 ± 9 and 308 to 336; and high dose 256 ± 18 and 216 to 311.
Test article and dosing
3-Nitro-1,2,4-triazol-5-one was obtained from BAE Systems Ordnance Systems, Inc (Kingsport, Tennessee), with a manufacturer-reported purity of 99.8%. Dosing solutions were prepared by pulverizing a sufficient amount of NTO and suspending it in PEG 200 (SPI-Chemicals, West Chester, Pennsylvania). The suspension was quantitatively transferred into an appropriate sized volumetric flask and brought to volume. Dosing solutions were stirred overnight on a stir plate with a magnetic stir bar. Doses were delivered to unfasted animals in a volume of 10 mL PEG 200/kg body weight using an 18 to 20 gauge, 3-in long stainless steel gavage needle.
Sample collection and storage
Blood samples were collected from dosed animals via the lateral tail vein (300 µL/rat/tail vein draw), with the exception of terminal blood samples. For terminal blood samples from dosed rats and naive rats, the animals were anesthetized by exposure to 70% CO2 until they were no longer responsive to toe pinch. The abdomen was then opened with scissors, the diaphragm cut, and the intestines moved to one side so that blood could be drawn from the vena cava. A 21 to 23 gauge needle was used for all blood collection procedures. Samples were transferred to 2 mL screw top cryovials, frozen in liquid nitrogen, and transferred to a –80°C freezer until analysis or use in calibration.
Analytical system
3-Nitro-1,2,4-triazol-5-one in blood was analyzed by high performance liquid chromatography analysis on a Waters Alliance 2695 Separations module with Waters 2487 absorbance detector (Waters Corporation, Milford, Massachusetts). The column used was Ultra C18 5 µm, 250 × 4.6 mm (Restek Corp, Bellefonte, Pennsylvania). The mobile phase mixture of 75:25 acetonitrile:DI water was run isocratically at a rate of 0.3 mL/min. The absorbance detector was set on single wavelength mode with a wavelength of 254 nm. The run time was 15 minutes.
Instrument calibration
Naive rat blood was thawed on ice, and 200 µL was used for each calibration point when necessary. Each 200 µL sample of blood was injected with known concentrations of NTO and HMX (Restek Corp) to calibrate the instrument and account for matrix interference caused by the blood. HMX was used as a surrogate to ensure there was minimal loss of analytes during extraction. The calibration had a minimum of 6 points with R 2 greater than or equal to 0.98. The calibration range for NTO in blood was 1 to 12.5 µg/mL. The instrument calibration was verified before and after every 20 samples using a continuing calibration verification sample spiked at the midpoint of the calibration. The instrument was considered in calibration if the target analyte had <30% deviation from the true value.
Blood analysis
Whole blood was thawed on ice, and 200 µL was taken and added to a 20 mL borosilicate glass scintillation vial with a foil lined screw top cap (Fisher Scientific, Pittsburgh, Pennsylvania). A known amount of HMX was added to the blood to serve as an extraction surrogate spike. A sufficient amount of 75:25 acetonitrile:DI water mixture was added to each vial to bring the final volume to 2 mL. The volume of the standards was adjusted for by the amount of 75:25 acetonitrile:DI water that was added. Blood from a naive rat was also spiked with HMX to serve as a method blank. The scintillation vials were then tightly capped and put on their sides on an orbital plate shaker for 60 minutes at approximately 700 rpm. The entire portion was transferred to a borosilicate glass test tube and centrifuged at 1200g for 10 minutes. The acetonitrile:DI water was then transferred to a 2-mL gas chromatography (GC) vial with a crimp cap (Restek Corp). A 10 µL sample from the GC vial was injected and analyzed via the instrument conditions mentioned earlier.
Pharmacokinetic Model Development
Model structure and parameter values
The preliminary model structure (Figure 1) and anatomical parameter values (Table 1) were taken from PBPK models developed for the structurally related, nitrogen rich compounds RDX 24 –26 and 2,4-dintiroanisole (DNAN). 27 Briefly, equilibrium between tissue and venous blood was assumed for all tissues, and metabolism was assumed to take place in the liver. Based on initial modeling efforts and evaluation of key data sets, urinary clearance and saturable reabsorption of NTO from glomerular urinary filtrate to the kidney (richly perfused tissues) were added to the model structure, per Loccisano et al. 22,23 Models were developed and simulations conducted using acslX version 3.0.2.1 (AEgis Technologies Group, Inc, Huntsville, AL), and Gear algorithm for stiff equations.
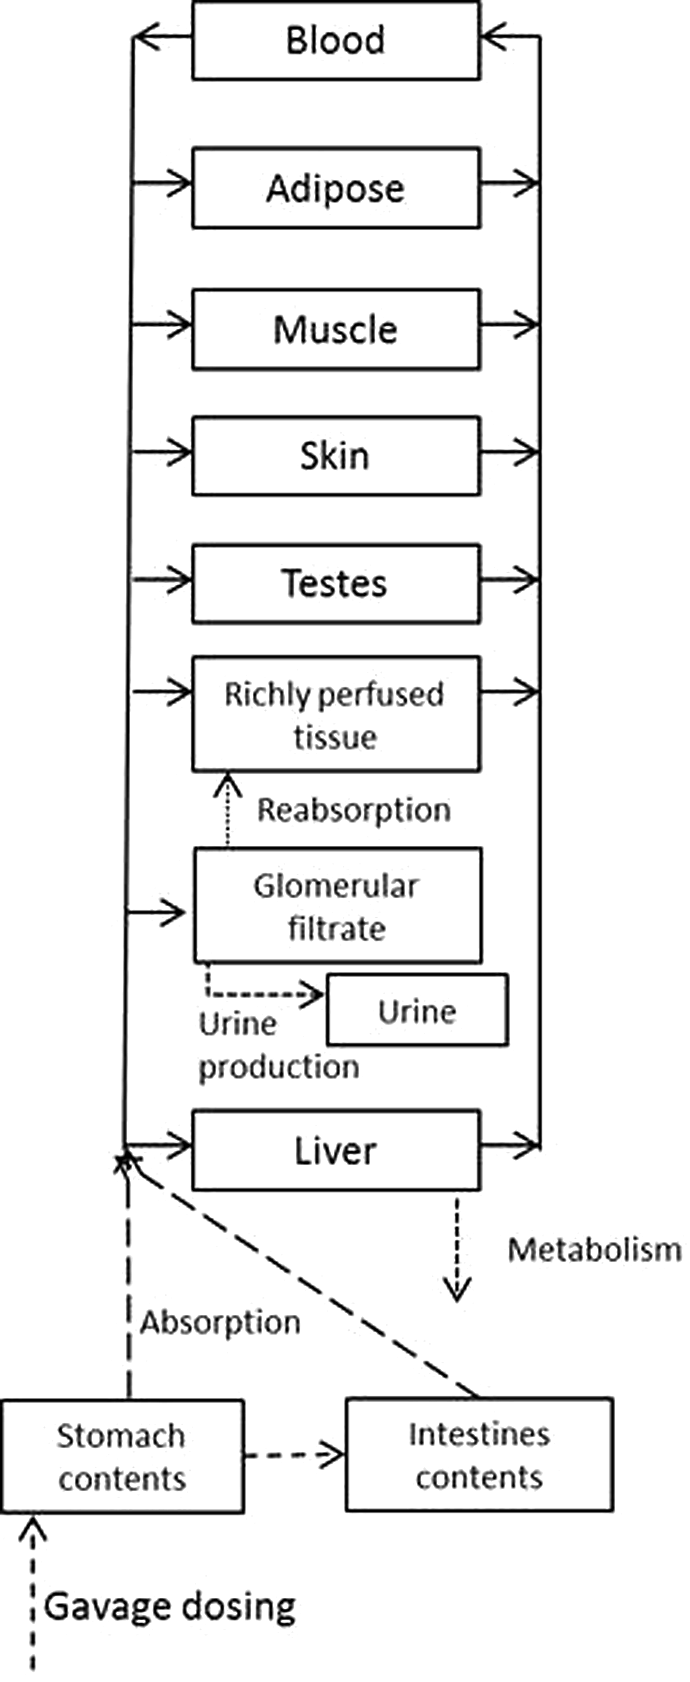
Structure of the physiologically based pharmacokinetic model for 3-nitro-1,2,4-triazol-5-one (NTO). Solid lines indicate blood flow and dashed lines indicate other processes as labeled.
Anatomical and Physiological Parameters for the NTO PBPK Model.
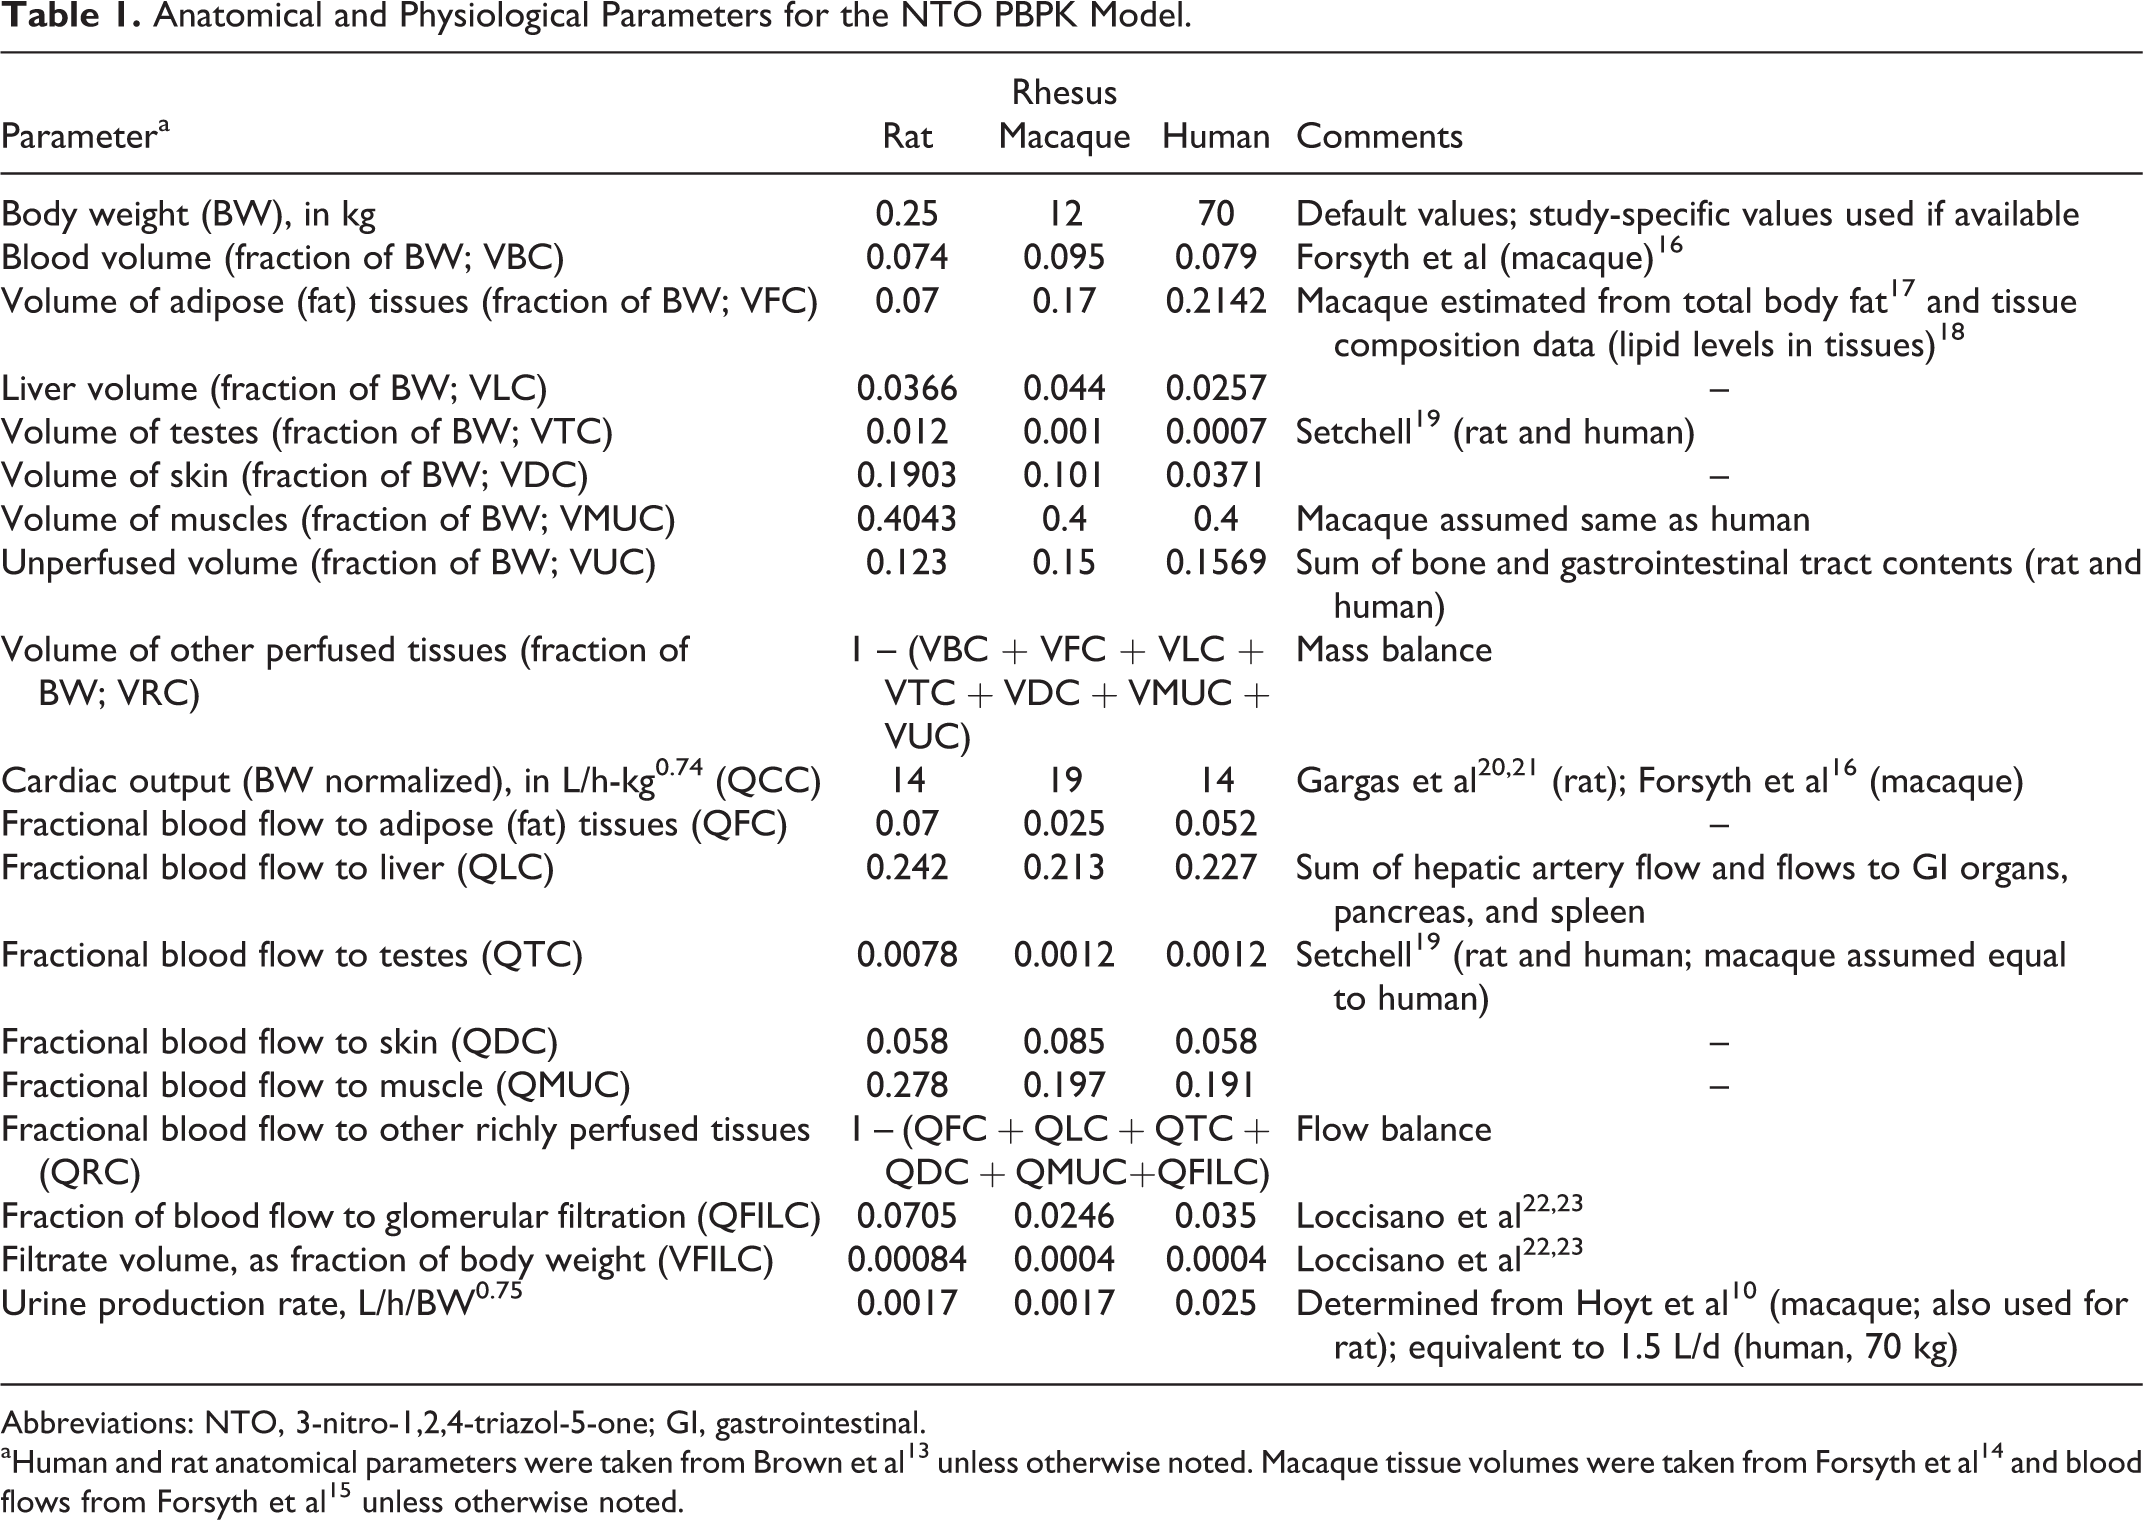
Abbreviations: NTO, 3-nitro-1,2,4-triazol-5-one; GI, gastrointestinal.
Partition coefficients were estimated using algorithms developed by Poulin and coworkers. 28 –30 Briefly, the tissue or blood:saline partition coefficient was estimated based on the relative amounts of water, phospholipid and neutral lipid, and the octanol:water partition coefficient (KOW); and the tissue:blood partition coefficient was computed ratio of the tissue:saline and blood:saline partition coefficients. The logKOW of 0.858 was determined experimentally via the shake flask method. 3 The resulting tissue:blood partition coefficients were 7.35 for adipose tissue, 1.20 for liver, 1.39 computed for brain (used for testes and other richly perfused tissues), and 0.98 computed for muscle (also used for skin).
Estimation of kinetic parameters
Chemical-specific parameters for gastrointestinal absorption, hepatic metabolism, and urinary reabsorption were determined by visual inspection of agreement between model predictions and experimental measurements (Table 2). Formal optimization was attempted, but the nature of the data sets, relatively flat concentration vs time profiles followed by nondetectable levels of NTO (Figures 2 and 3), resulted in “optimized” model parameters that were not consistent with the nondetects. The model fitting process started with rhesus macaque data 10 because blood and urinary concentration time courses were available for 3 dose levels, aiding in the identification of affinity constants for saturable processes (metabolism and urinary reabsorption). Parameter estimation via fitting model predictions to the rat experimental data was then conducted with the affinity constants fixed at the values determined for the rhesus macaque. The body weight normalized maximum metabolic capacity was also kept constant for all species. 3-Nitro-1,2,4-triazol-5-one is believed to be metabolized predominantly by the CYP4A enzymes, and the rate of lauric acid 12-hydroxylation, a marker for CYP4A activity, exhibited no large differences among 7 species, including rats, monkeys, and humans. 31 Because of their closer phylogenetic relationship, the best fit urinary reabsorption rate for rhesus macaque was used for humans. The absorption parameters determined for the macaque were also used for the human because the vehicle used in the macaque kinetic study 10 (water) is likely more relevant to human exposures than that used in the NTO kinetic study (PEG 200).
NTO PBPK Model Parameters Determined by Visual Inspection.
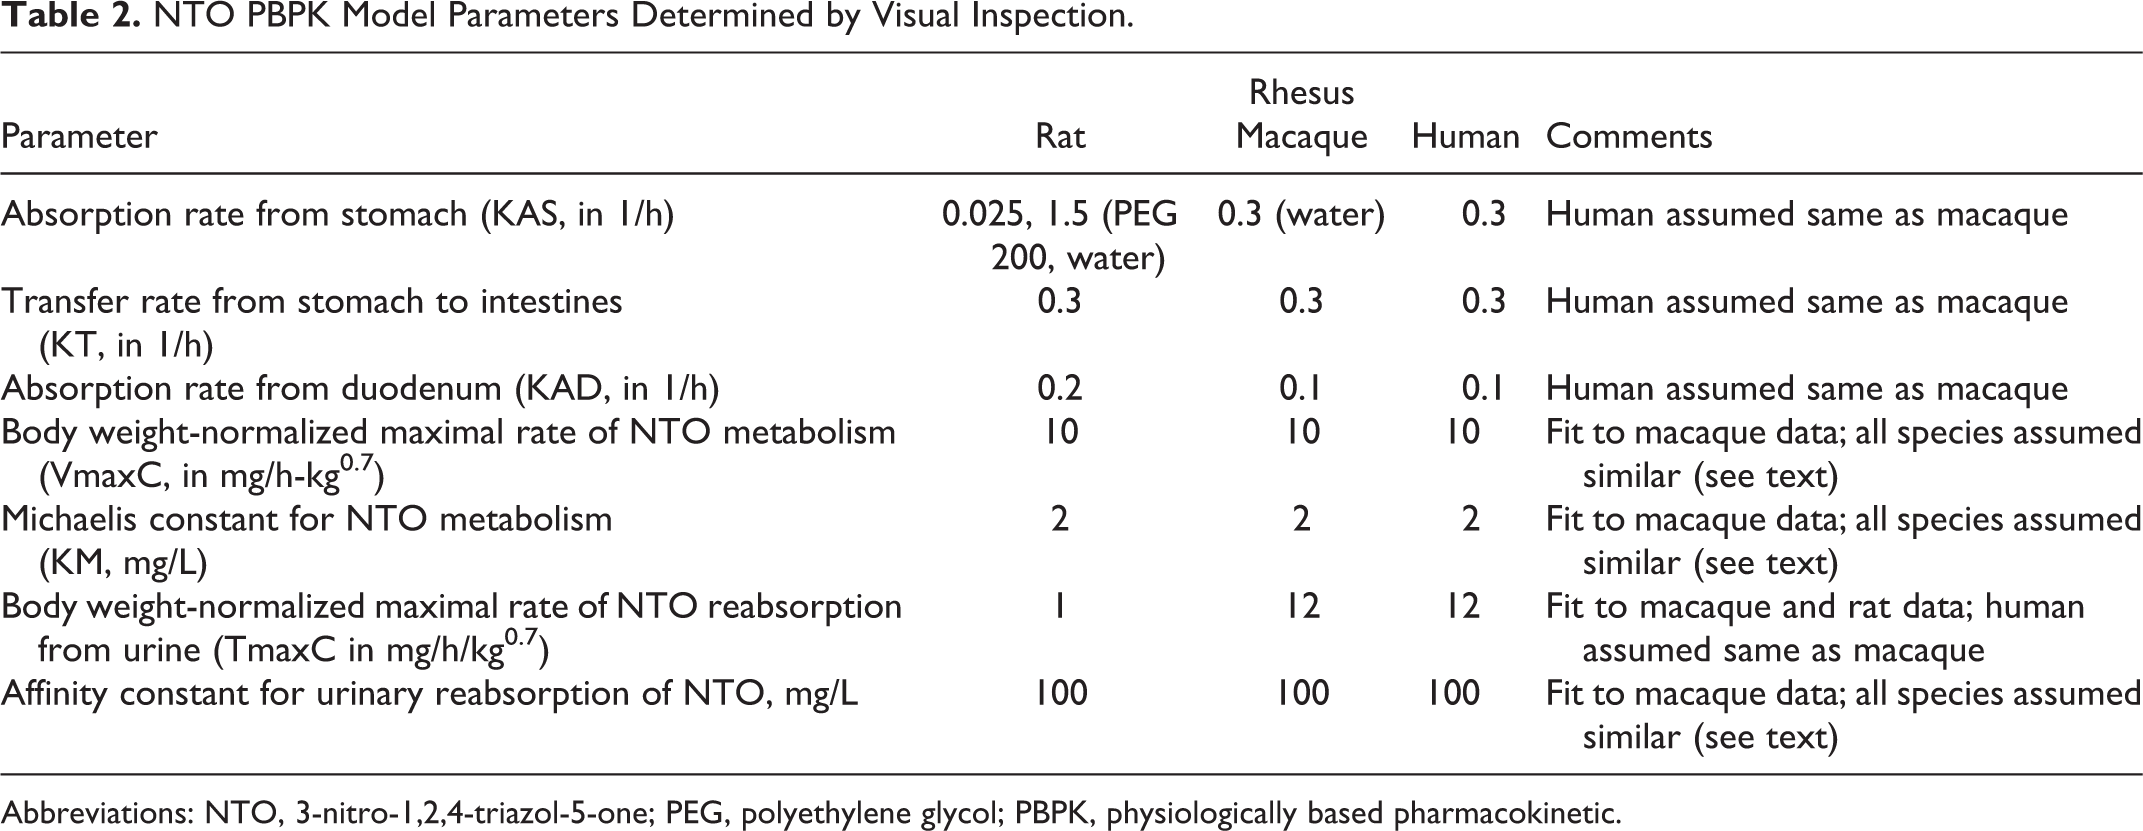
Abbreviations: NTO, 3-nitro-1,2,4-triazol-5-one; PEG, polyethylene glycol; PBPK, physiologically based pharmacokinetic.
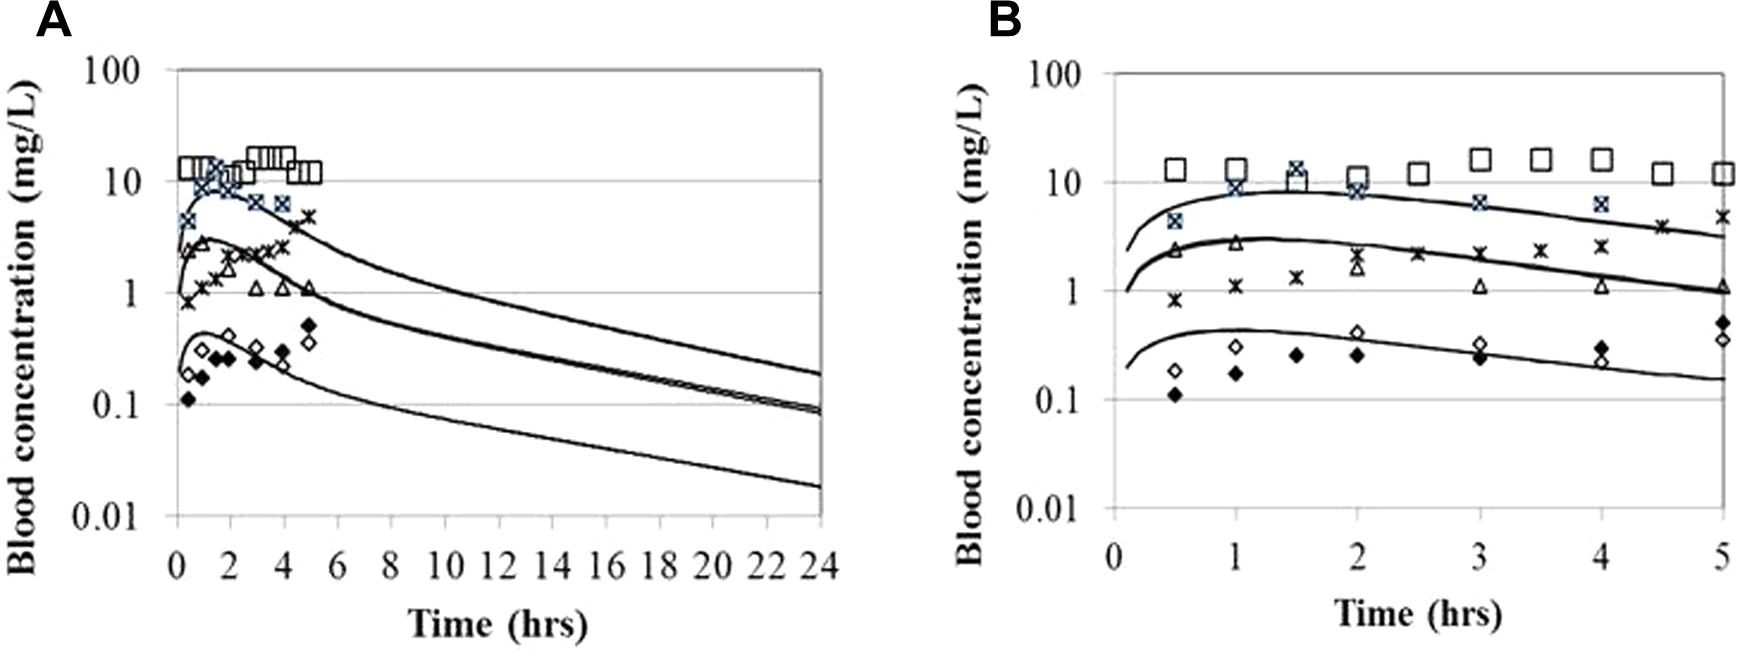
Blood NTO levels after oral administration to macaques at 3 dose levels. High dose 1: 47.5 mg/kg, 10.0 kg macaque (open square); high dose 2: 47.9 mg/kg, 10.2 kg macaque (square with an ×); middle dose 1: 21.5 mg/kg, 16.2 kg (triangle); middle dose 2: 24.1 mg/kg, 10.6 kg (asterisk); low dose 1: 5.6 mg/kg, 11.6 kg macaque (diamond); low dose 2: 5.4 mg/kg, 11.4 kg macaque (filled diamond). Experimental data of Hoyt et al 10 ; model simulations are indicated by solid lines and substantially overlap at each dose level. A, Experimental duration. B, Expanded presentation of the data for the first 5 hours postdosing.
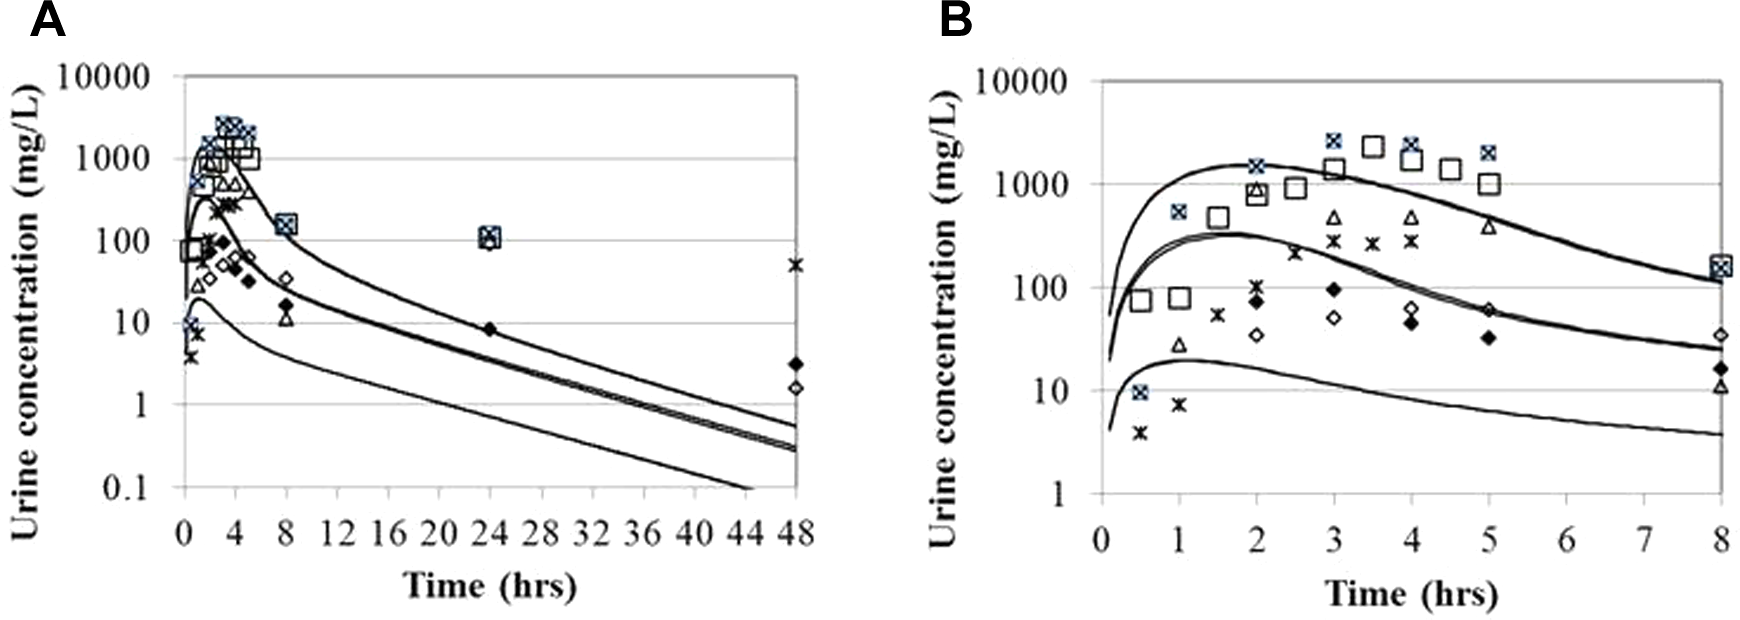
Urinary NTO levels after oral administration to macaques at 3 dose levels as described for Figure 2. Experimental data of Hoyt et al 10 (reflects average excreted during collection period; model simulations; instantaneous concentrations in the kidney filtrate) are indicated by solid lines and substantially overlap at each dose level. A, Experimental duration. B, Expanded presentation of the data for the first 8 hours postdosing.
Model evaluation
The International Programme on Chemical Safety has recommended that PBPK models used in risk assessment should yield predictions that are within, on average, a factor of 2 of the experimental data. 32 Therefore, the model predicted blood concentrations were compared to the individual animal measurements; the discrepancy between the 2 (the maximum of model prediction/experimental value or experimental value/model prediction) was computed for each datum, with a value of 1 indicating perfect agreement. The model was considered adequate if the geometric mean of the discrepancy values was less than or equal to 2 for the species.
Results
Model Calibration and Evaluation
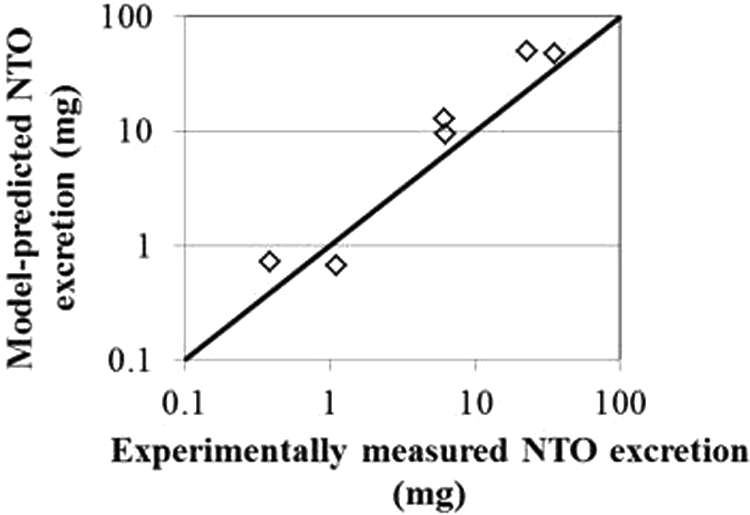
The blood time course data in the rhesus macaques were largely very flat for the 0.5 to 5 hours blood sampling period, while the urinary data show fairly distinct peaks in this interval (Figures 2 and 3). The urinary data were used semiquantitatively for model fitting; the experimental data, which were collected for specified intervals, would be expected to lag the predicted instantaneous concentrations in the urinary filtrate. The 5-hour urinary excretion totals were also used in model development (Figure 4). The gastrointestinal absorption parameters were selected such that the peak blood and urinary filtrate concentrations occurred slightly before the peak concentrations in the collected urine, which would be expected to have a slight delay due to 30-minute collection intervals.
The model parameterization for the rat was done with minimal adjustment of visual best fit parameter values determined for the rhesus macaque (Table 2). Only a few samples from the 100 mg/kg dose group had detectable levels of NTO, so only the 200 and 400 mg/kg kinetic data were used for model development. Rat gastrointestinal parameters were altered from those determined for the macaque in recognition of the different dosing vehicles used in the studies (water for the macaque, PEG 200 for the rat in the current studies), and the maximal rate of urinary reabsorption was also adjusted to fit the blood concentration data (Figure 5).
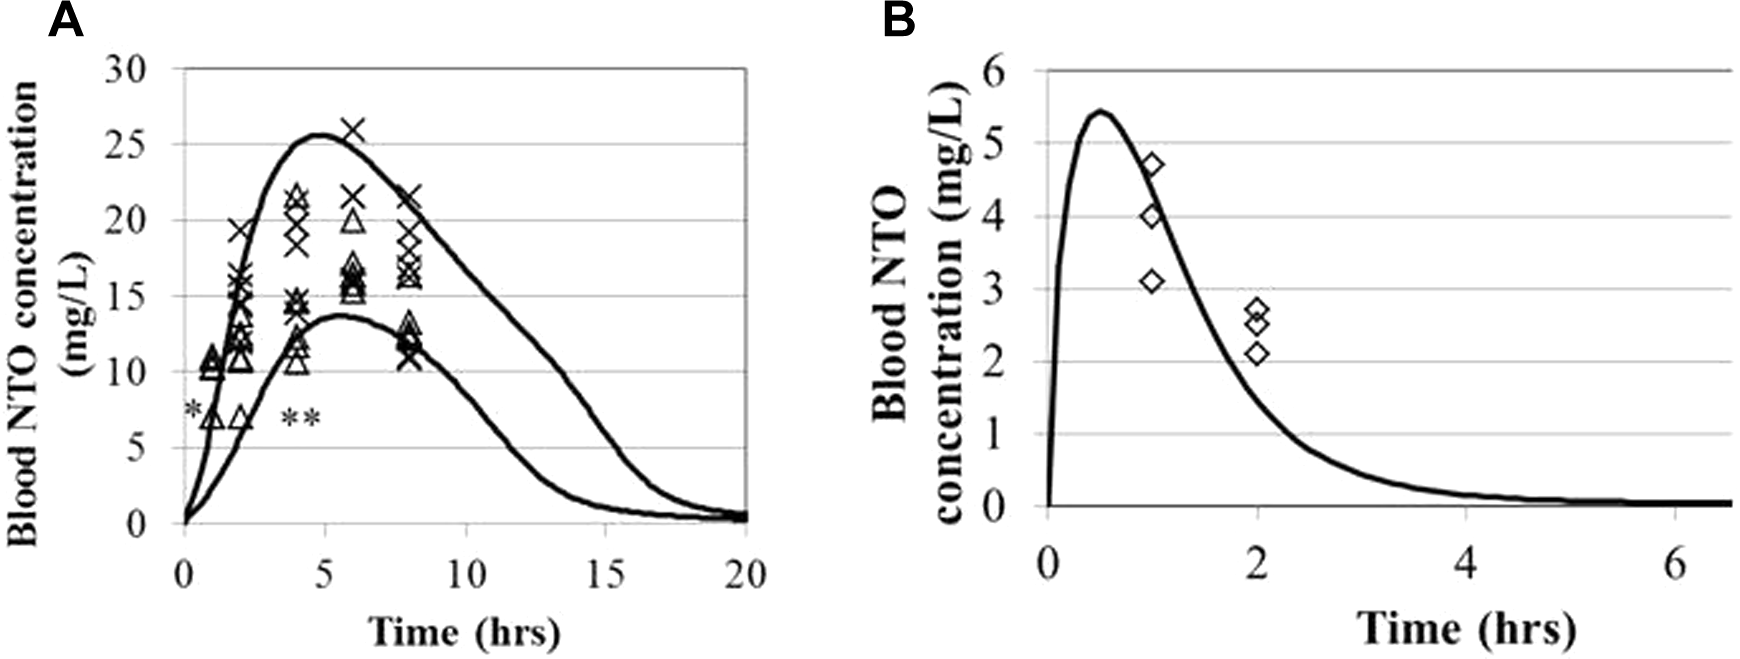
Blood NTO levels after oral administration to male Sprague-Dawley rats (A) 200 mg/kg (triangles) or 400 mg/kg (×) in polyethylene glycol 200 (this study) or (B) 24.7 mg/kg in water (Hoyt et al, 2013) 10 . * indicates sample concentrations estimated below the limit of detection.
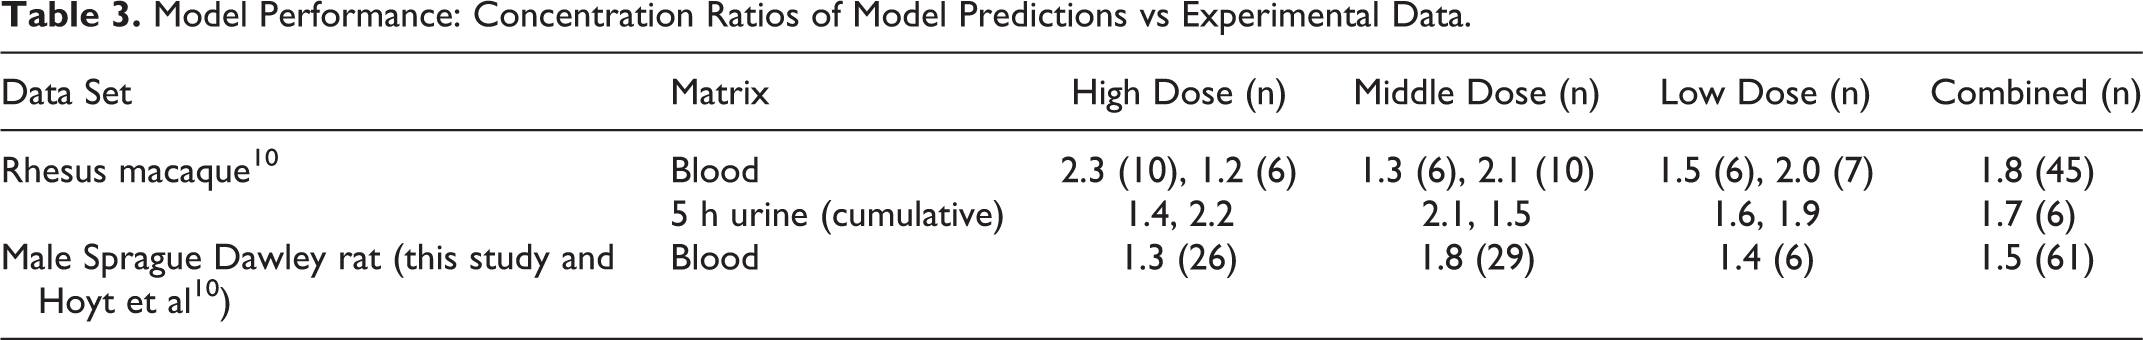
The agreement between the model predictions and the experimentally measured blood concentration of NTO was acceptable (within less than a factor of 2, on average) and similar between species and across doses (Table 3). The urinary predictions of total 5 hours excretion were also acceptable, despite the model not being optimized specifically for the fit to urinary data.
Model Performance: Concentration Ratios of Model Predictions vs Experimental Data.
Model Application
The model was applied to the interpretation of the subchronic study of NTO in which rats received daily doses of 30, 100, 315, and 1000 mg NTO/kg body weight/d6. The lowest tested dose was characterized as an LOAEL based on testicular hyperplasia, but the Benchmark Dose (BMD) 95th percentile lower confidence limit for a 10% increase in incidence (BMDL10) was 38 mg/kg/d. 33 The peak and time-weighted average blood concentrations (CApeak and CAavg) were determined for the rat subchronic exposure scenario and for humans ingesting NTO as a single bolus or continuously over 12 hours. The simulated dose range encompasses the doses used in the subchronic rat study (Figure 6). While neither of these human ingestion scenarios is entirely realistic, they serve as bounding conditions for more likely dose–rate combinations. At equivalent doses, NTO concentrations in humans are expected to be higher than those in rats by approximately a factor of 10. The ratio varies with dose, as humans experience a greater than linear increase in predicted blood CA with increasing dose, starting at doses of about 10 mg/kg/d, while similar increases in rats do not occur until the daily dose approaches 100 mg/kg/d.
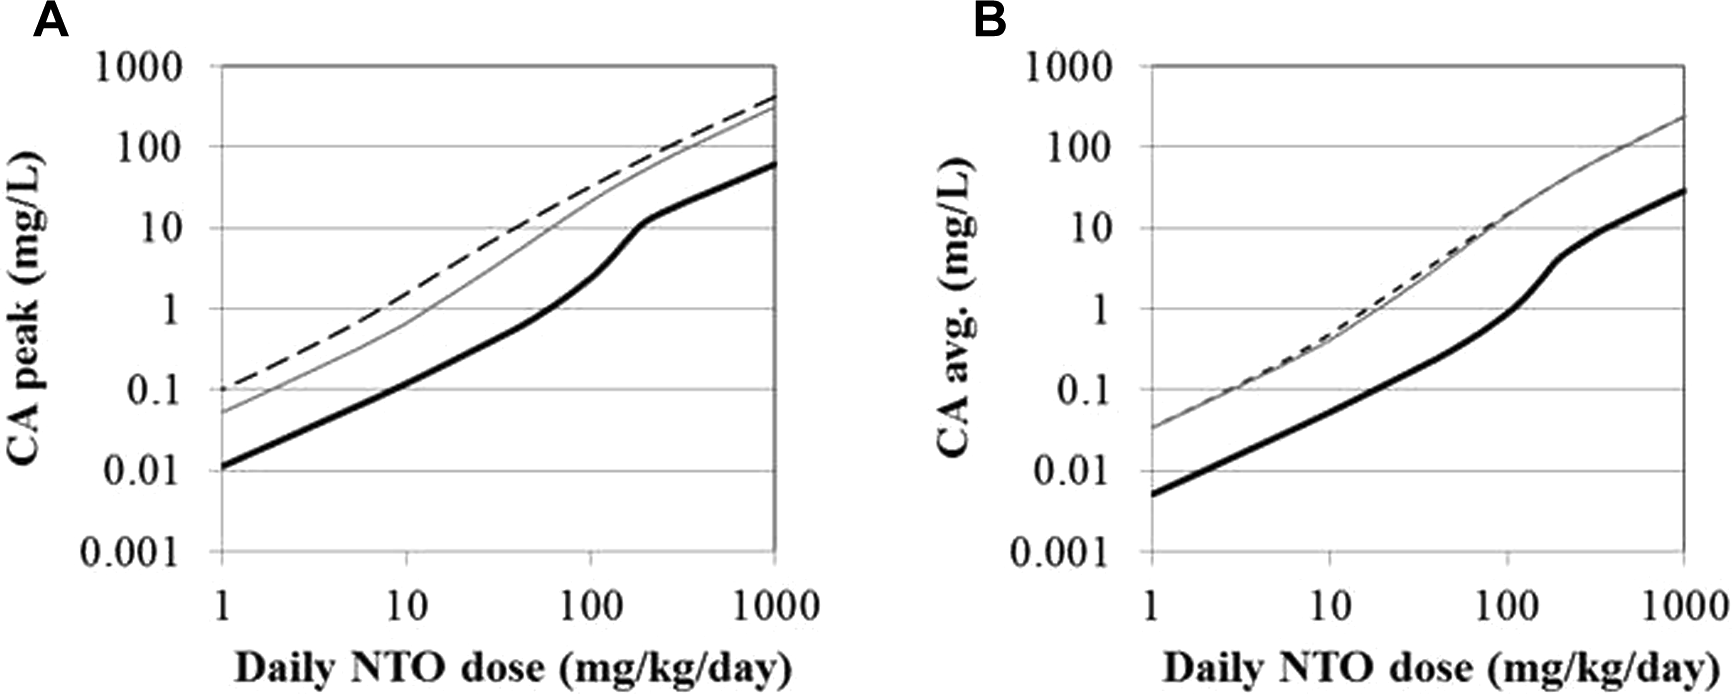
Predicted blood concentrations of NTO in rats after subchronic gavage and humans after bolus or continuous 12-hour ingestion. A, Peak blood concentration. B, Average blood concentration. Black line = rat; gray line = human (dashed = bolus and solid = continuous ingestion).
Discussion
The rat and rhesus macaque PBPK models for NTO were calibrated using blood concentration data (Figures 2 and 5), with the macaque model parameters informed by urinary concentration data and cumulative urinary excretion (Figures 3 and 4), which helped to differentiate between urinary and metabolic clearance of NTO from blood. The macaque model predictions are reasonably consistent with the data for the first 5 to 8 hours. The predicted 24-hour blood concentrations for the middle and low doses were consistent with the inability to detect NTO at this time or at 48 hours (no blood samples were collected after t = 5 hours in the high-dose study; Figure 2A). The 24 and 48 hours urinary concentrations were under predicted by the model (Figure 3A); this discrepancy was deemed acceptable as the utility of more complicated urinary elimination, storage, and reabsorption models that might better describe the urinary data would have minimal impact on the blood and tissue concentration predictions needed for risk assessment. The rat model tended to slightly overestimate the blood concentrations at the 400 mg/kg dose and underestimate those at the 200 mg/kg dose (Figure 5A).
The confidence in the model is somewhat limited by the relatively small amount of data available for its parameterization. Similar to the development of the PBPK models for RDX, 24 –26 no tissue concentration data were available, and no in vitro partition coefficients were determined; instead, calculated partition coefficients were used for all tissues. Nonetheless, the fit for the NTO model was found to be acceptable 32 for both rats and rhesus macaque. For the rat RDX model, the fit to the blood data was improved by optimization of the adipose:blood partition coefficient. 25 For the structurally related compound DNAN, partition coefficients estimated in vivo, in vitro, and in silico were found to be similar. 27
The relationships between external and internal doses, shown in Figure 6, can be used to convert a wide range of rat doses to equivalent human doses. As an example, the rat BMDL10 of 38 mg/kg/d is predicted to yield the same average blood concentration as a human bolus dose of 5.6 mg/kg/d or continuous (12 hours) dose of 6.1 mg/kg/d. In terms of peak blood concentrations, the BMDL10 is predicted to be equivalent to a 4.5 mg/kg/d bolus dose for a human or a continuous (12 hours) dose of 8.5 mg/kg/d. Among these 4 dose metrics, the human equivalent doses vary by less than a factor of 2, suggesting that the choice of internal dose metric and ingestion scenario do not have a substantial impact on the interspecies extrapolation predictions.
In summary, PBPK models for NTO in the rat and rhesus macaque have been calibrated using data from the literature, predicted partition coefficients, and additional rat time course data collected for this purpose. The resulting model has been extrapolated to allow predictions of the disposition of orally ingested NTO. The model predictions can be used to extrapolate from designated points of departure identified from rat toxicology studies (eg, NOAELs or BMDLs) to provide a scientific basis for estimates of safe human exposure levels for NTO.
Footnotes
Acknowledgments
We thank Nathan Gargas, Chet Gut, Kathy Frondorf, Angie Hulgan, and Antonio Brown for their assistance with this project.
Authors’ Note
The views expressed in this article are those of the authors and do not necessarily reflect the official policy or position of the Department of the Navy, Department of Defense, nor the US Government.The experiments reported herein were conducted in compliance with the Animal Welfare Act and in accordance with the principles set forth in the “Guide for the Care and Use of Laboratory Animals,” Institute of Laboratory Animal Resources, National Research Council, National Academy Press, 1996. The authors are contract employees or direct employees of the US Government. This work was prepared as part of their official duties. Title 17 U.S.C. §105 provides that ‘Copyright protection under this title is not available for any work of the United States Government.’ Title 17 U.S.C. §101 defines a US Government work as a work prepared by a military service member or employee of the US Government as part of that person’s official duties. Individuals with an interest in any of the underlying research materials (eg, model code) should contact Dr Sweeney, the corresponding author.
Author Contribution
Sweeney, L contributed to conception and design, contributed to analysis and interpretation, drafted manuscript, and critically revised the manuscript; Phillips, E contributed to acquisition and analysis, and drafted the manuscript; Goodwin, M contributed to design, contributed to acquisition and analysis, and drafted the manuscript; Bannon, D contributed to interpretation and critically revised the manuscript. All authors gave final approval and agree to be accountable for all aspects of work ensuring integrity and accuracy.
Declaration of Conflicting Interests
The author(s) declared no potential conflicts of interest with respect to the research, authorship, and/or publication of this article.
Funding
The author(s) disclosed receipt of the following financial support for the research, authorship, and/or publication of this article: This work was funded by the US Army Environmental Quality Technology, Ordnance Environmental Program through the Army Research, Development, Engineering Command, Environmental Sustainment Acquisition and Logistics Program through coordination with the Army Institute of Public Health, Toxicology Portfolio, and conducted under work unit number H1263.