
Abstract
1,1′-Methylenebis[4-[(hydroxyimino)methyl]-pyridinium] (MMB4) dimethanesulfonate (DMS) is a bisquaternary pyridinium aldoxime that reactivates acetylcholinesterase inhibited by organophosphorus nerve agent. Drug metabolism and plasma protein binding for MMB4 DMS were examined using various techniques and a wide range of species. When 14C-MMB4 DMS was incubated in liver microsomes, 4-pyridine aldoxime (4-PA) and an additional metabolite were detected in all species tested. Identity of the additional metabolite was postulated to be isonicotinic acid (INA) based on liquid chromatography with a tandem mass spectrometry analysis, which was confirmed by comparison with authentic INA. Formation of INA was dependent on species, with the highest level found in monkey liver microsomes. The MMB4 DMS exhibited reversible inhibition in a concentration-dependent manner toward cytochrome P450 1A2 (CYP1A2), CYP2C9, CYP2C19, CYP2D6, and CYP3A4 in human liver microsomes showing the highest inhibition for CYP2D6. Human recombinant CYPs were used to evaluate inhibitory curves more adequately and determine detailed kinetic constants for reversible inhibition and potential time-dependent inhibition (TDI). The MMB4 DMS exhibited reversible inhibition toward human-recombinant CYP2D6 with an inhibition constant (K i) value of 66.6 µmol/L. Based on the k inact/K I values, MMB4 DMS was found to exhibit the most potent TDI toward CYP2D6. The MMB4 DMS at 5 different concentrations was incubated in plasma for 5 hours using an equilibrium dialysis device. For all species tested, there were no concentration-dependent changes in plasma protein binding, ranging from 10% to 17%. These results suggest that MMB4 was not extensively bound to plasma protein, and there were no overt species-related differences in the extent of MMB4 bound to plasma protein.
Introduction
A dimethanesulfonate (DMS) salt of 1,1′-methylenebis[4-[(hydroxyimino)methyl]-pyridinium] (MMB4; see Figure 1) is being developed as a replacement for currently fielded 2-pralidoxime to treat military personnel when exposed to organophosphorus nerve agents. Oximes are used to reactivate acetylcholinesterase inhibited by organophosphorus nerve agent. Although MMB4 DMS has been tested in various preclinical species for its antidotal efficacy and safety evaluations, this study was designed to evaluate the dispositional characteristics of MMB4 such as metabolic fate and level of plasma protein binding for MMB4 DMS. Extensive metabolism and/or plasma protein binding affects not only the pharmacokinetic profiles of an investigational drug but also the pharmacodynamic end points, since these properties of a drug candidate can impact the extent of drug available at the pharmacological target. In addition, potential drug–drug interactions (DDIs) can occur if metabolism and/or plasma protein binding of the investigational drug are altered by other drugs that are administered concomitantly. Although the investigational drug is not extensively metabolized, it is important to evaluate whether the drug inhibits major metabolizing enzymes and thus decreases the metabolic clearance of other coadministered drugs that are metabolized by those enzymes. Significant DDIs can result in termination of drug development, refusal of approval from regulatory agencies, withdrawal of already approved drugs from the market, or severe restrictions on use of drugs. 1
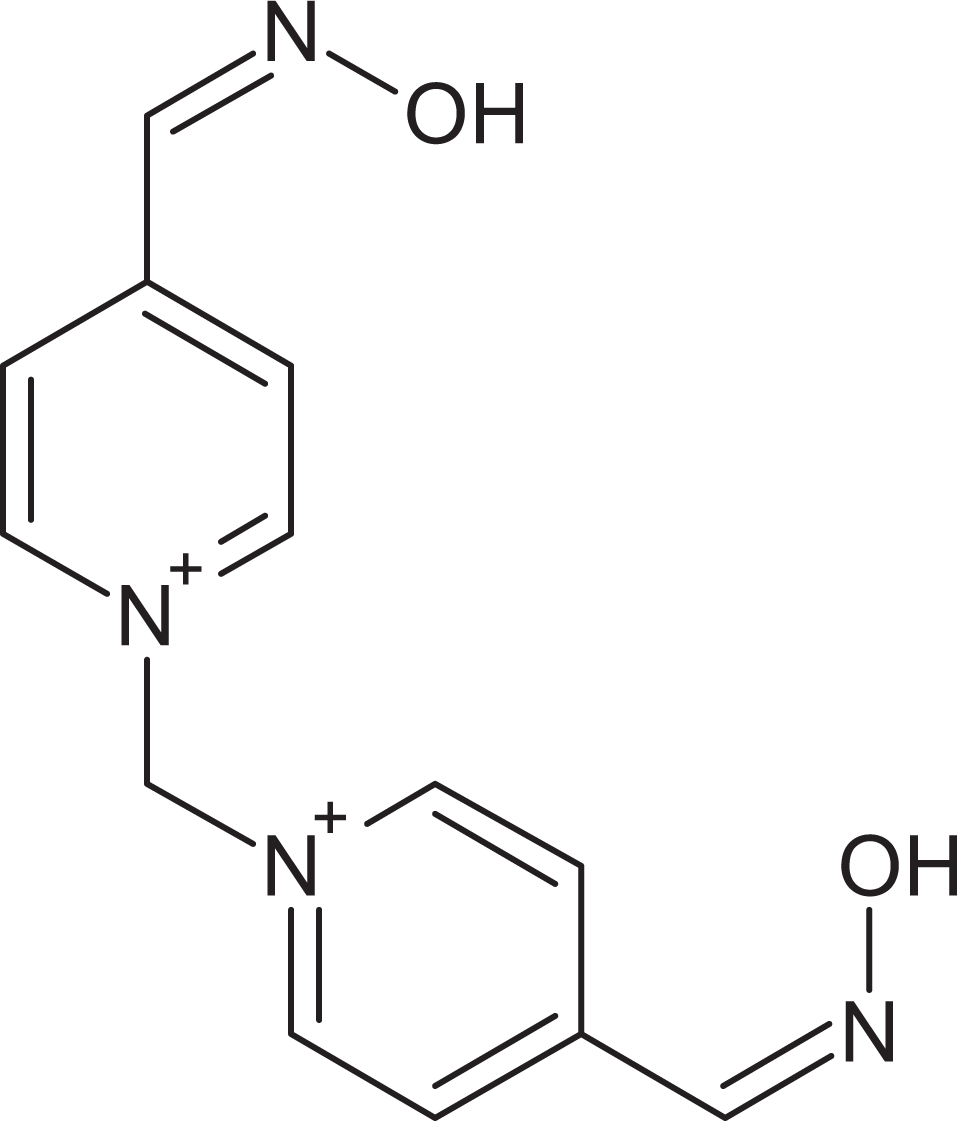
Chemical structure of MMB4.
A majority of marketed drugs are metabolized by the cytochrome P450 (CYP) enzyme superfamily. 2 Therefore, major CYP enzymes such as CYP1A2, CYP2C8, CYP2C9, CYP2C19, CYP2D6, and CYP3A4 are typically evaluated to identify enzymes responsible for the metabolism of an investigational drug. If the drug is not a substrate of CYP enzymes, involvement of other enzymes such as monoamine oxidase (MAO), flavin monooxygenase (FMO), xanthine oxidase, and aldehyde dehydrogenase should be examined. Several in vitro systems can be used in identifying enzymes involved in drug metabolism and also for the investigations of DDIs. Freshly isolated or cryopreserved hepatocytes contain all metabolizing enzymes and membrane barriers. Although hepatocytes may present relatively similar levels of complexity to those expected in vivo, there are limitations related to maintaining cell viability and enzyme activity. Liver microsomes contain those CYP enzymes, whereas liver S9 fractions include cytosolic enzymes in addition to microsomal enzymes. On the other hand, a recombinant enzyme system consists of a single CYP enzyme and thus presents the simplest tool to investigate mechanistic aspects of CYP-mediated metabolism.
The CYP enzyme inhibition can occur via a reversible, irreversible, or quasi-irreversible inhibition. Although the reversible inhibition takes place without a significant delay, the irreversible and quasi-irreversible inhibitions exhibit characteristics of time-dependent decrease in enzyme activity. The underlying mechanisms of irreversible inhibition include covalent binding of either parent drug molecule or metabolic intermediate to CYP enzyme, thereby inactivating the enzyme activity. A quasireversible inhibitor binds to the CYP enzyme so tightly, but not covalently, that it is practically bound to the enzyme irreversibly.
The current study has examined the metabolic profiles of MMB4 DMS and its inhibition toward major CYP enzymes using various in vitro models. In addition, the extent of plasma protein binding for MMB4 DMS was determined using a wide range of species.
Materials and Methods
Materials
Nonradiolabeled MMB4 DMS (98% purity) was supplied by Cambrex Charles City (Charles City, Iowa). The 14C-MMB4 DMS was supplied by Southwest Research Institute (San Antonio, Texas). The radiochemical purity, as determined by the supplier using proton-nuclear magnetic resonance ( 1 H-NMR) spectroscopy, was 100% (up to 1% error in NMR resolution). 4-Pyridine aldoxime (4-PA) and isonicotinic acid (INA) were purchased from Sigma (St Louis, Missouri). 14C-warfarin and 14C-acetaminophen were obtained from GE Healthcare UK Limited (Buckinghamshire, UK) and American Radiolabeled Chemicals, Inc (St Louis, Missouri), respectively. Sprague-Dawley male rat, Hartley Albino male guinea pig, New Zealand White male rabbit, Beagle male dog, African Green monkey, and male human plasma samples were purchased from Bioreclamation Inc (Hicksville, New York). Sprague-Dawley male rat, Hartley Albino male guinea pig, New Zealand White male rabbit, beagle male dog, cynomolgus monkey, and male human cryopreserved hepatocytes, microsomes, and liver S9 fractions were purchased from XenoTech, LLC (Lenexa, Kansas). No live animals were involved in this study. Ultima Gold scintillation cocktail was purchased from Perkin Elmer (Waltham, Massachusetts). All other chemicals and reagents used were the highest grade available and were purchased from Sigma or Fischer Scientific (Pittsburgh, Pennsylvania).
Hepatocytes Assays
The cryopreserved hepatocytes were thawed and isolated from the cryopreservation medium according to the procedures provided by the supplier. Cell viability was determined by the Trypan blue exclusion method using approximately 1 × 10⁶ cells/mL for all the incubations. The mixtures of radiolabeled and nonradiolabeled MMB4 DMS at different concentrations were incubated for 0 (control), 60, and 180 minutes. All the incubations were carried out on a rotary shaker set at 30 to 70 rpm in a humidified incubator (Thermo Fisher Scientific, Waltham, MA) at 37°C. Metabolic system competency samples with nonradiolabeled testosterone (100 µmol/L) were run along with hepatocytes for each species to demonstrate that the in vitro system was functional. In addition, intracellular amounts of adenosine 5′-triphosphate (ATP) were determined in the presence of MMB4 DMS to evaluate the effect of cellular functions on hepatocytes. Measurements of ATP in hepatocytes were performed using CellTiter-Glo Luminescent Assay kit (Promega Corporation, Madison, Wisconsin) according to the procedures provided by the supplier. Briefly, hepatocytes were plated in 96-well plates, treated with MMB4 DMS at 4 different concentrations (0, 10, 1000, and 2500 µg/mL) and incubated for 0 (control) and 180 minutes at 37°C. At the end of incubation, the plates were equilibrated to room temperature, and CellTiter-Glo-Glow reagent was added to each well. Following a short incubation at room temperature, the luminescent signal was measured using a plate reader (Beckman Coulter, Brea, California). The amounts of ATP in hepatocytes were determined by comparing the measured luminescence signals with a standard curve that related known amounts of ATP to luminescence signals.
Identification of Oxidative Enzymes Involved in MMB4 Metabolism
Rat, rabbit, monkey, and human liver microsomes (HLMs) and S9 fractions at 1 mg/mL protein concentration in a total volume of 500 µL of the incubation buffer (50 mmol/L phosphate buffer, 1 mmol/L EDTA, 10 mmol/L MgCl2) were incubated with MMB4 DMS (mixture of radiolabeled and nonradiolabeled MMB4 DMS with the final radioactivity concentration of approximately 2.3 µCi/mL) at final concentrations of 10 and 1000 µg/mL. Incubations were carried out for 180 minutes in a water bath maintained at 37°C under the conditions described in Table 1. The metabolic reactions were stopped by adding 100 µL of ice-cold acetonitrile, and the supernatants were analyzed by high-performance liquid chromatography (HPLC) with radiodetection.
Identification of Enzymes Involved in MMB4 Metabolism.
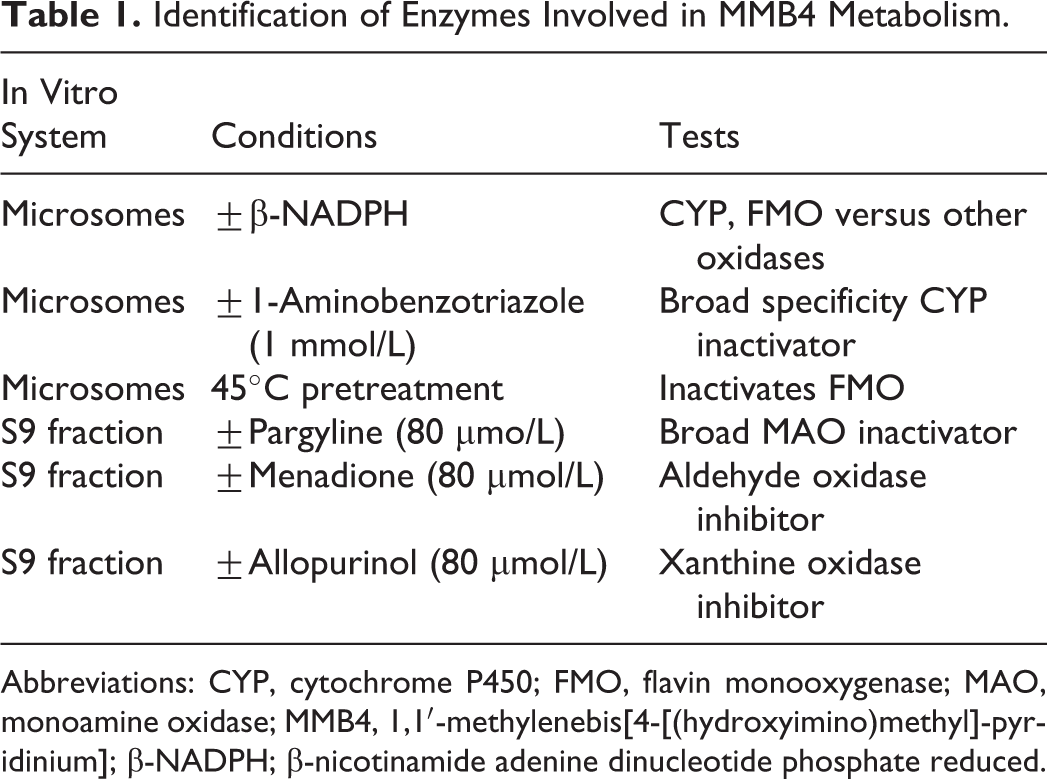
Abbreviations: CYP, cytochrome P450; FMO, flavin monooxygenase; MAO, monoamine oxidase; MMB4, 1,1′-methylenebis[4-[(hydroxyimino)methyl]-pyridinium]; β-NADPH; β-nicotinamide adenine dinucleotide phosphate reduced.
Postincubation mixtures were analyzed using a Waters system (Waters, Milford, Massachusetts) with Hydro-reversed phase (Hydro-RP) column (4 µm, 100 × 2.0 mm; Phenomenex, Torrance, California) at a flow rate of 0.2 or 0.3 mL/min and radiochemical detector (β-RAM Model 4; IN/US Systems, Inc, Tampa, Florida). The mobile phase consisted of 0.5% perfluoropentanoic acid in water (mobile phase A) and 0.1% acetic acid in acetonitrile (mobile phase B). The 80% of the mobile phase A was eluted for 2.5 minutes, followed by a linear gradient to 60% of the mobile phase B at 4.5 minutes and a linear gradient to 20% of the mobile phase B at 8.5 minutes, followed by an isocratic elution for 2.9 minutes and a continuous elution for 19 minutes. Identifications of metabolites were carried out using liquid chromatography with a tandem mass spectrometry (LC-MS/MS) system (Sciex API 4000Q; AB Sciex, Framingham, Massachusetts) with Turbo Spray in positive ion mode and Hydro-RP column (4 µm, 100 × 2.0 mm; Phenomenex). The same gradient scheme of mobile phases was used for LC-MS/MS analysis.
Inhibition of CYP Enzymes in HLMs by MMB4 DMS
The HLMs were treated with varying concentrations of MMB4 DMS and the probe substrate cocktail in a total volume of 0.5 mL of incubation medium (50 mmol/L potassium buffer, pH 7.4; 10 mmol/L MgCl2). The substrate cocktail contained 6 CYP-specific substrates: 1.25 µmol/L midazolam (CYP3A4), 5 µmol/L bufuralol (CYP2D6), 2 µmol/L diclofenac (CYP2C9), 1 µmol/L ethoxyresorufin (CYP1A2), 40 µmol/L S-mephenytoin (CYP2C19), and 10 µmol/L paclitaxel (CYP2C8). All the incubation mixtures were preincubated for 5 minutes at 37°C in a shaking water bath for evaluation of reversible inhibition. The metabolic reactions were initiated by adding β-nicotinamide adenine dinucleotide phosphate reduced (β-NADPH) to the incubation mixture at a final concentration of 2 mmol/L. Incubations were carried out for up to 20 minutes and terminated by adding 0.25 mL of ice-cold acetonitrile. The resulting samples were centrifuged at 3000 rpm for 10 minutes at 4°C. The supernatants were subjected to LC-MS/MS analysis. To evaluate time-dependent inhibition (TDI), HLMs were preincubated with MMB4 DMS at varying concentrations with or without 1 mmol/L β-NADPH for 30 minutes. Subsequently, a 50-µL aliquot from each preincubation medium was transferred to a new tube and was incubated in the presence of 1 mmol/L β-NADPH, potassium buffer, and the probe substrate cocktail in the total volume of 0.5 mL for additional 20 minutes. The secondary incubations were terminated by adding 0.25 mL of ice-cold acetonitrile. Samples were centrifuged at 3000 rpm for 10 minutes at 4°C. The supernatants were subjected to LC-MS/MS analysis.
As described by Atkinson et al, 3 the percentage of TDI for each CYP was calculated according to the following equation:

where R + I + N is the rate of CYP-specific metabolite formation when the preincubation is performed in the presence of inhibitor (MMB4 DMS) and β-NADPH, R + N is the rate of CYP-specific metabolite formation when the preincubation is performed in the absence of inhibitor but in the presence of β-NADPH, R + I – N is the rate of CYP-specific metabolite formation when the preincubation is performed in the presence of inhibitor but in the absence of β-NADPH, and R − N is the rate of CYP-specific metabolite formation when the preincubation is performed in the absence of inhibitor and β-NADPH.
The LC-MS/MS method for simultaneous analysis of 6 CYP-specific metabolites was based on the method described by Dierks et al. 4 The LC-MS/MS analysis was carried out using an Agilent 1200 (Agilent, Santa Clara, California) HPLC system coupled to AB Sciex 4000 Q-Trap mass spectrometry system (AB Sciex) with atmospheric pressure chemical ionization ion source operating in the positive ion mode. The CYP-specific metabolites were separated on a Gemini NX column (5 µm, 50 × 2.0 mm; Phenomenex) at 45°C by a gradient solvent system consisting of 0.1% formic acid in water (mobile phase A) and 0.1% formic acid in acetonitrile (mobile phase B). The percentage of mobile phase B was increased from 2% to 95% over the course of 3.8 minutes followed by isocratic elution for 0.7 minutes (95% mobile phase B). The percentage of acetonitrile was then decreased from 95% to 2% over the course of 0.2 minutes followed by isocratic elution for 2.3 minutes. Multiple reactions monitoring was used to measure the amounts of CYP-specific metabolites.
Inhibition of Human Recombinant CYP Enzymes by MMB4 DMS
Inhibition of CYPs by MMB4 DMS was also evaluated using human recombinant CYP enzymes, P450-Glo Assays (Promega Corporation) with CYP-specific luminogenic substrates (derivatives of beetle luciferin), and luciferin detection reagent. The P450-Glo substrates were converted by CYP enzymes into a luciferin product that reacted with luciferin detection reagent to produce light. The intensity of light produced was proportional to the amount of luciferin produced and CYP enzyme activity. A glow-type luminescent signal was recorded using a luminometer (Beckman Coulter), and luminescence values were recorded as relative light units. All assays were performed according to the procedures provided by Promega. Briefly, a human recombinant CYP enzyme and its substrate were mixed in potassium buffer with or without MMB4 DMS, and the reaction was initiated by the addition of β-NADPH. All incubations were carried at 37°C for 30 minutes. At the end of incubation, 50 µL of reconstituted luciferin detection reagent was added. The signals were allowed to stabilize for 20 minutes at room temperature before reading luminescence. The inhibitory curves were analyzed using Prism (GraphPad, San Diego, California) to calculate the half maximal inhibitory concentration (IC50) and inhibition constant (K i) values.
For the evaluation of TDI, each human recombinant CYP enzyme was first preincubated with MMB4 DMS in the presence or absence of β-NADPH. Each preincubation was followed by 1:10 dilution and a subsequent incubation with β-NADPH and CYP-specific substrate for 30 minutes. Multiple concentrations of MMB4 DMS and multiple preincubation times were tested for the determination of k inact (maximal inactivation rate constant) and K I (inactivator concentration when half of the maximal rate of enzyme inactivation was achieved). A ratio of k inact to K I represents the efficiency of TDI by an inhibitor. 3 Prism (GraphPad) was used for the calculations of kinetic constants.
Plasma Protein Binding
Plasma protein binding was determined using a 96-well Equilibrium Dialyzer (Harvard Apparatus, Holliston, Massachusetts) with cellulose membranes (10 kDa molecular weight cutoff). A 150-µL aliquot of phosphate-buffered saline (PBS) was added to one side of the membrane in each well and an equal volume of 14C-MMB4 DMS-spiked plasma to the well on the other side of the membrane. Three replicates of each tested MMB4 DMS concentration in each tested species plasma as well as the assay control samples were dialyzed at 37°C. The assay control samples were prepared by spiking human plasma with a mixture of radiolabeled and nonradiolabeled acetaminophen (low plasma-binding control) or warfarin (high plasma-binding control) at a final concentration of 5 µmol/L. At the end of each dialysis, 25-µL aliquots from the buffer and plasma halves of each dialysis cell were transferred to scintillation vials. Samples were analyzed using liquid scintillation counting using a scintillation counter (Beckman Coulter). The unbound fraction (free fraction) of MMB4 DMS was determined by dividing the 14C-MMB4 DMS concentration (expressed in disintegrations per minute, or dpm/mL) in the postincubation buffer by the 14C-MMB4 DMS concentration (expressed in dpm/mL) in the postincubation plasma. The percentage of MMB4 DMS that was plasma protein bound was calculated as follows:

Results
Radiopurity of 14C-MMB4 DMS and Competency of Hepatocytes
The radiochemical purity of 14C-MMB4 DMS was determined to be higher than 96%, while the major impurity (2.2%) was identified as 14C-4-PA (Figure 2). Based on the Trypan blue exclusion method, the cell viability of cryopreserved hepatocytes for rat, guinea pig, rabbit, dog, monkey, and human was found to be 79%, 62%, 63%, 74%, 80%, and 63%, respectively. The hepatocyte viability was found to be greater than 90% of the preincubation levels after incubation with MMB4 DMS at 1500 µg/mL concentration for 3 hours. Additionally, the intracellular ATP levels in rabbit hepatocytes were measured after incubations with MMB4 DMS at 10, 1000, and 2500 µg/mL for 3 hours. Although the intracellular concentration of ATP was not changed by 10 µg/mL of MMB4 DMS (94% of control), there were concentration-dependent decreases in the intracellular ATP concentrations at 1000 and 2500 µg/mL (39% and 11% of control, respectively).
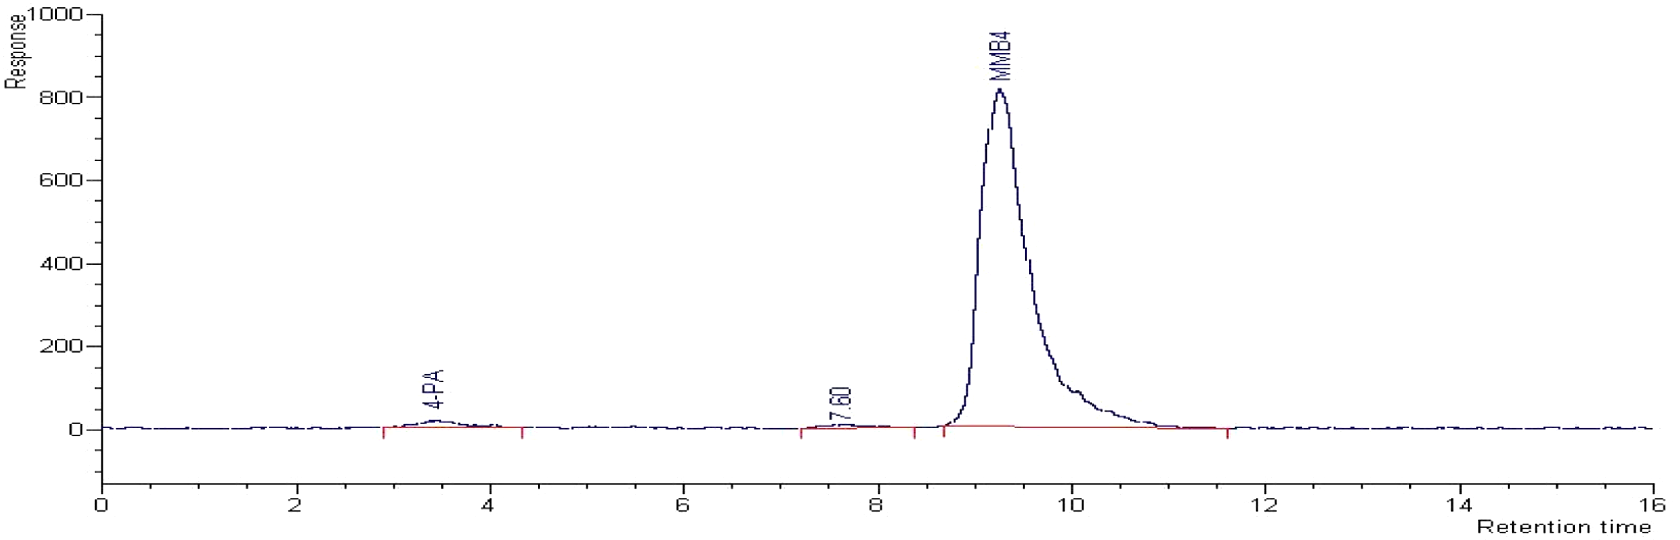
Radiochromatogram of C14-MMB4 DMS.
Metabolic Profiles in Liver Microsomes
The postincubation mixture of MMB4 DMS at 10 µg/mL concentration in rat liver microsomes revealed 3 peaks in the radiochromatogram at retention times of approximately 2, 4, and 10 minutes (Figure 3). The largest peak represented MMB4 based on the retention times compared with the authentic MMB4 standard. Of the 2 metabolites found in the postincubation mixtures of MMB4 DMS, 1 was 4-PA that was confirmed by comparisons of retention time on the radiochromatograms (approximately 4 minutes) and mass (124 m/z) against the authentic 4-PA standard. The identity of another metabolite with the retention time of approximately 2 minutes was determined to be INA based on the LC-MS/MS data and comparison with the authentic INA standard. The new metabolite peak in rat, rabbit, monkey, and human liver microsomal postincubation mixtures had retention time and product ion signal (124 > 96 m/z) equivalent to an authentic standard of INA (Figure 4).
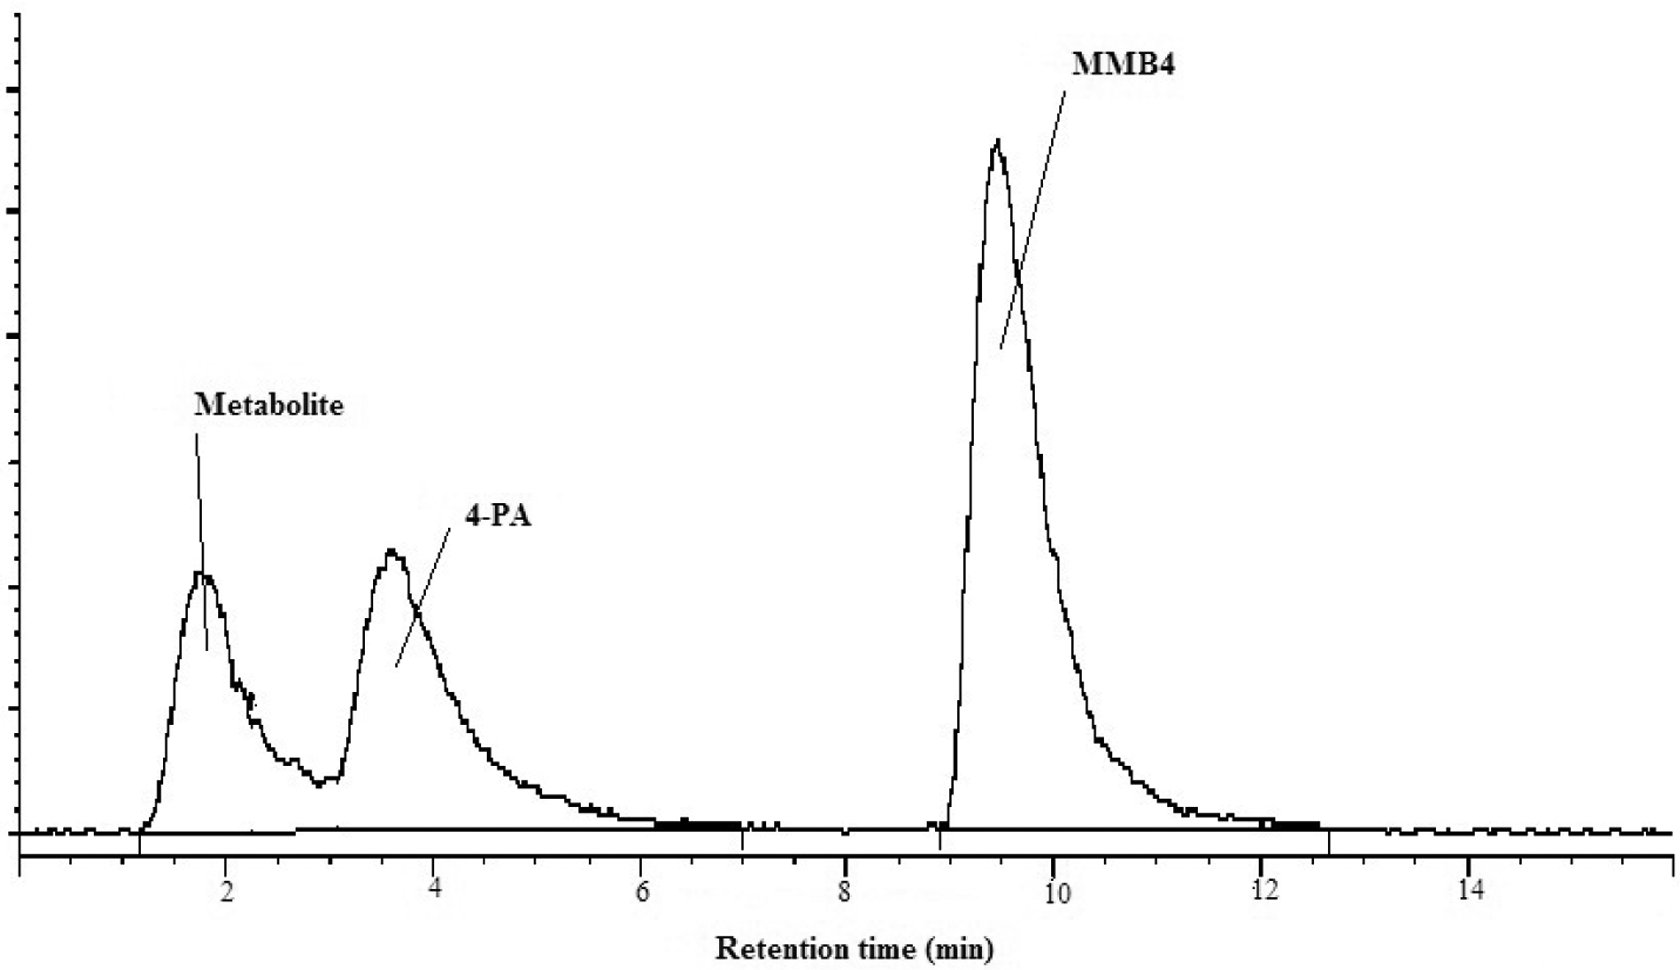
Radiochromatogram of postincubation mixtures of rat liver microsomes and MMB4 DMS at 10 µg/mL concentration for 180 minutes.
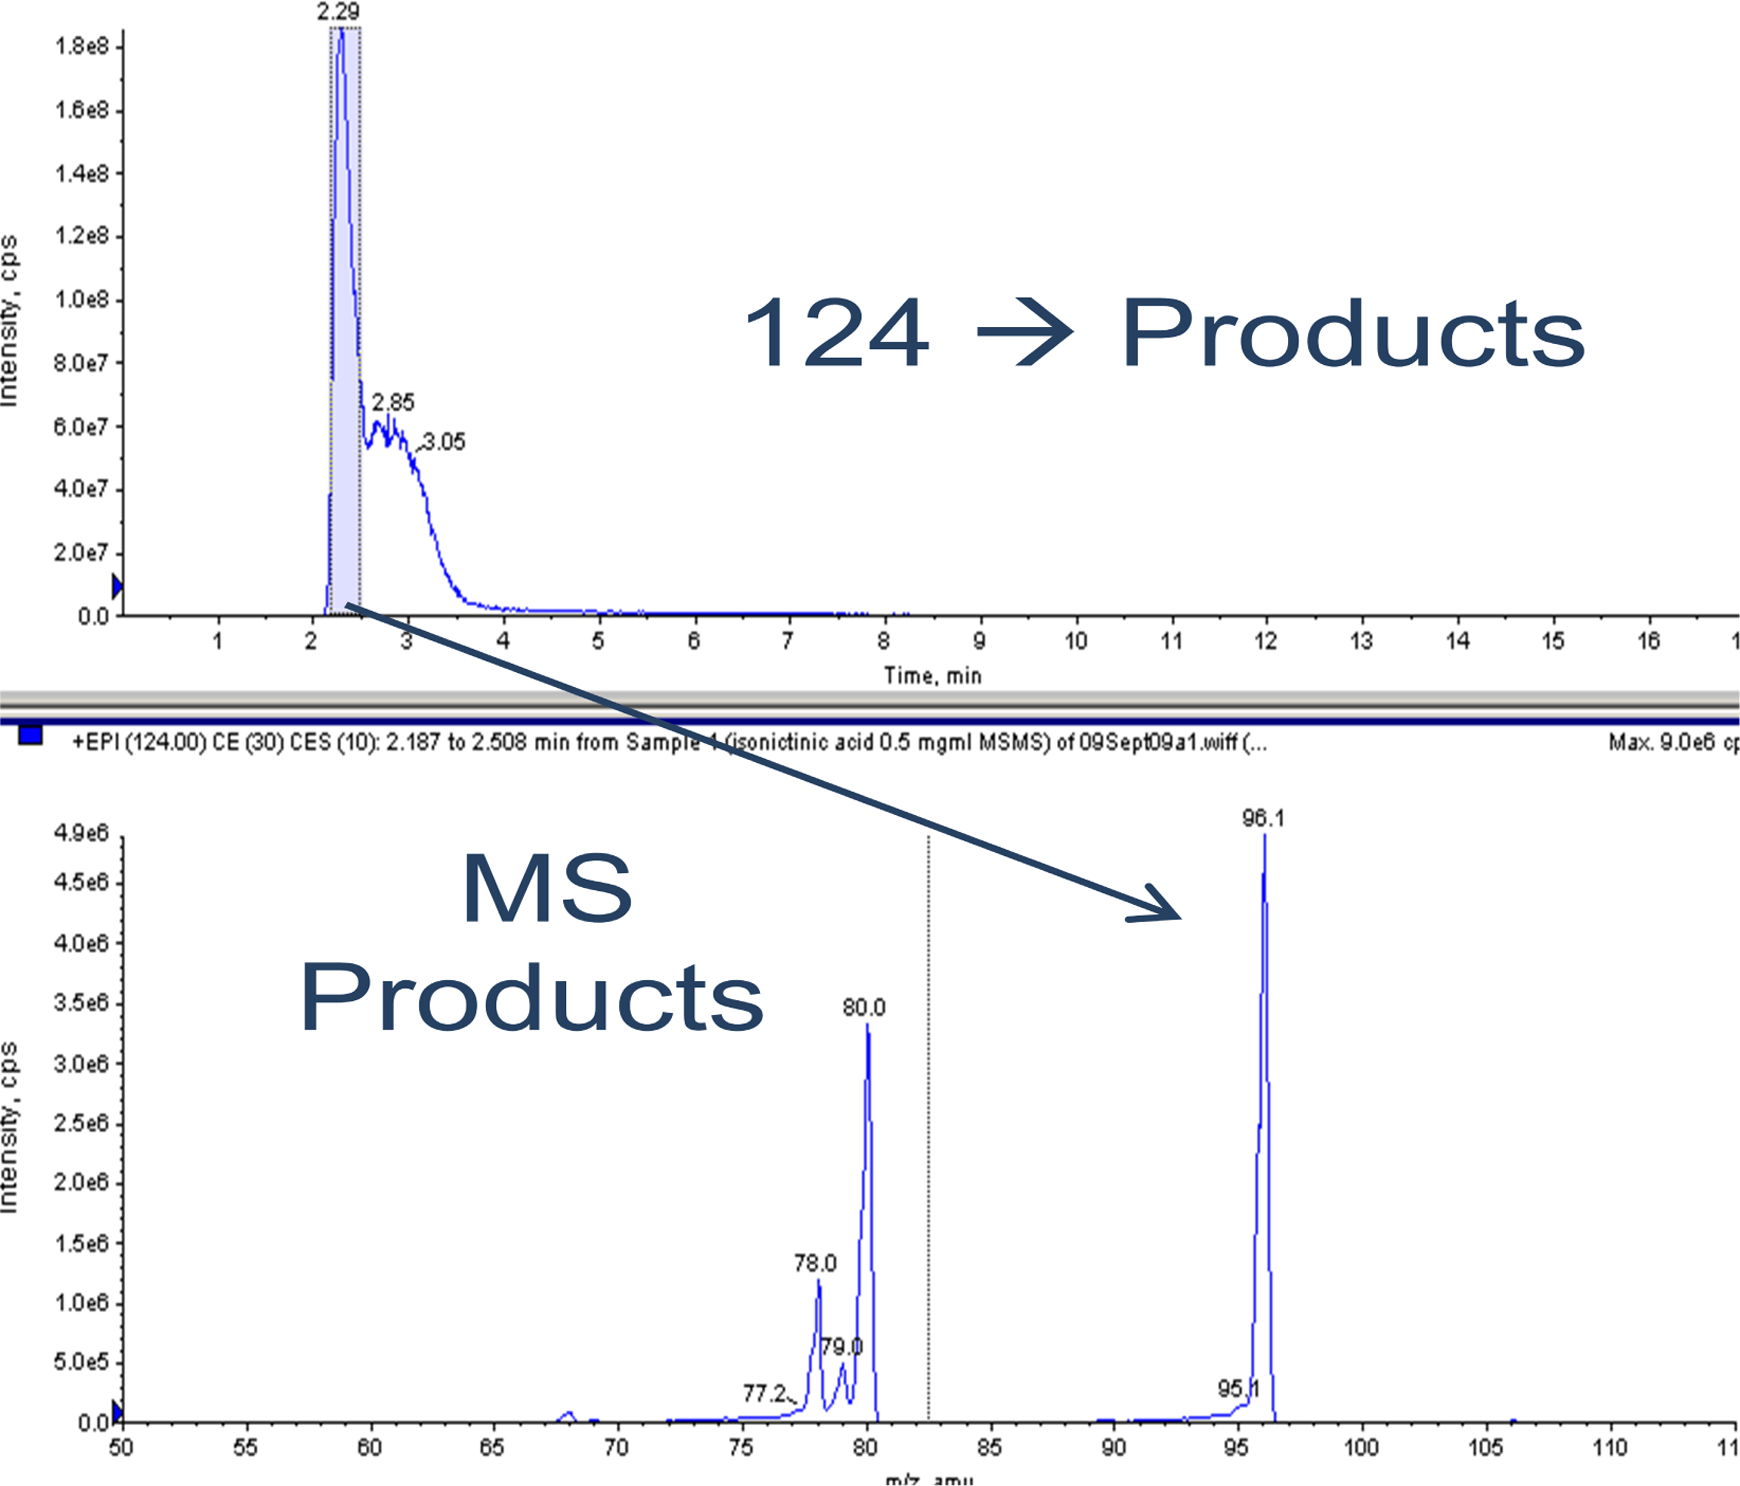
Full-scan liquid chromatography with a tandem mass spectrometry (LC-MS/MS) chromatogram of isonicotinic acid.
From each radiochromatographic profile, the amounts of MMB4, 4-PA, and INA after the 3-hour incubation of MMB4 DMS at 10 µg mL in liver microsomes were calculated as a percentage of the total radioactivity (Table 2). The remaining amounts of MMB4 in the postincubation mixtures ranged from 37.5% to 64.5%, with the smallest amount found in monkey liver microsomes and the largest in rabbit liver microsomes. The amounts of 4-PA formed in the postincubation mixtures of rat, rabbit, monkey, and HLMs were comparable (27.5% to 32.2%). The amounts of INA ranged from 5.50% to 22.3% and were inversely correlated with the amounts of remaining MMB4 (ie, monkey > human > rat > rabbit). For all species tested in this study, more than 92% of the total radioactivity was accounted for by MMB4, 4-PA, and INA after incubation for 3 hours.
Distribution of Radioactivity After 3-Hour Incubation of MMB4 DMS at 10 µg/mL in Liver Microsomes.
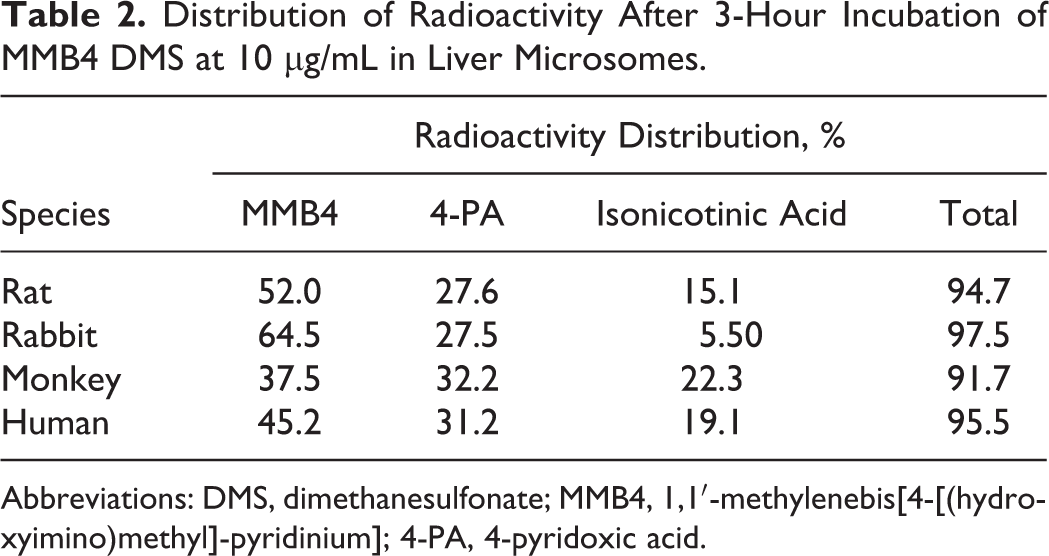
Abbreviations: DMS, dimethanesulfonate; MMB4, 1,1′-methylenebis[4-[(hydroxyimino)methyl]-pyridinium]; 4-PA, 4-pyridoxic acid.
Identification of Enzymes Involved in MMB4 Metabolism
Metabolic profiles were examined after MMB4 DMS was incubated at concentrations of 10 and 1000 µg/mL concentrations in rat, rabbit, monkey, and HLMs in the presence or absence of β-NADPH, 1-aminobenzotriazole (1-ABT), or heat inactivation. In addition, rat, rabbit, monkey, and human liver S9 fractions were incubated with MMB4 DMS at 10 and 1000 µg/mL concentrations in the presence or absence of pargyline, menadione, or allopurinol.
The percentage changes in the amounts of MMB4, 4-PA, and INA after the 3-hour incubation, when compared to the preincubation levels, in the presence or absence of β-NADPH were calculated (Supplementary Table 1). By excluding β-NADPH from the incubation medium, smaller amounts of MMB4 were detected after the 3-hour incubation except for 1000 µg/mL MMB4 DMS in rat microsomes and 10 µg/mL MMB4 DMS in rabbit microsomes. In general, there were small to no differences in the amounts of 4-PA formed after 3 hours upon the exclusion of β-NADPH from the incubation medium. Although the amount of 4-PA increased in rat microsomes incubated with 1000 µg/mL of MMB4 DMS and rabbit microsomes incubated with 10 µg/mL of MMB4 DMS, it decreased in rabbit microsomes incubated with 1000 µg/mL MMB4 DMS and human microsomes incubated with 1000 µg/mL MMB4 DMS. For rat, monkey, and human microsomes incubated with MMB4 DMS at 10 µg/mL concentration, the amounts of INA in the presence of β-NADPH were approximately 22- to 29-folds higher than those in the absence of β-NADPH. On the other hand, for rabbit microsomes, there was a minimal change in INA formation by excluding β-NADPH from the incubation medium with MMB4 DMS at 10 µg/mL concentration.
There were generally minimal differences in the amounts of MMB4, 4-PA, and INA after the 3-hour incubations in the presence of 1-ABT when compared to those in the absence of 1-ABT (Supplementary Table 2). In the monkey microsomes incubated with 10 µg/mL MMB4 DMS, the addition of 1-ABT in the incubation medium resulted in more MMB4 (from –31% to –18%) and less 4-PA (15% to 9%) and INA (12% to 6%). However, this trend was not observed in monkey microsomes incubated with MMB4 DMS at 1000 µg/mL concentration.
In general, there were no apparent differences in the amounts of MMB4, 4-PA, and INA after the 3-hour incubations between active and heat-inactivated microsomes (Supplementary Table 3). Although the amount of INA decreased in rat heat-inactivated microsomes incubated with MMB4 DMS at 10 µg/mL concentration (2% vs 5% in control microsomes), there was no such difference at 1000 µg/mL concentration.
There were no overt differences in the amounts of MMB4, 4-PA, and INA after the 3-hour incubations with MMB4 DMS at 10 µg/mL concentration in the presence of pargyline in liver S9 fractions when compared to those in the absence of pargyline (Supplementary Table 4). In addition, experimental results with MMB4 DMS at 1000 µg/mL concentration were very similar to those with 10 µg/mL MMB4 DMS.
Except for monkey liver S9 fractions, very few differences were observed in the amounts of MMB4, 4-PA, and INA after the 3-hour incubations with MMB4 DMS at 10 µg/mL concentration in the presence of menadione in liver S9 fractions when compared to those in the absence of menadione (Supplementary Table 5). The monkey liver S9 fraction showed a lower amount of MMB4 and higher amounts of 4-PA and INA in the presence of menadione after the 3-hour incubations. Results obtained with MMD4 DMS at 1000 µg/mL concentration were very similar for rat, rabbit, and human liver S9 fractions. As opposed to the results with MMB4 DMS at 10 µg/mL concentration, there were no differences in the amounts of MMB4, 4-PA, and INA in monkey S9 fractions with MMD4 DMS at 1000 µg/mL concentration.
There were minimal differences in the amounts of MMB4, 4-PA, and INA after the 3-hour incubations with MMB4 DMS at 10 µg/mL concentration in the presence of allopurinol in liver S9 fractions when compared to those in the absence of allopurinol (Supplementary Table 6). In addition, experimental results with MMB4 DMS at 1000 µg/mL concentration were very similar to those with 10 µg/mL MMB4 DMS.
Inhibition of CYP Enzymes in HLMs by MMB4 DMS
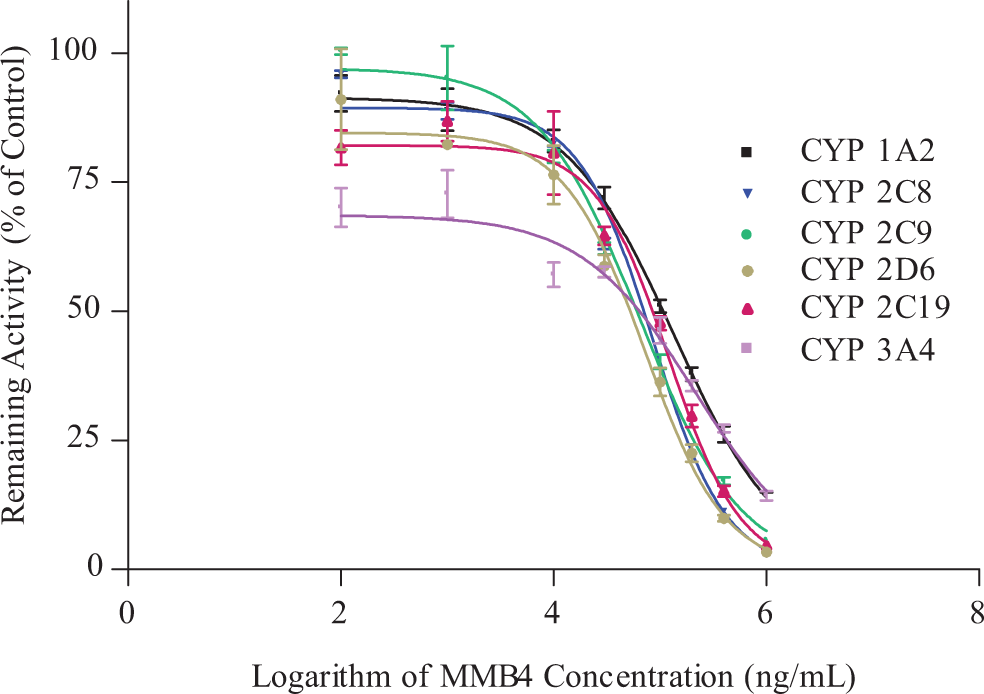
The MMB4 DMS reduced the functional activity of CYP1A2, CYP2C9, CYP2C19, CYP2D6, and CYP3A4 in HLMs, as determined by the changes in the amounts of specific substrates for individual CYPs, in a concentration-dependent manner (Figure 5). There was little to no inhibition of these CYPs in the presence of MMB4 DMS at the lowest concentration tested (ie, 5 µg/mL). At the highest concentration of MMB4 DMS tested (100 µg/mL), the functional activity of CYP3A4 and CYP2C9 was approximately 75% of baseline activity, while CYP1A2 and CYP2C19 showed approximately 60% of baseline activity. The CYP2D6 was inhibited by approximately 50% in the presence of MMB4 DMS at 100 µg/mL concentration. There was no coherent trend of concentration dependence on the changes in the functional activity of CYP2C8 in the presence of MMB4 DMS. The IC50 of MMB4 DMS for CYP2D6 was calculated to be approximately 99.3 µg/mL or 385 µmol/L based on a linear interpolation as described by Dierks et al. 4 The IC50 values for CYP3A4, CYP2C9, CYP1A2, and CYP2C19 were not calculated, because the remaining activities for these enzymes in HLM at the highest MMB4 DMS concentration of 100 µg/mL were above 50% (ranging from 58.6% to 75.4%).
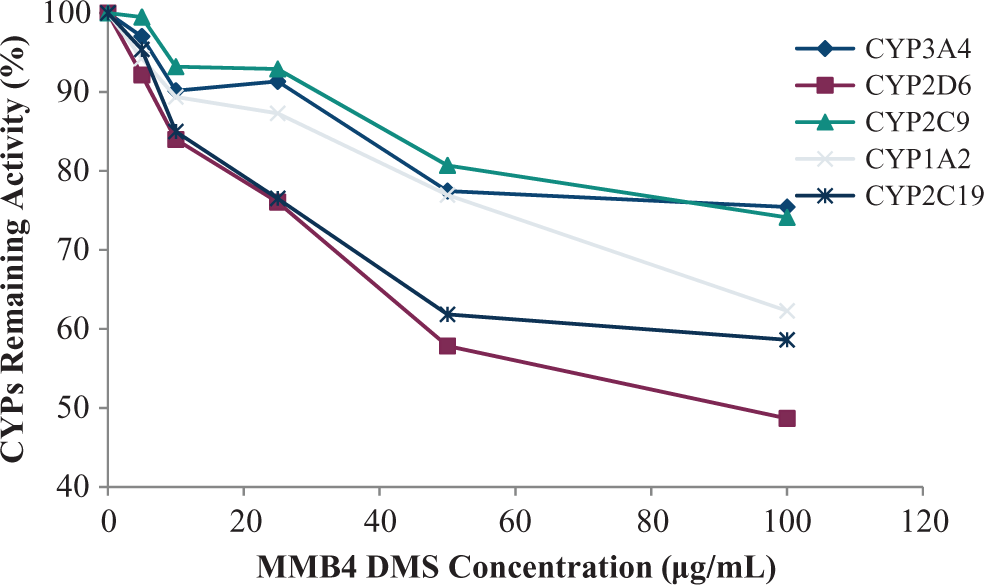
Concentration-dependent inhibition of CYP1A2, 2C9, 2C19, 2D6, and 3A4 in HLM by MMB4 DMS.
The TDI of CYPs was evaluated by initial 30-minute preincubation of MMB4 DMS with HLM in the presence or absence of β-NADPH followed by 10-fold dilution prior to measuring functional activities of CYPs (Table 3). For CYP3A4, CYP2C9, and CYP2C8, formations of respective metabolites (ie, 1′-hydroxymidazolam, 4′-hydroxydiclofenac, and 6α-hydroxypaclitaxel) were quantifiable in the postincubation mixtures. However, the amounts of metabolites for CYP2D6, CYP2C19, and CYP1A2 (1′-hydroxybufuralol, 4′-hydroxymephenytoin, and resorufin) were below the limit of quantitation and were therefore extrapolated from their respective calibration curves. The MMB4 DMS at the lowest concentration tested (5 µg/mL) did not cause any substantial TDI for CYP3A4 and CYP2C9, as approximately 7% of TDI was observed for these CYP enzymes. There was a trend toward increasing TDI for CYP3A4 and CYP2C9 with increasing concentrations of MMB4 DMS, with approximately 39% and 36% TDI observed at the highest concentration of MMB4 DMS (100 µg/mL). Although MMB4 DMS caused approximately 22% TDI of CYP2C8 at the lowest concentration (5 µg/mL), there was no concentration dependence in the extent of TDI for CYP2C8 across the concentrations of MMB4 DMS tested in this study. For CYP2D6, CYP2C19, and CYP1A2, variable degrees of TDI ranging from 1.8% to 51% without any coherent patterns were observed. However, these results should be taken with a great caution, since these metabolites were below the limit of quantitation.
Time-Dependent Inhibition (TDI) of CYP Enzymes in HLM by MMB4 DMS.
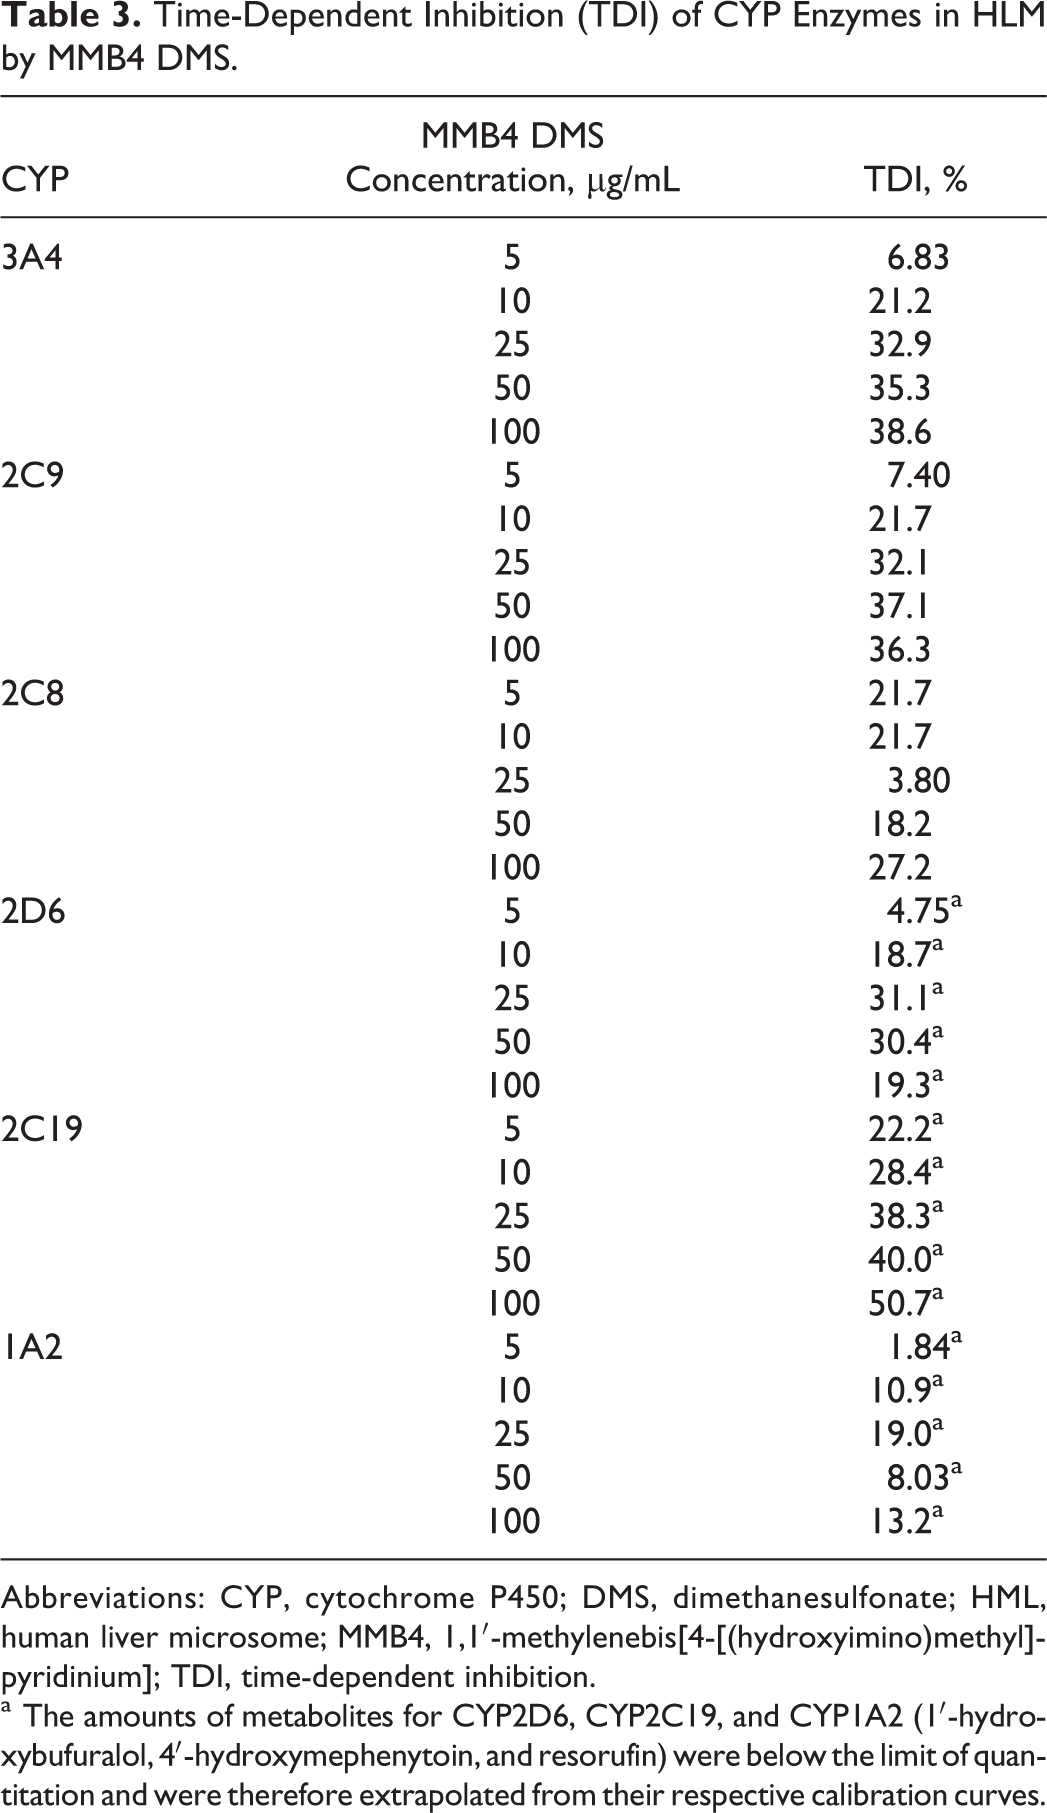
Abbreviations: CYP, cytochrome P450; DMS, dimethanesulfonate; HML, human liver microsome; MMB4, 1,1′-methylenebis[4-[(hydroxyimino)methyl]-pyridinium]; TDI, time-dependent inhibition.
a The amounts of metabolites for CYP2D6, CYP2C19, and CYP1A2 (1′-hydroxybufuralol, 4′-hydroxymephenytoin, and resorufin) were below the limit of quantitation and were therefore extrapolated from their respective calibration curves.
Inhibition of Human-Recombinant CYP Enzymes by MMB4 DMS
For all CYP isoforms tested in this study, there were concentration-dependent inhibitions of human recombinant CYP enzymes by MMB4 DMS, as determined by the changes in the amounts of specific substrates for individual CYPs (Figure 6). The MMB4 DMS showed more potent inhibition for human recombinant CYP2C8 and CYP2D6 with IC50 values of 82.9 and 80.6 µmol/L, respectively. Human recombinant CYP2C9 and CYP2C19 were moderately inhibited by MMB4 DMS with IC50 values of 228 and 170 µmol/L, respectively. Human recombinant CYP1A2 and CYP3A4 were least inhibited by MMB4 DMS with IC50 values of 517 and 834 µmol/L, respectively. The metabolic reaction rates were determined at different concentrations of each CYP-specific substrate over a wide range of MMB4 DMS concentrations (see Figure 7 for CYP1A2 metabolic profiles). The K i values were calculated by nonlinear regression for each CYP enzyme, and it was found that a noncompetitive type of reversible inhibition showed the best fit to the experimental data (Table 4). Among CYP enzymes tested in this study, CYP2D6 was mostly inhibited by MMB4 DMS with a K i value of 66.6 µmol/L followed by CYP2C8, CYP2C19, and CYP2C9 that showed K i values of 126, 146, and 242 µmol/L, respectively. K i values for CYP1A2 and CYP3A4 were larger than other CYP enzymes (627 and 1250 µmol/L, respectively).
Concentration-dependent inhibition of human recombinant cytochrome CYP enzymes by MMB4 DMS.
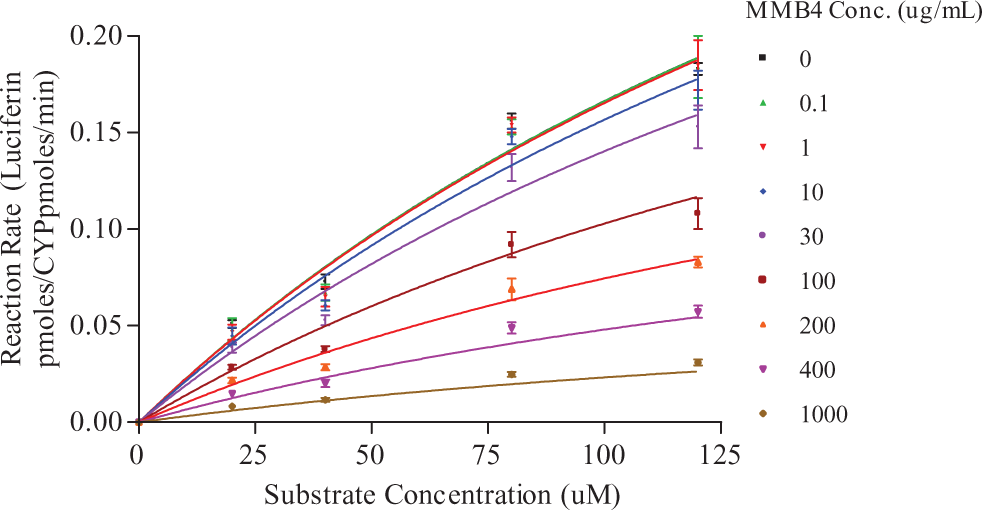
Metabolic reaction rates of CYP1A2 at different concentrations of substrate and MMB4 DMS.
Reversible Inhibition of Human-Recombinant CYP Enzymes by MMB4 DMS: Inhibition Constant (K i) Values.
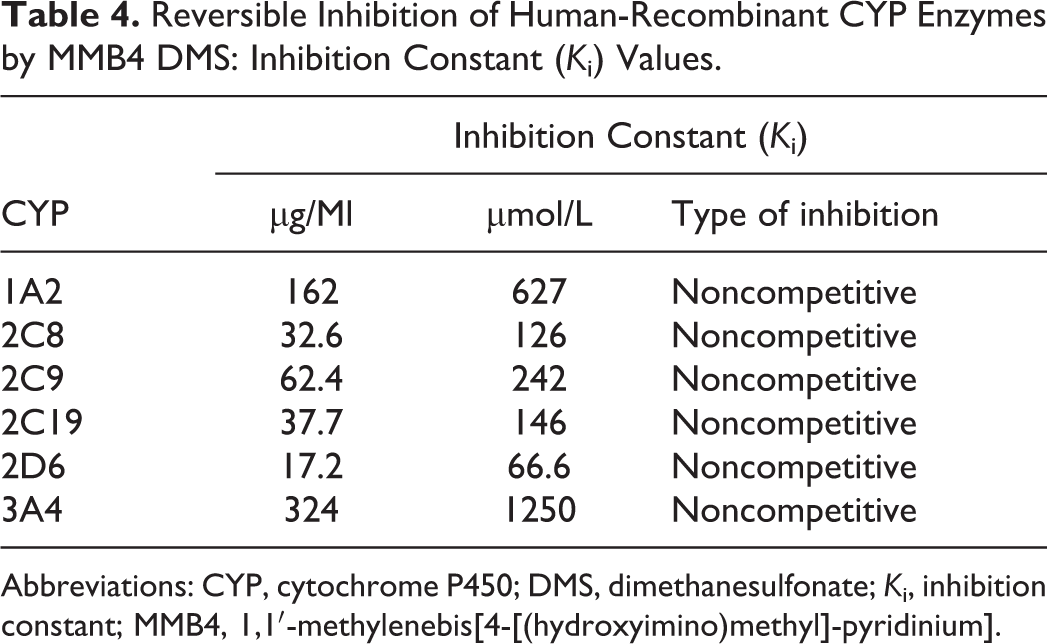
Abbreviations: CYP, cytochrome P450; DMS, dimethanesulfonate; K i, inhibition constant; MMB4, 1,1′-methylenebis[4-[(hydroxyimino)methyl]-pyridinium].
In order to identify human recombinant CYP enzymes for more detailed characterization of TDI (ie, determinations of k inact and K I), the inhibitory curves for each of the preincubation conditions (ie, with or without β-NADPH) were evaluated for any discernible shifts between the 2 profiles (see Figure 8 for CYP2C19 profiles). Apparent shifts in the inhibitory curves were observed for CYP2C9, CYP2C19, CYP2D6, and CYP3A4, which indicated time-dependent inactivation of these enzymes by MMB4 DMS. On the other hand, there was no shift in CYP2C8 inhibitory curves, suggesting that MMB4 DMS is not a time-dependent inhibitor of CYP2C8. The evaluation for CYP1A2 was not successful, suggesting that the fluorogenic assay was not suitable for the assessment of TDI for CYP1A2. Based on these results, CYP2C9, CYP2C19, CYP2D6, and CYP3A4 were further tested to determine k inact and K I values. The MMB4 DMS over a wide range of concentrations (0, 0.1, 1, 10, 100, 200, 400, 800, and 1000 µg/mL) was incubated with human recombinant CYP2C9, CYP2C19, CYP2D6, and CYP3A4 after 6 different preincubation times (0, 5, 10, 15, 20, 25, and 30 minutes). The natural logarithm of the remaining enzyme activity after incubation with MMB4 DMS at each concentration was plotted against the preincubation time in order to determine k obs (ie, slopes of the curves) values. The negative slopes (ie, −k obs values) against MMB4 concentration were analyzed by nonlinear analysis to calculate k inact and K I values (see Figure 9 for CYP2C9 profiles) according to a method described by Atkinson et al. 3 The k inact value was lowest with CYP2D6 (0.0526/min), while the other enzymes showed comparable values ranging from 0.141 to 0.176/min (Table 5). The K I value was lowest with CYP2D6 (19.2 µmol/L) followed by CYP2C19 and CYP2C9 (557 and 857 µmol/L), while CYP3A4 showed the highest K I value (1480 µmol/L). The MMB4 DMS showed the highest k inact/K I value for CYP2D6 (2.73 mL/min/µmol) followed by CYP2C19, CYP2C9, and CYP3A4 (0.292, 0.201, and 0.0953 mL/min/µmol, respectively).
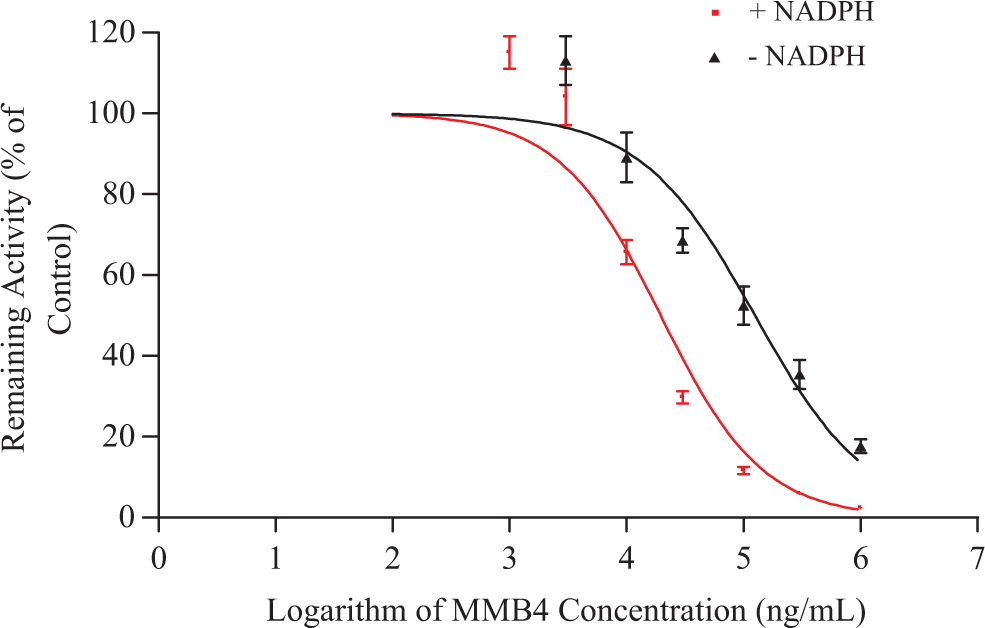
MMB4 inhibitory curves of CYP2C19 determined after preincubation with or without β-NADPH.
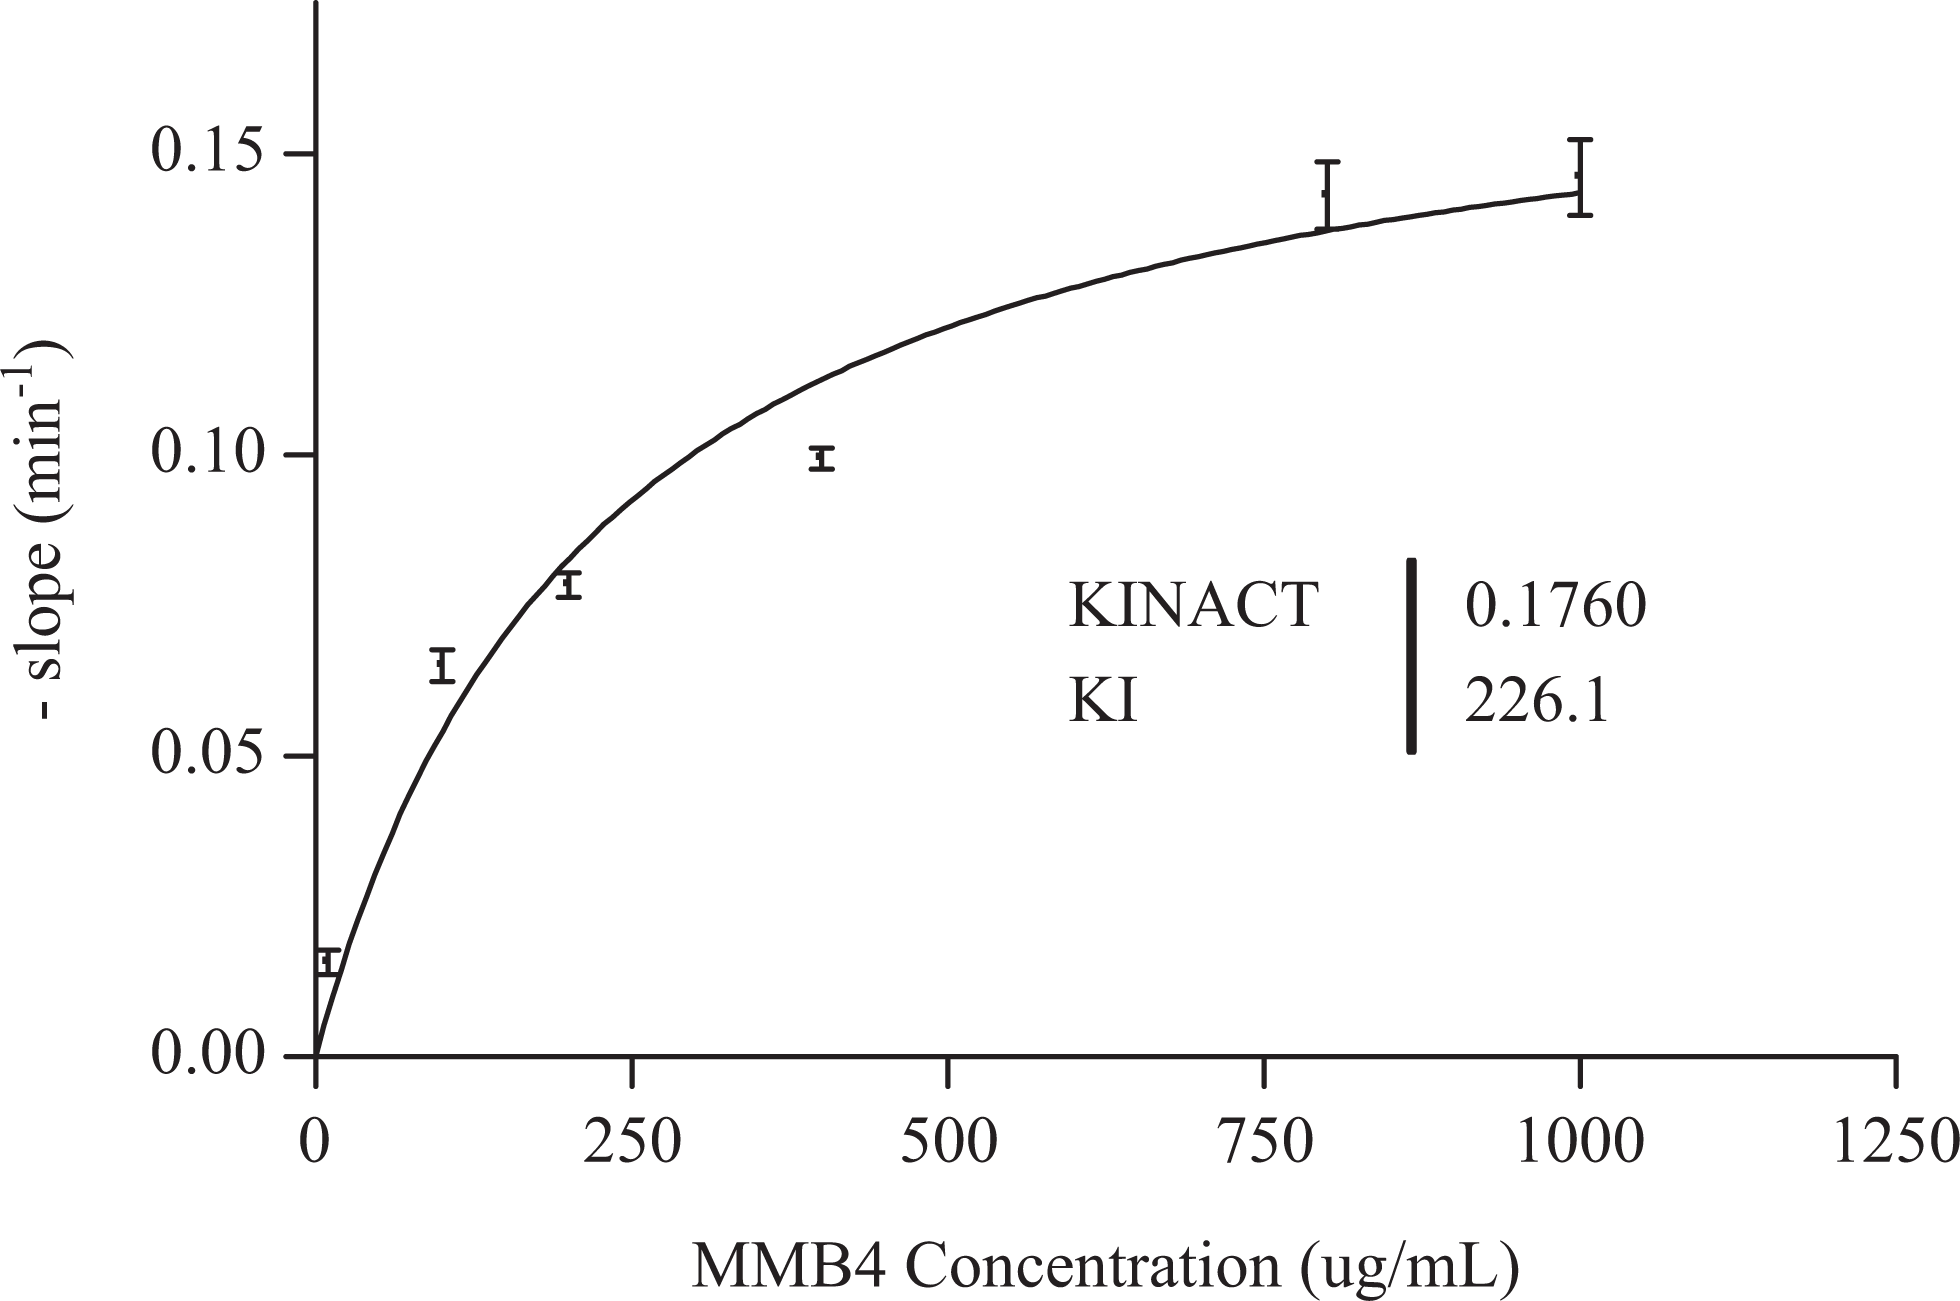
Relationship between MMB4 concentrations and negative Kobs. k inact represents maximal inactivation rate constant and K I represents the inactivator concentration when half of the maximal rate of enzyme inactivation was achieved.
Kinetic constants for TDI of CYP2C9, CYP2C19, CYP2D6, and CYP3A4.
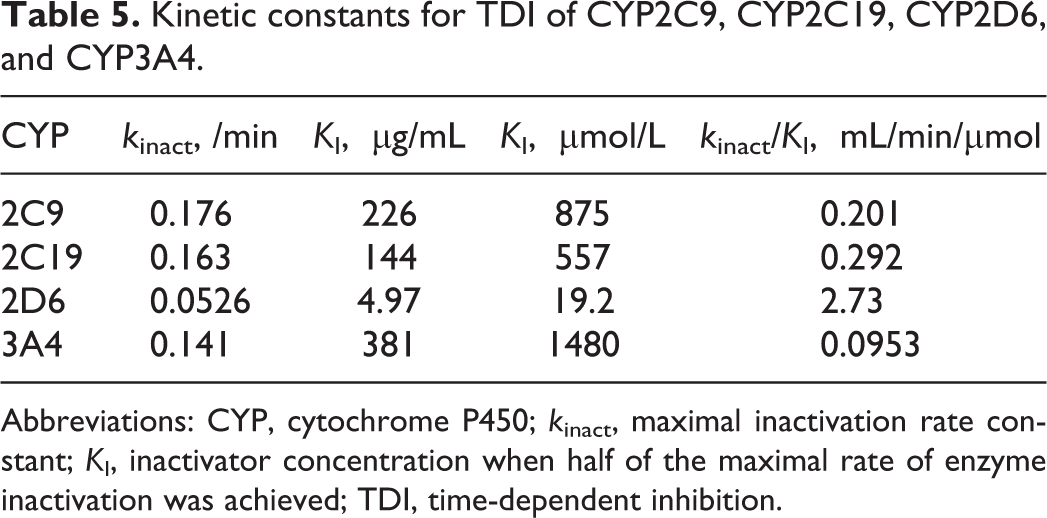
Abbreviations: CYP, cytochrome P450; k inact, maximal inactivation rate constant; K I, inactivator concentration when half of the maximal rate of enzyme inactivation was achieved; TDI, time-dependent inhibition.
Plasma Protein Binding of MMB4 DMS
In order to evaluate the stability of MMB4 DMS, the concentrations of MMB4 DMS after incubation for 6 and 24 hours in PBS buffer or the plasma of 6 species (rat, guinea pig, rabbit, dog, monkey, or human) were determined and compared to the preincubation concentrations. Approximately 61% of the preincubation MMB4 concentration was detected in PBS buffer after 24 hours. Although approximately 72% was found in rat plasma, substantially lower concentrations of MMB4 were detected in plasma of other species after 24-hour incubation, accounting for only 32% to 45% of the preincubation MMB4 concentrations. However, after incubation for 6 hours, the concentrations of MMB4 were greater than 70% of the concentrations measured before the incubation.
For the evaluation of protein breakthrough across the membrane, aliquots of solution taken from the buffer chamber were treated with ice-cold acetonitrile after the dialysis for 24 hours. No precipitation or cloudiness was observed in the acetonitrile-treated buffer solution. In addition, amounts of MMB4 DMS at 0.1 and 1000 µg/mL concentrations, as well as the positive controls (acetaminophen and warfarin at 5 µmol/L concentration), were determined in the PBS buffer without any plasma before and after the dialysis to evaluate any potential nonspecific binding of MMB4 to the dialysis device. The amounts of MMB4 DMS in the PBS buffer after the dialysis were within approximately 2% of the predialysis levels. Similarly, the amounts of acetaminophen and warfarin after the dialysis were within 2% of the predialysis levels for the respective compounds. In order to evaluate the time required to reach equilibrium, MMB4 DMS (final concentration of 0.1 µg/mL and radioactivity concentration of 0.0239 µCi/mL) in rat plasma was incubated in the dialysis device for up to 6 hours. The radioactivity counts reached a plateau at approximately 5 hours postdialysis (Figure 10).
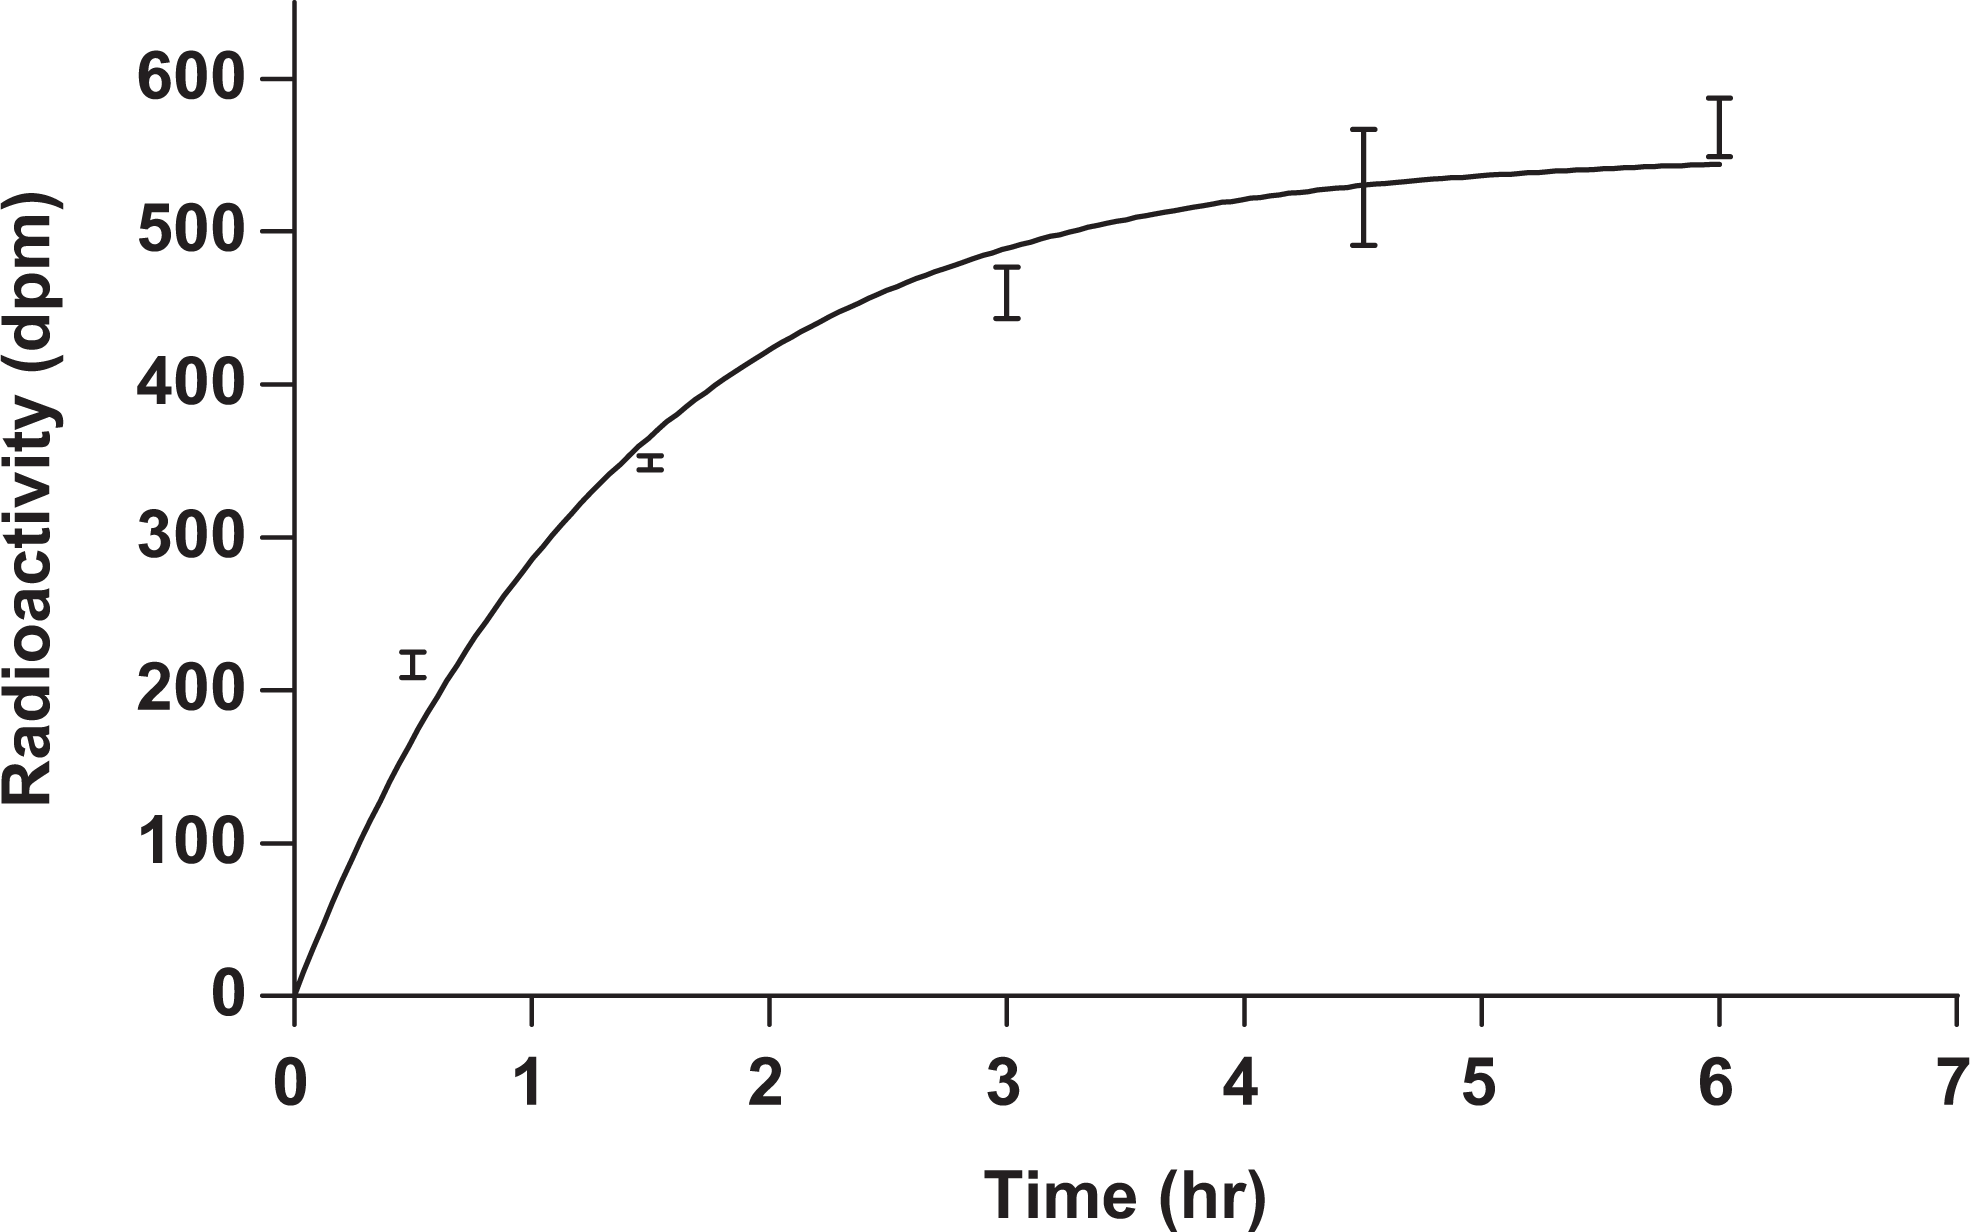
Time course of radioactivity (disintegrations per minute [dpm]) detected in buffer compartment after dialysis for 6 hours.
After the 5-hour dialysis, the extent of plasma protein binding for all species tested in this study was not dependent upon the concentrations of MMB4 DMS ranging from 0.1 to 1000 µg/mL (Table 6). The MMB4 DMS was bound to guinea pig and rabbit plasma protein at the highest level (17.3% ± 1.8%), followed by monkey (16.3% ± 1.0%), human (14.7% ± 1.9%), dog (12.1% ± 1.3%), and rat (10.0% ± 0.8%). The determined values for acetaminophen and warfarin protein binding in human plasma were 16.8% and 98.7%, respectively. These results obtained for acetaminophen and warfarin binding with human plasma protein are in good agreement with the published data. Reported human plasma protein binding values are approximately 20% for acetaminophen and 99% for warfarin. 5
Plasma Protein Binding of MMB4 DMS.
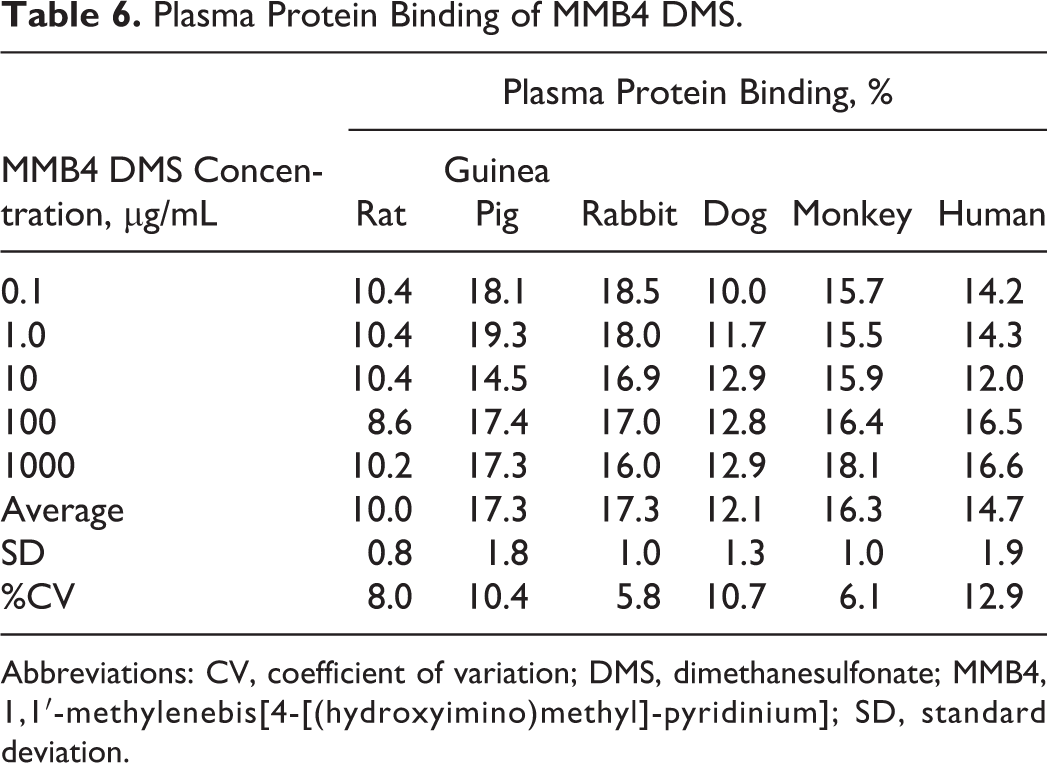
Abbreviations: CV, coefficient of variation; DMS, dimethanesulfonate; MMB4, 1,1′-methylenebis[4-[(hydroxyimino)methyl]-pyridinium]; SD, standard deviation.
Discussion
The present study examined metabolism and plasma protein binding for MMB4 DMS using various in vitro techniques and a wide range of species. When MMB4 DMS at 10 µg/mL was incubated in rat, rabbit, monkey, and HLMs, 4-PA and an additional metabolite were detected in all the species. The formation of 4-PA was expected, since it has been found to be a major hydrolysis product of MMB4 DMS in nonacidic solutions. 6 As such, the amounts of 4-PA formed after 3-hour incubation in liver microsomes were comparable to all the species tested (27% to 32%). The identity of the additional metabolite detected in liver microsomes was characterized by LC-MS/MS analysis that resulted in a distinct product ion signal (124 > 96 m/z). It was postulated that this represented the LC-MS/MS profile of INA. The LC-MS/MS profile and retention time of the additional metabolite formed in liver microsomes were confirmed to be identical to those of the authentic INA. After 3-hour incubation of MMB4 DMS at 10 µg/mL concentration, the amount of INA varied with the highest level found in monkey liver microsomes (22% of total radioactivity) followed by human (19%), rat (15%), and rabbit (5%). The amount of INA formed in liver microsomes was inversely correlated with the amount of MMB4 remaining after 3-hour incubation, which suggested species-dependent biotransformation of MMB4 into INA.
Hepatocytes from various preclinical species and humans seemed to be inadequate for metabolic profiling due to potentially detrimental effect of MMB4 DMS on hepatocytes. Although the cell viability values based on the Trypan blue exclusion method were greater than 90% of the preincubation levels, there was a significant decrease in intracellular ATP level (11% of control) after incubation for 3 hours with MMB4 DMS at 2500 µg/mL concentration. In addition, further investigation revealed that the decrease in intracellular ATP levels was dependent on the concentration of MMB4 DMS. These results suggested that the functional activity of hepatocytes might be adversely affected by higher concentrations of MMB4 DMS, even though the cellular membranes were not disrupted.
Regarding the metabolic pathway from 4-PA to INA, it was hypothesized that INA would be a product of reductive cleavage of the N–O bond in the oxime moiety of 4-PA followed by the hydrolysis of an intermediate imine and subsequent oxidation of the resulting aldehyde (Figure 11). This proposed pathway is coherent with an investigation by Heberling et al, which illustrated biotransformation of benzaldoxime into benzoic acid via benzaldimine in HLMs. 7 Identification of enzyme(s) responsible for biotransformation of MMB4 to 4-PA and/or INA involved use of different incubation conditions in liver microsomes or S9 fractions. 8 A substantial decrease in the metabolite formation upon exclusion of β-NADPH from the incubation would suggest an involvement of CYP or FMO enzymes. In general, the formation of 4-PA was not affected by excluding β-NADPH from the incubation in rat, rabbit, monkey, and HLMs. On the other hand, the amount of INA was substantially reduced when β-NADPH was removed from the incubation in rat, monkey, and HLMs but not in rabbit liver microsomes. These results suggested that β-NADPH-dependent enzymatic systems such as CYP and FMO might be involved in the biotransformation of MMB4 to INA in rat, monkey and HLMs.
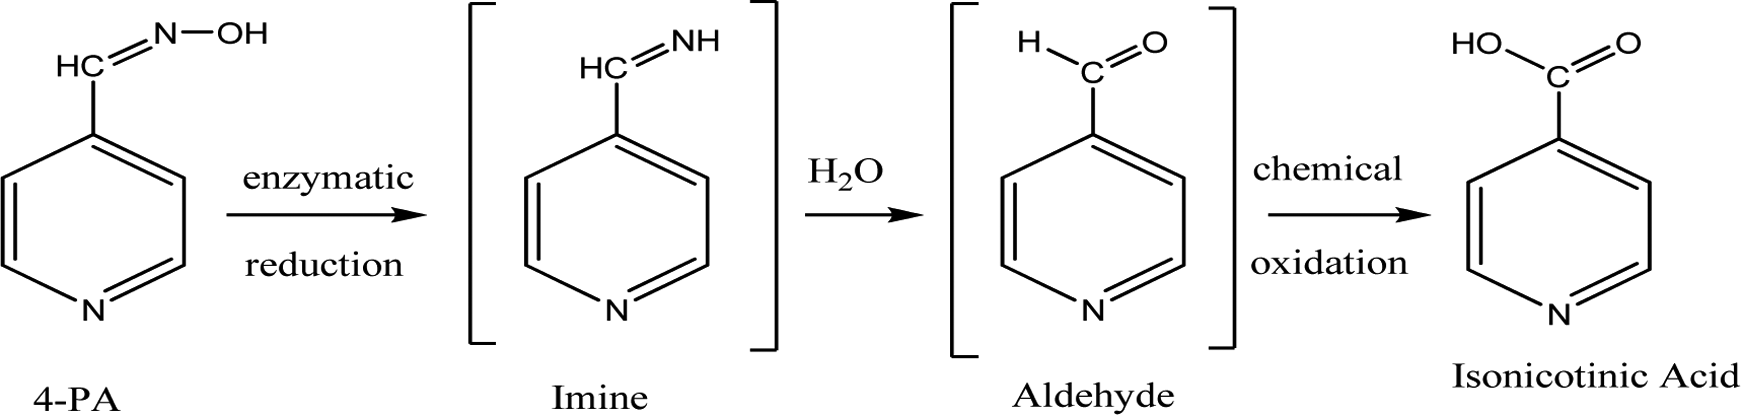
Proposed pathway for biotransformation of 4-PA into isonicotinic acid.
In order to further examine the role of CYP or FMO in MMB4 metabolism, 1-ABT, an inactivator of CYP enzymes with broad specificity, was added to the incubation medium, or the liver microsomes were pretreated at 45°C to heat inactivate the FMO. Although the amounts of 4-PA and INA formed in rat, rabbit, and HLMs were not affected by adding 1-ABT, there were reductions in the formation of 4-PA and INA in monkey liver microsomes incubated with MMB4 DMS at the 10 µg/mL concentration. These results appeared to indicate that CYP enzyme(s) were involved in the conversion of MMB4 into 4-PA and INA in monkey liver microsomes but not in other species. However, it would be difficult to envision very distinct metabolic pathways from MMB4 to INA in rat, rabbit, and human liver as opposed to a CYP-driven process in monkey liver. Therefore, it was not entirely conclusive that CYP enzyme(s) were involved in the biotransformation of MMB4 into 4-PA and INA. The FMO did not seem to be responsible for the formation of 4-PA and INA, as there were no overt differences in the amounts of 4-PA and INA formed in heat-inactivated liver microsomes when compared to the results obtained in active microsomes. Although a smaller amount of INA was formed in rat microsomes after the heat inactivation, there was no difference in INA formation in active versus heat-inactivated rat liver microsomes when incubated with MMB4 DMS at 1000 µg/mL concentration.
In addition, possible involvement of MAOs and molybdenum-containing hydroxylases such as aldehyde oxidase and xanthine oxidase was evaluated using adequate inhibitors of these enzymes. When MMB4 DMS was incubated with pargyline, an inhibitor of MAOs with broad specificity, there were no differences in the amounts of 4-PA and INA formed in rat, rabbit, monkey, and human liver S9 fractions when compared to the results in the absence of pargyline. Addition of menadione, an inhibitor of aldehyde oxidase, in the incubation medium did not decrease the amounts of 4-PA and INA formed in rat, rabbit, monkey, and human liver S9 fractions. It was unexpected to see increased amounts of 4-PA and INA formed in monkey liver S9 fractions when incubated with MMB4 DMS at 10 µg/mL in the presence of menadione. However, there was no difference in the amounts of 4-PA and INA in monkey liver S9 fractions after incubation with MMB4 DMS at 1000 µg/mL and menadione. Incubations of MMB4 DMS in rat, rabbit, monkey, and human liver S9 fractions in the presence of allopurinol, an inhibitor of xanthine oxidase, resulted in similar levels of 4-PA and INA when compared to the results in the absence of allopurinol. Taken together, these results suggested that the biotransformation of MMB4 into 4-PA and INA was not likely mediated by CYPs, FMOs, MAOs, aldehyde oxidase, or xanthine oxidase, but that the formation of INA was dependent on β-NADPH. These findings are in good agreement with the published data of benzaldoxime, which suggested that NADH-cytochrome b5 reductase and cytochrome b5 were involved in the biotransformation of benzaldoxime to benzaldimine. 7
The MMB4 DMS was also tested for potential DDIs mediated by CYP enzyme inhibition. The MMB4 DMS exhibited reversible inhibition in a concentration-dependent manner toward CYP1A2, CYP2C9, CYP2C19, CYP2D6, and CYP3A4 in HLMs. With increasing concentrations of MMB4 DMS in HLM, a steeper decline in enzyme activity was observed for CYP2D6 than the other CYP enzymes tested. Although the enzyme activity of CYP2D6 was substantially inhibited (approximately 50%) by the highest concentration of MMB4 DMS tested (100 µg/mL), the inhibitions of CYP1A2 and CYP2C19 were modest (approximately 40%) and inhibitions of CYP3A4 and CYP2C9 were considered to be marginal (less than 30%) at 100 µg/mL of MMB4 concentration. The MMB4 IC50 value for CYP2D6 was 99.3 µg/mL (385 µmol/L) based on a linear interpolation as described by Dierks et al. 4 On the other hand, IC50 values for CYP3A4, CYP2C9, CYP1A2, and CYP2C19 could not be calculated, because the remaining activities at the highest MMB4 concentration of 100 µg/mL were above 50% (ranging from 58.6% to 75.4%) of the baseline enzyme activities. The linear interpolation method was considered to provide best estimate of IC50, since the experimental data did not cover the full range of the sigmoidal inhibitory relationship between CYP activity and MMB4 concentration. The characterization of a full inhibitory curve would require use of much higher concentrations of MMB4 DMS. However, given the effect of MMB4 DMS at higher concentrations in cellular functions as illustrated by the ATP assay, use of another in vitro system such as recombinant CYP enzymes would be a more VALID approach to the IC50 determination.
The TDI of CYPs was evaluated by initial preincubation of MMB4 DMS with HLM for 30 minutes in the presence or absence of β-NADPH followed by a 10-fold dilution and subsequent measurements of functional activities of CYP enzymes. The dilution step in this procedure was intended to minimize the impact of reversible CYP inhibition by MMB4 DMS on the TDI evaluation. Quantitative results on the extent of TDI were obtained for CYP3A4, CYP2C9, and CYP2C8, but the TDI results for CYP2D6, CYP2C19, and CYP1A2 were not considered to be reliable, because they were based on the extrapolated values, as the amounts of metabolites were below the limit of quantitation for these CYPs. There were concentration-dependent increases in TDI for CYP3A4 and CYP2C9 with approximately 39% and 36% TDI observed at the highest concentration of MMB4 DMS tested in HLM (100 µg/mL). There was no concentration dependence in the extent of TDI for CYP2C8 ranging from 4% to 27% across MMB4 DMS concentrations tested in this study.
Due to the limitations in using higher concentrations of MMB4 DMS in HLM, human recombinant CYP enzymes were used to evaluate the inhibitory curves more adequately and determine detailed kinetic constants for reversible inhibition and potential TDI. The MMB4 DMS exhibited reversible inhibition toward human recombinant CYP1A2, CYP2C8, CYP2C9, CYP2C19, CYP2D6, and CYP3A4. Among these enzymes, CYP2D6 was mostly inhibited by MMB4 DMS, with IC50 and K i values of 80.6 and 66.6 µmol/L, respectively. This result was in good agreement with the HLM data that showed CYP2D6 to be the most susceptible CYP enzyme with regard to the extent of reversible inhibition by MMB4 DMS. It would be difficult to directly compare IC50 values for CYP2D6 determined in HLM versus human recombinant enzyme, since different ranges of MMB4 concentrations were evaluated and therefore distinct methods of IC50 calculation were used (ie, linear interpolation vs nonlinear regression of the sigmoidal inhibitory curve).
In addition, since the IC50 data can be influenced by different experimental conditions, it would be more appropriate to compare K i values for reliable evaluation of inhibitory potency. The MMB4 DMS was a moderate inhibitor of CYP2C8 and CYP2C19 with a K i value of 126 and 146 µmol/L, respectively. The MMB4 DMS showed relatively weaker inhibition toward CYP2C9 and CYP1A2, with K i values of 242 and 627 µmol/L, respectively. The MMB4 DMS exhibited the weakest inhibition toward CYP3A4, with a K i value of 1250 µmol/L. Among human recombinant CYP enzymes tested, there were apparent shifts in the inhibitory curves of CYP2C9, CYP2C19, CYP2D6, and CYP3A4, suggesting that MMB4 DMS would exhibit TDI toward these enzymes. In order to determine kinetic constants for TDI, further evaluations were conducted with these 4 enzymes using various preincubation times and a wide range of concentrations for MMB4 DMS and specific CYP substrates. As demonstrated by the k inact/K I values, MMB4 DMS was found to exhibit the most potent TDI toward CYP2D6, moderate TDI for CYP2C9 and CYP2C19, and the weakest TDI toward CYP3A4.
The CYP3A4, CYP2C9, and CYP2D6 are known to metabolize more than 75% of marketed drugs. 9 Among these major metabolizing enzymes, CYP2D6 was most susceptible to both reversible and TDI by MMB4 DMS. Therefore, it is likely to affect the clearance of drugs that are metabolized by CYP2D6 when concomitantly administered with MMB4 DMS. This DDI can result in unexpectedly higher systemic exposure to the affected drug, which in turn may lead to idiosyncratic reactions, especially when the affected drug has a narrow therapeutic index. In addition, the DDI resulting from TDI may persist even after the inhibitor is cleared of the systemic circulation, since the affected CYP enzymes are no longer functional and new enzymes need to be generated by de novo protein synthesis. 10 The CYP2D6 metabolizes a wide range of marketed drugs including desipramine (tricyclic antidepressant), thioridazine (antipsychotic), dextromethorphan (antitussive), and atomoxetine (norepinephrine reuptake inhibitor). Further in vivo studies are warranted to evaluate the changes in systemic exposure measures (eg, area under the concentration–time curve) for those drugs that are substrates of CYP2D6 after coadministration of MMB4 DMS.
Plasma protein binding is one of the key determinants for pharmacokinetic and pharmacodynamic profiles for an investigational drug, as it affects the concentrations of free drug that is not bound to plasma protein and thus available at the pharmacological target site. In order to adequately determine the extent of drug binding to plasma protein using the equilibrium dialysis method, several aspects such as the stability of the drug, protein breakthrough across the membrane, nonspecific binding to the dialysis device, and time to reach equilibrium needed to be examined. It was found that MMB4 DMS was stable for 6 hours when incubated in PBS buffer and plasma for all species tested in this study. No precipitation or cloudiness was observed in aliquots of solution that was taken from the PBS buffer chamber after dialysis and subsequently treated with ice-cold acetonitrile, which indicated that the plasma protein did not break through the membrane. There was negligible nonspecific binding of MMB4 DMS to the equilibrium dialysis device. The equilibrium of plasma protein binding to MMB4 was achieved after approximately 5 hours of dialysis. Based on these results, MMB4 DMS was incubated at 5 different concentrations in rat, guinea pig, rabbit, dog, monkey, and human plasma for 5 hours in the equilibrium dialysis device, and the extents of plasma protein binding were determined. For all species tested, there were no concentration-dependent changes in the extent of plasma protein binding to MMB4. The average extent of plasma protein binding to MMB4 was comparable among different species, with the highest level (17.3%) found in rabbit and guinea pig plasma and lowest (17.3%) in rat plasma. For human plasma, 14.7% ± 1.9% of MMB4 DMS was bound to plasma protein. These results suggest that MMB4 is not extensively bound to plasma protein, and no overt species-related differences were observed in the extent of MMB4 bound to plasma protein.
In summary, the current investigations demonstrated metabolic profiles of MMB4, identified metabolites of MMB4, examined potential enzymes responsible for MMB4 metabolism, evaluated reversible inhibition and TDI toward major CYP enzymes by MMB4 DMS, and determined the extent of plasma protein binding. These experimental data will not only enhance understanding of in vivo disposition for MMB4 DMS but also provide useful insight when translating preclinical study outcomes into humans.
Footnotes
Acknowledgments
The authors wish to thank Dan Burnham and Catherine Mickolick for their technical assistance and contributions to these studies. The authors also acknowledge the editorial assistance of Dr. Vincent Brown.
Authors’ Note
The opinions and assertions contained herein are the private views of the authors and are not to be construed as official or reflecting true views of the Department of the Army or the Department of Defense.
Declaration of Conflicting Interests
The author(s) declared no potential conflicts of interest with respect to the research, authorship, and/or publication of this article.
Funding
The author(s) disclosed receipt of the following financial support for the research, authorship, and/or publication of this article: This research was funded by the United States Army; Chemical Biological Medical Systems (CBMS)/Medical Identification and Treatment Systems (MITS) under contract SP0700-00-D-D3180, Delivery Order 0599 (Task 771) and Delivery Order 0600 (Task 789).
References
Supplementary Material
Please find the following supplemental material available below.
For Open Access articles published under a Creative Commons License, all supplemental material carries the same license as the article it is associated with.
For non-Open Access articles published, all supplemental material carries a non-exclusive license, and permission requests for re-use of supplemental material or any part of supplemental material shall be sent directly to the copyright owner as specified in the copyright notice associated with the article.