
Abstract
Kidney injury biomarkers have been utilized by pharmaceutical companies as a means to assess the potential of candidate drugs to induce nephrotoxicity. Multiple platforms and assay methods exist, but the comparison of these methods has not been described. Millipore’s Kidney Toxicity panel, EMD/Novagen’s Widescreen Kidney Toxicity panel, and Meso Scales Kidney Injury panel were selected based on published information. Kidney injury molecule 1, cystatin C, clusterin, and osteopontin were the 4 biomarkers common among all kits tested and the focus of this study. Rats were treated with a low and high dose of para-aminophenol, a known nephrotoxicant, and urine samples were collected and analyzed on the Bio-Plex 200 or MSD’s Sector Imager 6000, according to manufacturers specifications. Comparatively, of the 3 kits, Millipore was the most consistent in detecting elevations of 3 out of the 4 biomarkers at both dose levels and indicated time points.
Introduction
Recently, the Food and drug administration (FDA) endorsed several novel kidney biomarkers in rodents 1 greatly enhancing our ability to detect renal changes prior to overt changes in renal function. Previously, these early predictor biomarkers of nephrotoxicity were performed in individual assays requiring large amounts of sample volume which is not conducive in nonclinical small animal studies during drug development. Because of multiplex technology, this is no longer the case. Consequently, simultaneous renal biomarker end points are now available on a single multiplex panel from multiple vendors. These multiplex kits promise efficiency gains, high throughput, assay sensitivity, and smaller volume requirements at a lower cost.
Choosing the correct multiplex panel is a critical step before the analysis of study samples. Nearly, all commercially available multiplex kits are supplied with reference standards providing quantitative information; yet questions remain whether the quantitative data obtained are similar to each other. As of now, there have been no studies directly comparing the commercially available multiplex Kidney Toxicity panel by Millipore, EMD/Novagen’s Widescreen Kidney Toxicity panel, or Meso Scales Kidney Injury panel. In this study, we describe our assessment of these 3 nephrotoxicity rat kits using para-aminophenol (PAP) as the nephrotoxicant. Para-aminophenol is known to cause necrosis of the proximal straight tubule 2–5 early on post administration 2 ,4 of elevating urea nitrogen (UN) and creatinine (CREAT) within 24 hours of dosing in rats, 6 validating its usage as a model for acute analgesic nephropathy. 4 Kidney injury molecule 1 (KIM-1), cystatin C (CysC), clusterin (CLUS), and osteopontin (OPN) were the 4 biomarkers common among all kits tested and the focus of this study.
Materials and Methods
Kidney Injury Kits
Meso Scale (MSD), Millipore, and EMD/Novagen all offer kits for kidney injury biomarkers. These kits were selected based on published information and evaluated with PAP as the nephrotoxicant 7 . Both Millipore (RKTX1-37/RKTX2-37 K) and EMD’s Widescreen Beadplex (72164/72174) Rat Kidney Toxicity panels utilize xMAP technology (Luminex Corporation, Austin, TX) and was read on the Bio-Plex 200 array system (Bio-Rad, Life Science, Hercules, CA), whereas Meso Scales’s (MSD) Kidney Injury panels (K15162C-1/K15156C-1) use plate-based electrochemiluminescent technology and were read on the MSD Sector Imager 6000 (Meso Scale Discovery, Gaithersburg, MD). Kidney injury molecule 1, CysC, CLUS, and OPN were analyzed for comparison.
Animals and Samples
Twelve 7-week-old male Wistar Han IGS (CRL:WI [Han]) rats from Charles River Laboratories (Hollister, California) were equally distributed between vehicle, low-dose (50 mg/kg), and high-dose (150 mg/kg) groups using a computer-assisted randomization procedure to ensure similar distribution of body weights with 4 animals per group. Rats were individually housed in metabolic cages (VWR, West Chester, Pennsylvania) to collect urine over timed intervals. The environment was controlled with a 12-hour light/12-hour dark cycle at a temperature between 64 F and 79 F. Both feed (Certified Rodent Diet 5001, PMI Nutrition International, LLC, Brentwood, Missouri) and water were available ad libitum. Clinical signs were monitored throughout the duration of the study. Rats were sacrificed with carbon dioxide (CO2) overexposure followed by puncture of the diaphragm. The study was conducted in a facility accredited by the Association for Assessment and Accreditation of Laboratory Animal Care International (AAALAC). All procedures involving laboratory animals were reviewed and approved by the Institutional Animal Care and Use Committee(IACUC) associated with the facility in which the laboratory animals were housed.
Animals were dosed intraperitoneally (IP). Control animals were given 0.9% saline solution only. Para-aminophenol was given once daily at doses of 50 mg/kg or 150 mg/kg for 1 or 3 days. Urine was collected from all animals at 24-hour intervals representing days −1(baseline), 1, 2, and 3 using a refrigerated urine collection unit and stored at 4 C until submission for biomarker analysis.
Animals were transferred to the metabolic system on day −1 for baseline urine sample collection which was stopped prior to the first dose of PAP. Rats were then dosed with PAP and urine was collected 24 hours after dosing; some animals were euthanized for renal pathology at 24 hours post dose. The remaining rats were given a second dose of PAP and urine was collected 24 hours, followed by a third dose of PAP and a final urine collection at 24 hours post third dose; rats were euthanized at 72 hours for renal pathology. Terminal blood was collected into a 1-mL tube without anticoagulant. Postmortem gross examination was performed on each rat and gross findings were annotated. Kidneys were collected and fixed in neutral buffered 10% (v/v) formalin and embedded in paraffin and processed for microscopic examination by a board-certified veterinary pathologist.
Laboratory Tests
Study samples were assigned accession numbers and analyzed in a blinded fashion. Urea nitrogen and CREAT (Bayer Healthcare, LLC) were determined using standard laboratory procedures on the Advia 1200 (Siemens Healthcare Diagnostics) clinical chemistry analyzer. Urine biomarkers were assessed in duplicates using each of the rodent kidney kits according to manufacturer’s procedures. 8 –10 Total volume was quantified and used to normalize urine data.
Tissue Processing and Preparation
For histological assessment, formalin-fixed kidneys were embedded in paraffin blocks and sectioned at 4 μm following routine histological protocols. The sections were placed on frosted glass slides, stained with hematoxylin and eosin (H&E) and periodic acid-Schiff (PAS), and examined by light microscopy. Samples from treated rats and time-matched control rats were examined in parallel for microscopic evidence of kidney injury. Proximal tubular injury was scored based on degeneration and/or necrosis of tubular epithelial cells accompanied by tubular dilation, thickening of the tubular basement membrane, presence of hyaline or cellular casts, and tubular regeneration. Lesions were scored on a scale of 0 to 5 as follows: 0 = no injury detected; 1 = minimal injury (less than 10% injury detected); 2 = mild injury (between 11% and 25% of tissue injured); 3 = moderate injury (between 26% and 50% of tissue injured); 4 = marked injury (between 50% and 75% of tissue injured); 5 = severe injury (greater than 76% of tissue injured).
Statistical Analysis
Data were analyzed using GraphPad Prism 5 (GraphPad Software Inc., LaJolla, California) for statistical analysis and expressed as mean ± standard deviation (SD). A 2-way analysis of variance was employed. A probability value of P < .05 was considered statistically significant.
Results
For the purpose of this article, only common biomarkers among the 3 kits are discussed. It is important to note that PAP induced renal proximal tubule injury in our study but extended dosing could lead to injuries in other regions of the kidney. 11–13
Mortality was not observed in any of the treated animals. There were some clinical signs associated with PAP treatment. Decreased skin turgor and group mean body weight decreases (−5%) were noted in animals given 3 doses of PAP at 150 mg/kg/d indicative of dehydration. Additionally, brown discolored urine was observed in animals given PAP at either 50 or 150 mg/kg after initial dose of PAP and lasted 3 days.
Histopathology
Histopathologic changes in the kidney were present on days 2 and 4 post dosing. Compared to vehicle-treated rats (Figure 1A and 1B), rats treated with 50 mg/kg and sacrificed on day 2 exhibited mild-to-moderate multifocal necrosis of the proximal tubules (Figure 1C). On day 4, rats treated with 50 mg/kg exhibited mild-to-moderate multifocal necrosis of the proximal tubules accompanied by mild tubular regeneration (Figure 1D).
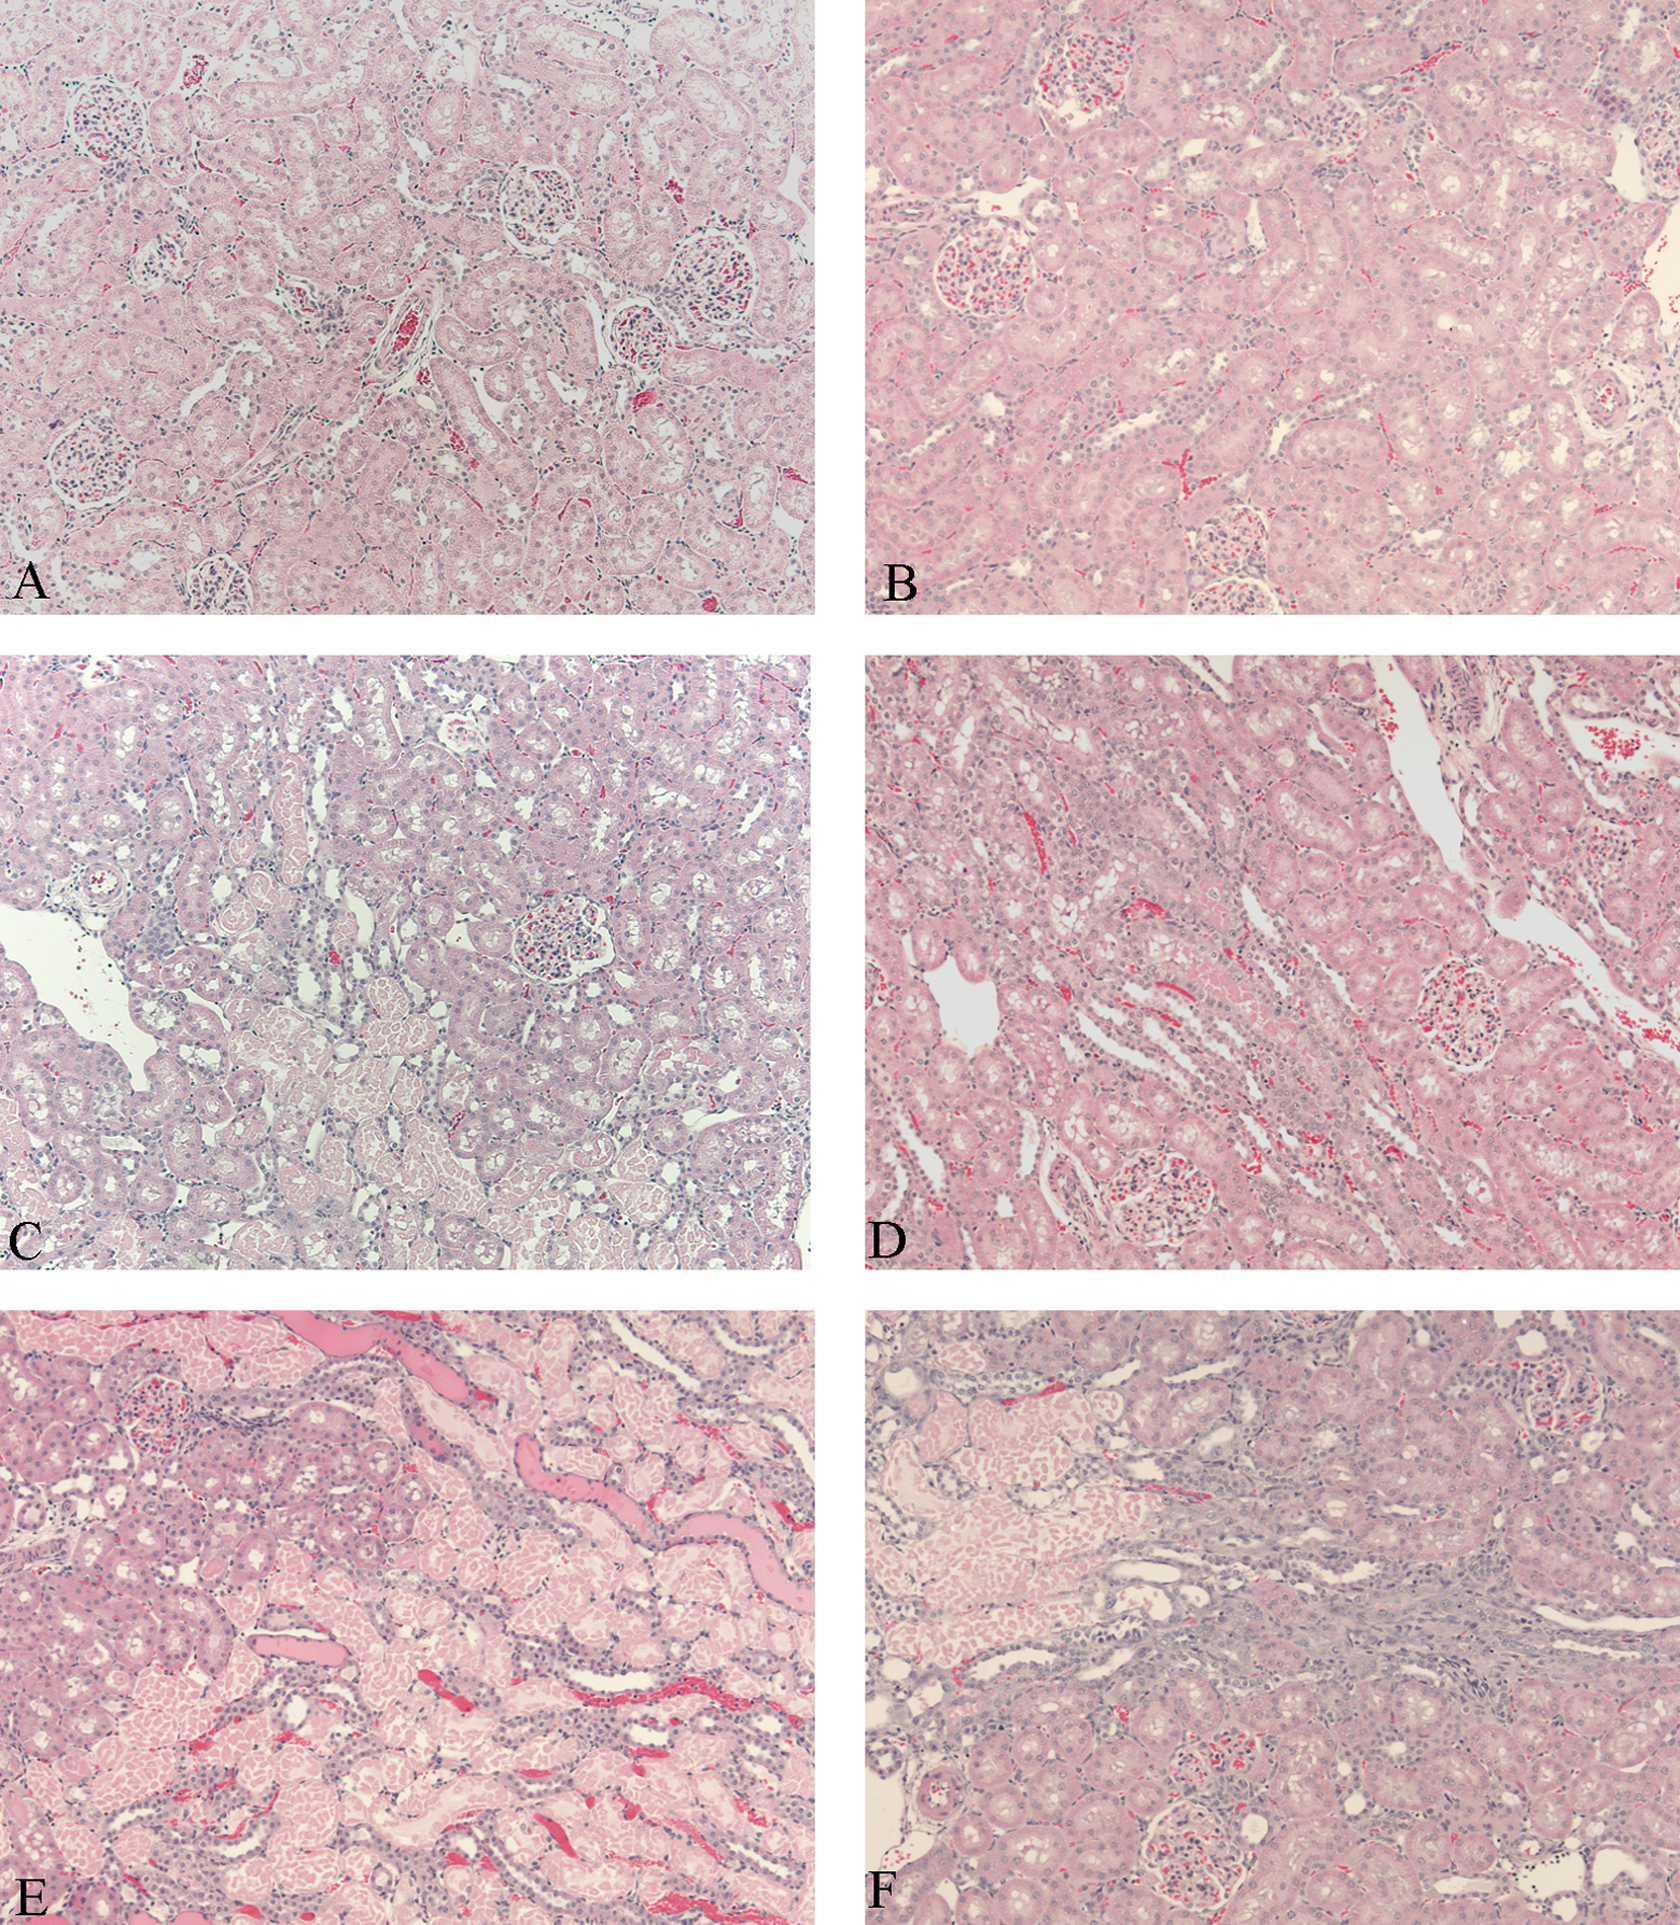
Histological sections of renal cortex. Vehicle-treated rat from days 2 (A) and 4 (B) provided for comparison. Rats treated with 50 mg/kg showed mild necrosis of the proximal tubules on day 2 (C) accompanied by minimal tubular regeneration by day 4 (D). Rats treated with 150 mg/kg showed moderate-to-marked necrosis of the proximal tubules accompanied by mild hyaline cast formation on day 2 (E). By day 4 (F), kidneys from rats administered 150 mg/kg exhibited moderate necrosis of the proximal tubules accompanied by moderate tubular regeneration. Hematoxylin and eosin stain, ×200 magnification.
Rats treated with 150 mg/kg and sacrificed on day 2 exhibited moderate to marked, multifocal necrosis of the proximal tubules accompanied by mild-to-moderate hyaline cast formation (Figure 1E). On day 4, rats administered 150 mg/kg exhibited moderate-to-marked multifocal necrosis of the proximal tubules accompanied by moderate tubular regeneration (Figure 1F).
Biomarkers
There were PAP-related urine biomarker changes in Kim-1, CysC, CLUS, and OPN compared to their baseline that correlated with histopathology changes summarized in Table 1.
Treatment Over Control Fold-Changes of Urine Biomarkers and Histopathology Scoring Post 24-Hour Dosing of Para-Aminophenol.
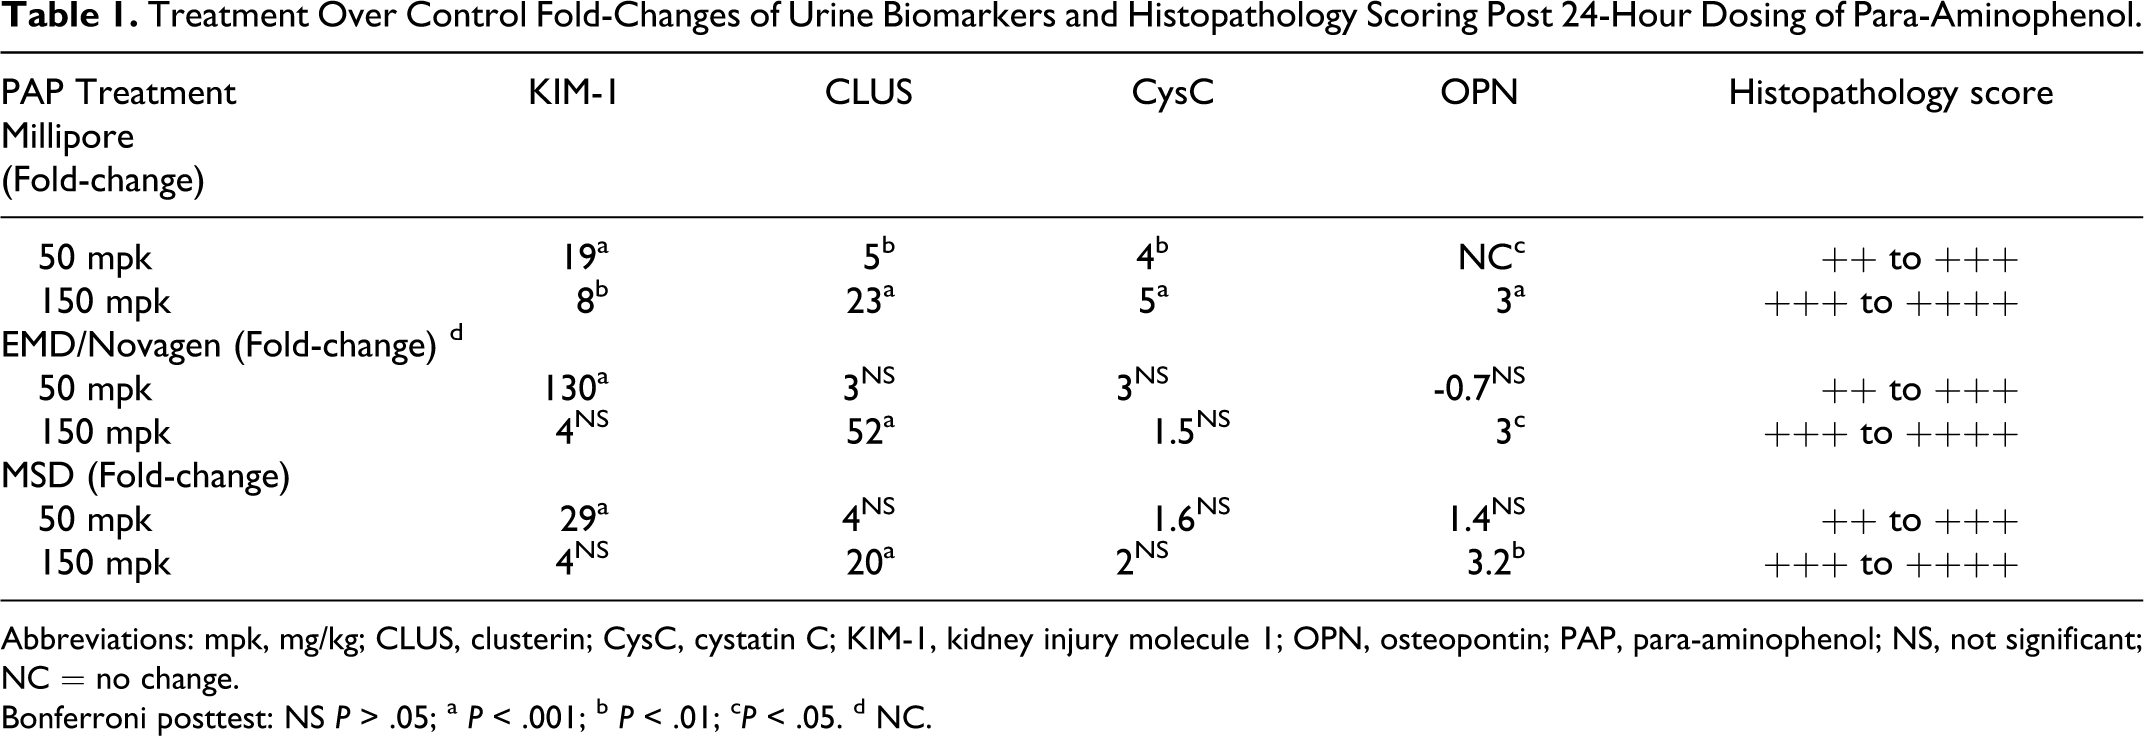
Abbreviations: mpk, mg/kg; CLUS, clusterin; CysC, cystatin C; KIM-1, kidney injury molecule 1; OPN, osteopontin; PAP, para-aminophenol; NS, not significant; NC = no change.
Bonferroni posttest: NS P > .05; a P < .001; b P < .01; c P < .05. d NC.
Kidney injury molecule 1
Kidney injury molecule 1elevations were detected on day 1 post dosing in all 3 kits when compared to the baseline levels (Figure 2A-C). Kidney injury molecule 1 levels were increased 19-fold (P < .001) in Millipore, 130-fold (P < .001) in EMD/Novagen, and 29-fold (P < .001) in MSD’s kit at 50 mg/kg/d on day 1. Statistically significant increases were consistent with histopathology findings at 50 mg/kg PAP for Millipore (P < .001), EMD/Novagen (P < .001), and MSD’s (P < .01) kits on day 2. Furthermore, an 8-fold increase (P < .01) was present in the 150 mg/kg dose group in the Millipore kit which was not detected by either the EMD/Novagen or the MSD kit on day 1. This increase began to return to baseline on day 2 (P < .05). However, there were no statistically significant differences in KIM-1 levels in any kit in either dose group on day 3.
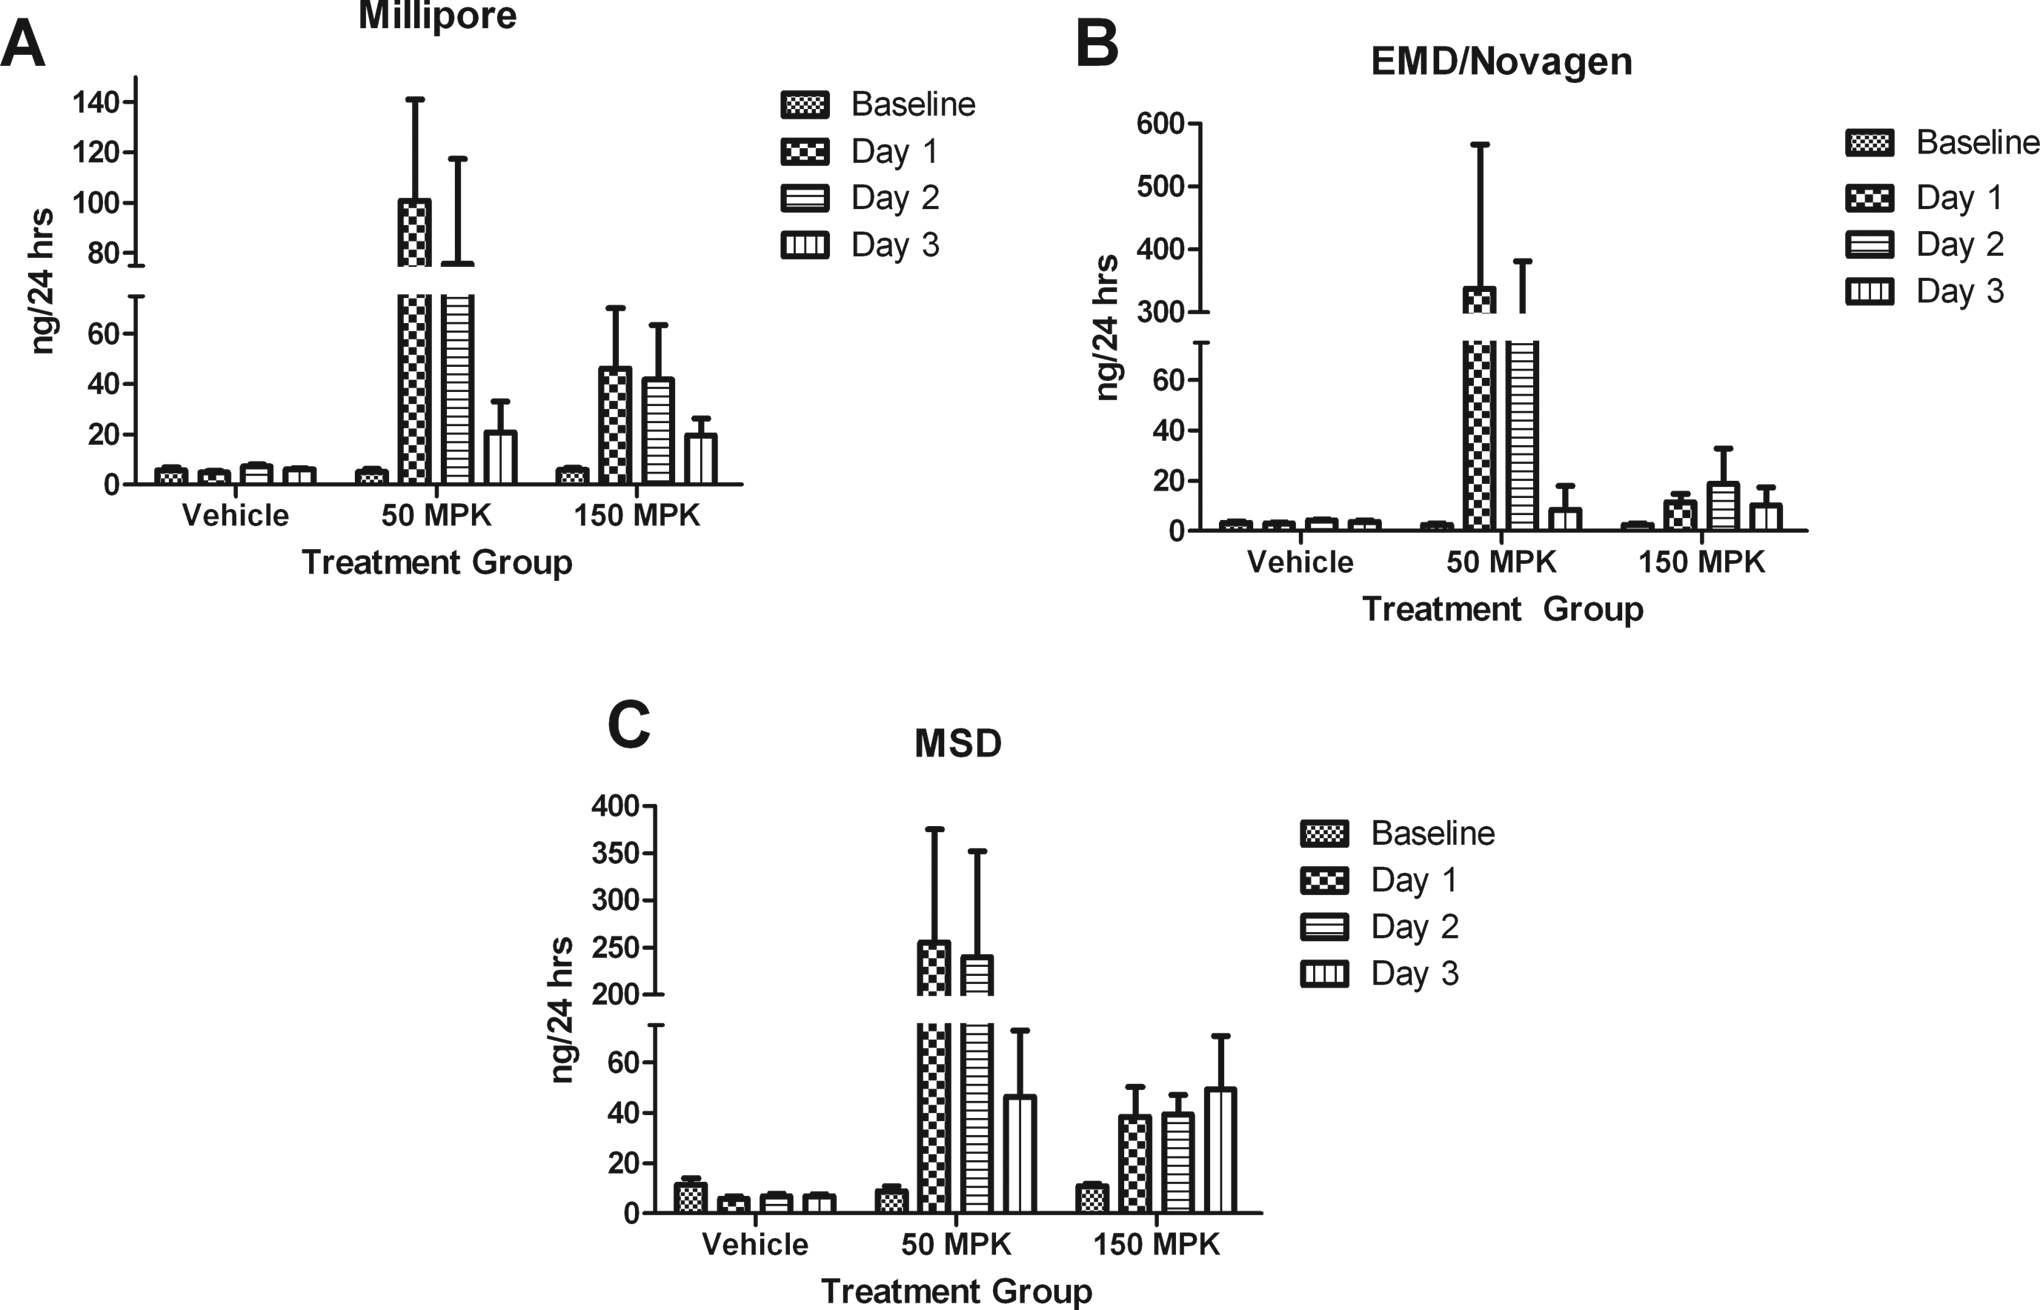
A-C, Results of Kim-1 from Millipore, EMD/Novagen, and MSD kits, respectively. Kidney injury molecule 1 was significantly elevated (P < .001) in all 3 kits on day 1 in the 50-mg/kg group. However, only Millipore’s kit demonstrated early detection (P < .01) on day 1 in the 150-mg/kg group. Day 2 elevations were still apparent in Millipore’s kit for both the 50-mg/kg (P < .001) and the 150-mg/kg (P < .05) dose groups. Data are expressed as mean ± standard deviation (SD). MPK indicates mg/kg.
Clusterin
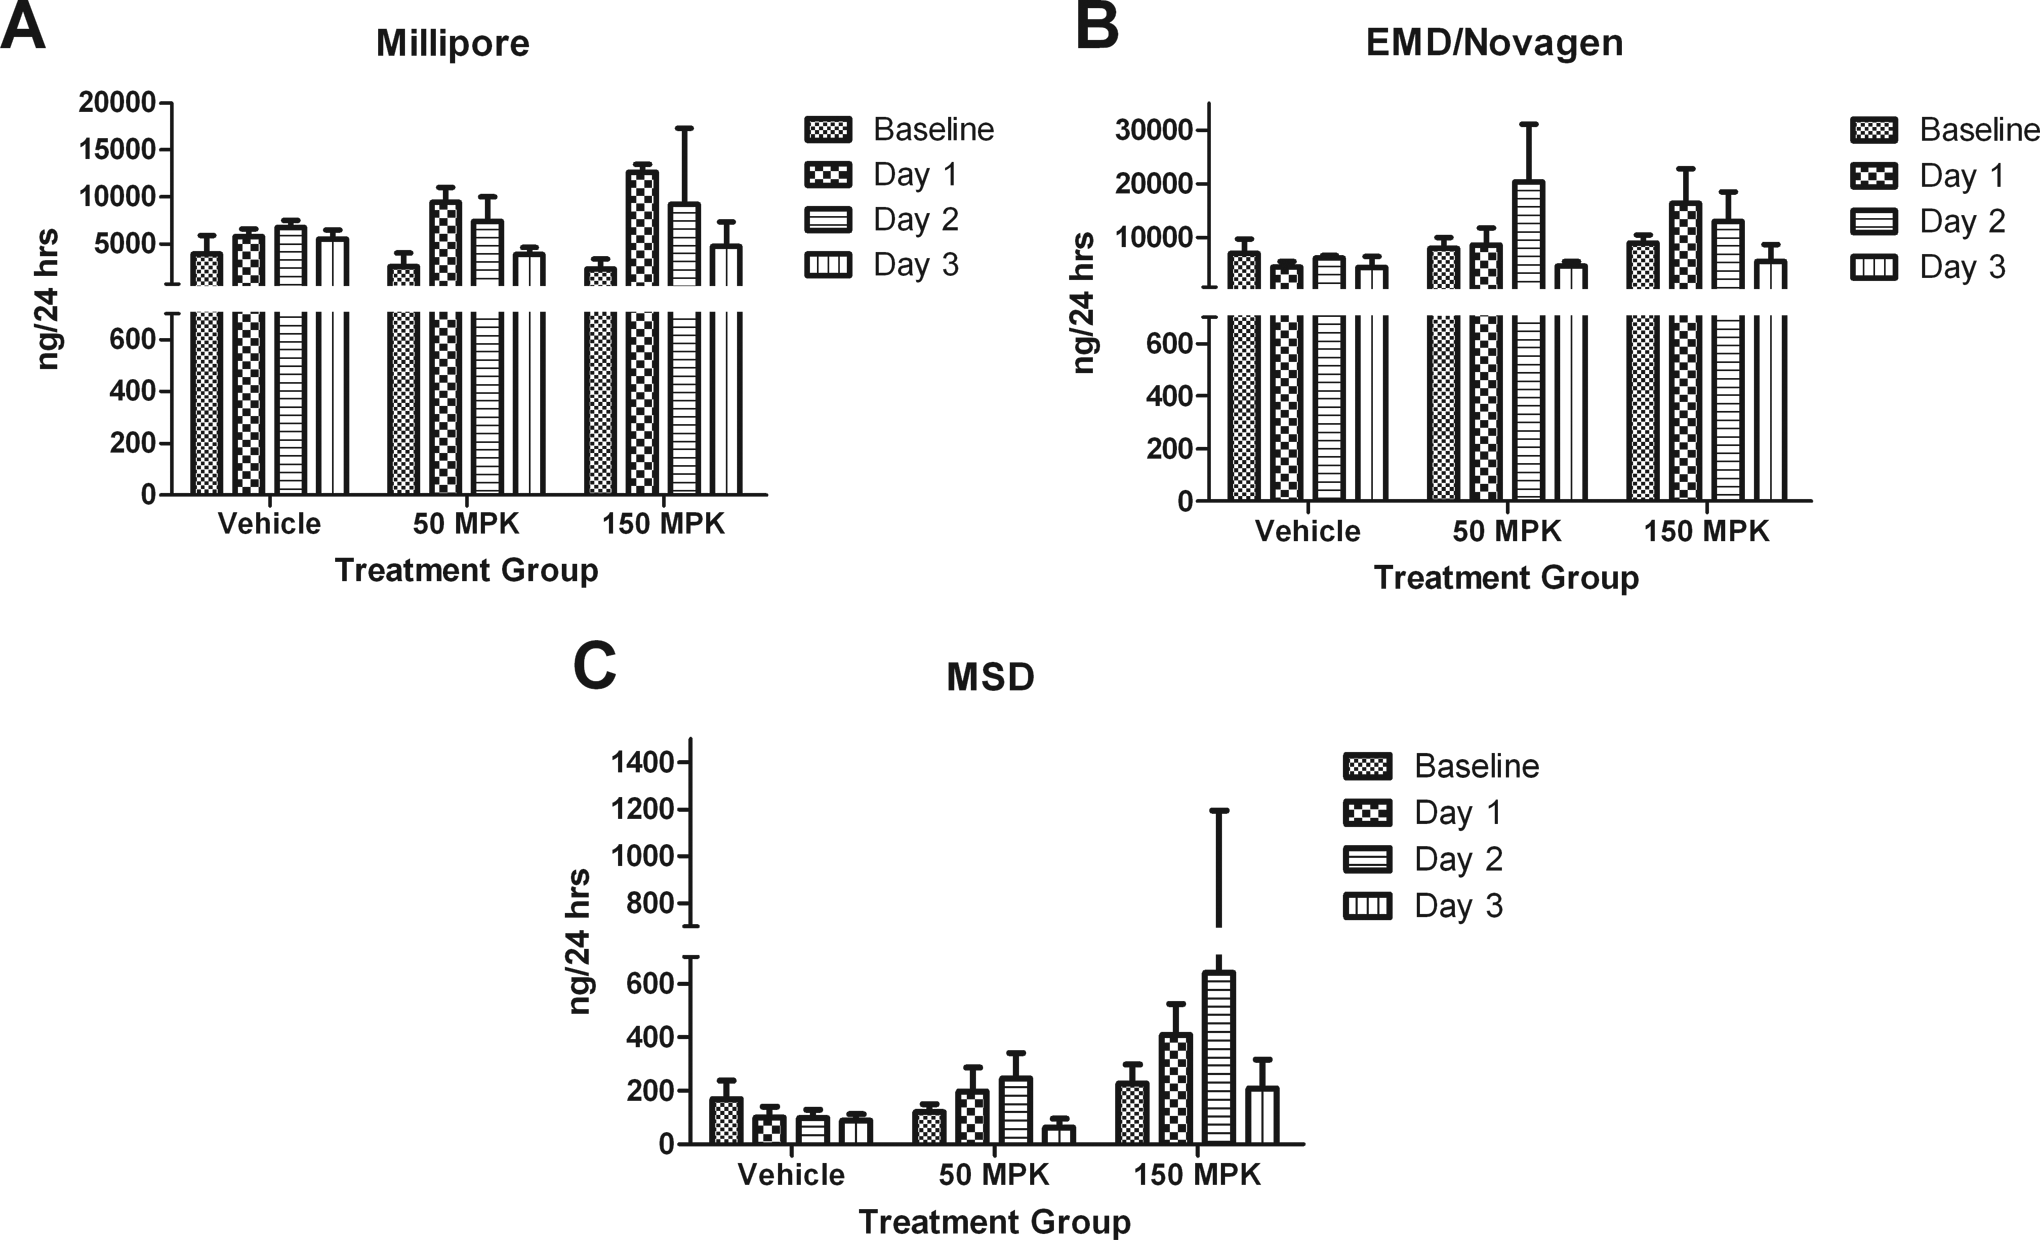
Clusterin increases were detected in animals treated with 50 mg/kg only in the Millipore kit with a 5-fold elevation (P < .01) on day 1 prior to histopathology readout on day 2, whereas Millipore and MSD kits performed similarly in animals treated with 150 mg/kg, demonstrating statistically significant differences when compared to baseline on all 3 days. Comparatively, the EMD/Novagen assay demonstrated a 52-fold increase (P < .001) only at 150 mg/kg on day 1(Figure 3A-C).
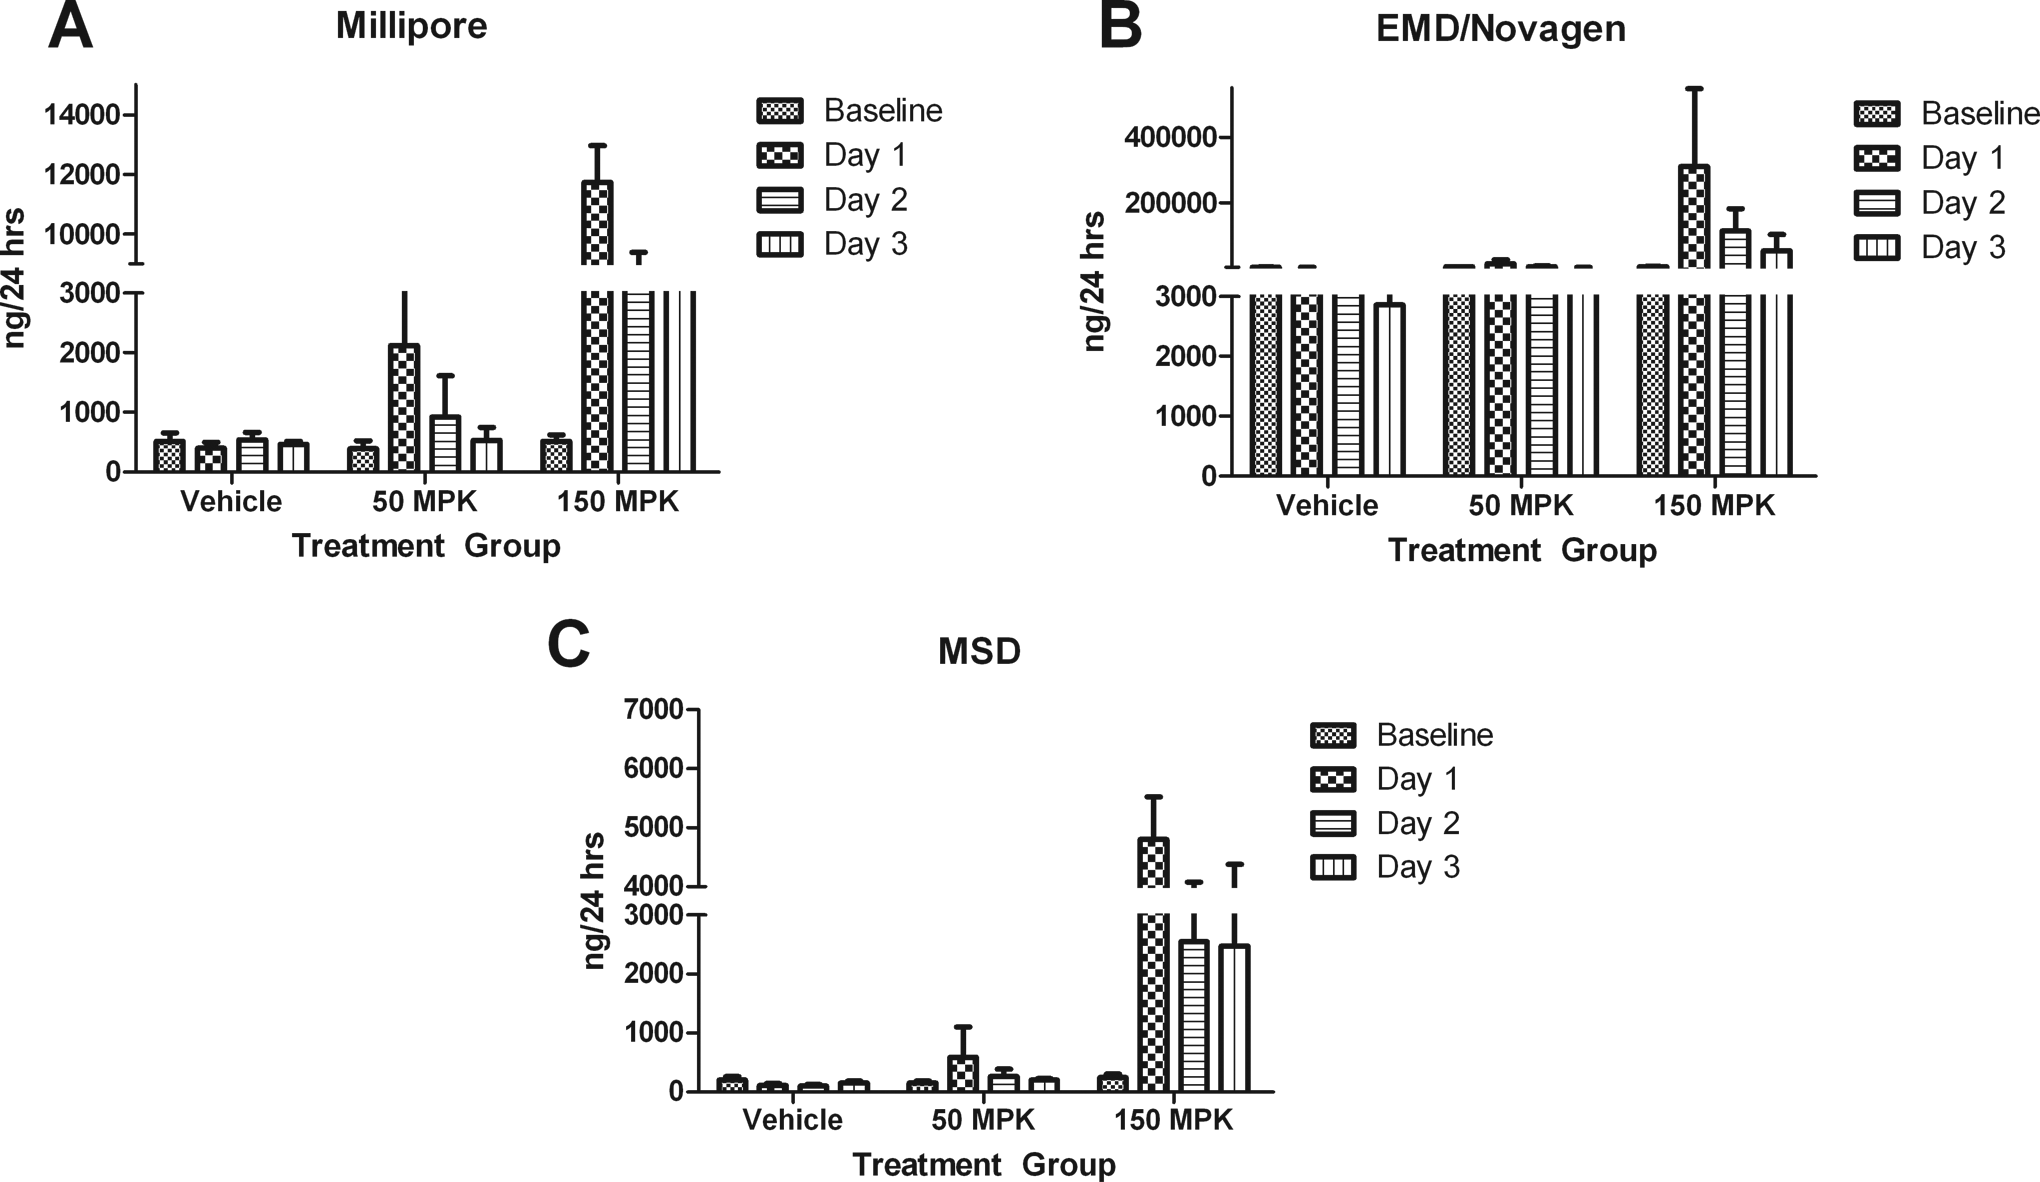
A-C, Clusterin levels as measured using Millipore, EMD/Novagen, and MSD kits, respectively. Clusterin was significantly elevated in both the 50-mg/kg (P < .01) and 150-mg/kg (P < .001) dose groups only in the Millipore kit on day 1. The other kits demonstrated significant elevations (P < .001) only in the 150-mg/kg group on day 1. Data are expressed as mean ± standard deviation (SD). MPK indicates mg/kg.
Cystatin C
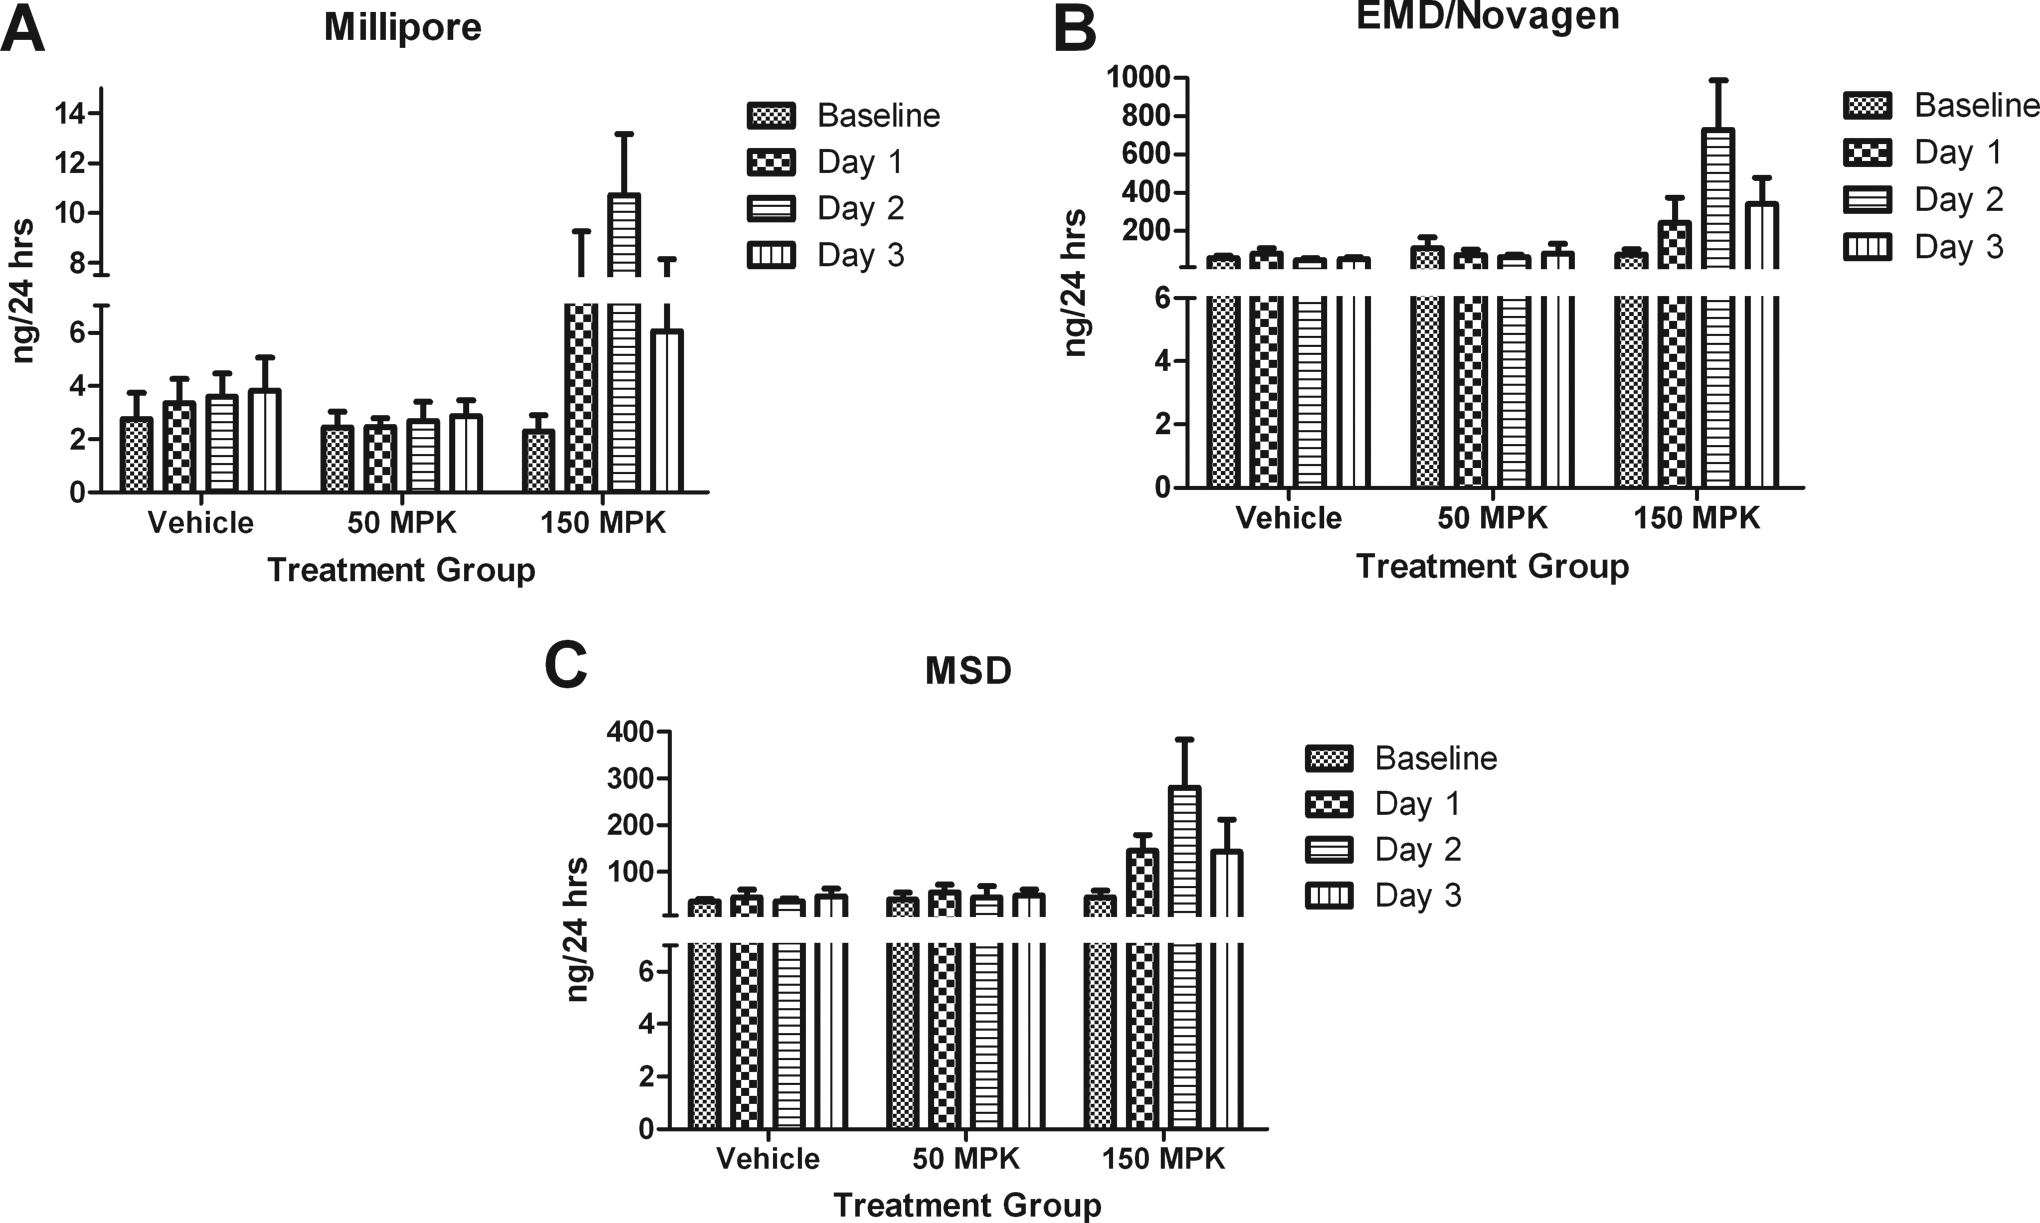
Millipore detected a 4-fold elevation in CysC at 50 mg/kg on day 1(P < .01) and a 5-fold increase (P < .001) at 150 mg/kg on day 1 in addition to a 4-fold increase (P < .01) on day 2. Comparatively, EMD demonstrated a 3-fold elevation (P < .001) at 50 mg/kg only on day 2, whereas MSD merely showed a 3-fold (P < .01) elevation at 150 mg/kg on day 2. An impairment of the reabsorption of CysC in the proximal tubules lead to fold increases (Figure 4A-C). No statistically significant differences were noted on day 3 in either dose group in any of the kits.
A-C, Cystatin C results from Millipore, EMD/Novagen, and MSD kits, respectively. Millipore was the only kit to detect significant elevations in both dose groups (50 mg/kg, P < .01 and 150 mg/kg, P < .001) on day 1. Data are expressed as mean ± standard deviation (SD). MPK indicates mg/kg.
Osteopontin
At 50 mg/kg, no statistically significant changes were seen in any of the kits on days 1 to 3. Conversely at 150 mg/kg, statistically significant increases were noted in all 3 kits on day 1 with 3-fold (P < .001) increases in all 3 kits. On day 2, statistically significant (P < .001) differences were noted in all kits, with a 5-fold increase in Millipore kit, 10-fold increase in EMD/Novagen kit, and a 6-fold increase MSD’s kit. Osteopontin began to return to baseline in all 3 kits (P < .001) on day 3 (Figures 5A-C).
Serum concentrations of UN and CREAT were significantly increased (P < .001) compared to baseline in rats treated with 150 mg/kg. Urea nitrogen levels were elevated 4-fold on day 2 and 8-fold on day 3, whereas CREAT levels were elevated 4-fold on day 2 and 7-fold on day 3. Both UN and CREAT have inherent flaws in their ability to recognize kidney toxicity early both preclinically and in humans 14 and indeed the increases we observed correlated with more severe histologic findings.
A-C, Osteopontin (OPN) results from Millipore, EMD/Novagen, and MSD kits, respectively. None of the kits were able to detect OPN at 50 mg/kg at time points tested. However, all kits demonstrated significant elevations in the 150 mg/kg dose group on all 3 days: Millipore (P < .001 all days), EMD/Novagen (P < .05 day 1, P < .001 days 2 and 3), and MSD (P < .01 days 1 and 3, P < .001 day 2). Data are expressed as mean ± standard deviation (SD). MPK indicates mg/kg.
Discussion
Because of the FDA’s recent endorsement of several early predictor biomarkers of nephrotoxicity, various commercially available multiplex kits have been developed but the comparison of these methods has not been described. The PAP renal model, a nephrotoxicant known to cause necrosis of the proximal straight tubule, 2–5 was utilized to evaluate Millipore, Meso Scale, and EMD/Novagen’s renal toxicity multiplex kits. Both Millipore and EMD/Novagen’s Widescreen Beadplex Rat Kidney Toxicity panels utilize xMAP technology and Meso Scales (MSD) Kidney Injury panels use plate-based electrochemiluminescent technology. Only biomarkers common among the 3 kits (Kim-1, CLUS, CysC, and OPN) were the focus of this study. Previously, elevations in the expression of KIM-1, 15 CLUS, 16,17 CysC, 18 and OPN 19–21 were noted as being indicative of renal insult. Sample volume requirements ranged from 25 μL to 50 μL, depending on the vendor, and all methods required predilutions: Millipore (1:500 CysC), EMD/Novagen (2-fold), and MSD (10-fold). Also noteworthy is time to assay: MSD method averaged 8 hours, while Millipore was overnight and EMD/Novagen kits averaged 5 hours. Only Millipore reports units in pg/mL EMD/Novagen and MSD both report units in ng/mL.
Differences in detection levels of each biomarker among the 3 kits varied considerably. For example, the ranges of detection for Millipore’s Kim-1 and OPN assay were 32 to 1 00 000 pg/mL, while for CysC it was 0.034 to 25 000 pg/mL and CLUS was 160 to 5 00 000 pg/mL. Comparatively, EMD/Novagen’s Widescreen KIM-1 detection levels were 0.049 to 108 ng/mL, CysC was 0.021 to 45 ng/mL, CLUS was 0.037 to 800 ng/mL, and OPN was 0.014 to 30 ng/mL, while MSD’s KIM-1 detection levels were 0.05 to 2.5 ng/mL, CysC range was 0.312 to 50, CLUS was 0.143 to 20 ng/mL, and OPN was 0.189 to 500 ng/mL. Dissimilarities noticed among the 3 kits could be due to diverse antibody pairs supplied by various sources, different sample diluents, or differences in dilution buffers.
Our study revealed markedly different results between the 3 methods. Although both Millipore and EMD/Novagen utilize xMAP technology, Millipore exhibited the most consistent results with early changes in 3 out of the 4 biomarkers following renal insult 14,16 at both dose levels. However, these changes were not always dose dependent as demonstrated with OPN. It is important to consider that PAP administration is expected to cause proximal tubular damage; as a result, elevation of all evaluated biomarkers might not be expected at the same time. Osteopontin elevations are more specific to distal tubular/loop of Henle lesions, 22 for instance. Moreover, OPN is present in normal kidney and plays a role in regeneration of proximal renal tubule cells. 23 ,24 Serum UN and CREAT were elevated only in rats administered 150 mg/kg; however, both UN and CREAT have inherent flaws in their ability to recognize kidney toxicity early both preclinically and in humans, 14 and indeed the increases we observed correlated with more severe histologic findings.
In conclusion, our study revealed differing results among the 3 kits, with the Millipore assay showing expected results of renal insult indicated by 3 out of the 4 biomarkers at both dose levels and time points. Reasons for this are unclear, and additional studies are required to determine the validity of these results. This study did not explore the current status of these kits in terms of their validation. 25 However, future studies could entail the investigation of different nephrotoxicants expected to cause dysfunction of other portions of the nephron with concurrent histopathology or an immunohistochemical marker to precisely map the location of renal damage. For now, when considering which kit to use, it is recommended that the same kit be used throughout the project for consistency.
Footnotes
Acknowledgments
The authors thank Kimbie Palacio for her in vivo study support. We also thank Penne Venne for her lead role in necropsy and for processing and staining the kidney sections from DSRD La Jolla.
Declaration of Conflicting Interests
The author(s) declared no potential conflicts of interest with respect to the research, authorship, and/or publication of this article.
Funding
The author(s) received no financial support for the research, authorship, and/or publication of this article.