
Abstract
The kidney is one of the main targets of drug toxicity, and early detection of renal damage is critical in preclinical drug development. A model of cisplatin-induced nephrotoxicity in male Sprague Dawley rats treated for 1, 3, 5, 7, or 14 days at 1 mg/kg/day was used to monitor the spatial and temporal expression of various indicators of kidney toxicity during the progression of acute kidney injury (AKI). As early as 1 day after cisplatin treatment, positive kidney injury molecule-1 (Kim-1) immunostaining, observed in the outer medulla of the kidney, and changes in urinary clusterin indicated the onset of proximal tubular injury in the absence of functional effects. After 3 days of treatment, Kim-1 protein levels in urine increased more than 20-fold concomitant with a positive clusterin immunostaining and an increase in urinary osteopontin. Tubular basophilia was also noted, while serum creatinine and blood urea nitrogen levels were elevated only after 5 days, together with tubular degeneration. In conclusion, tissue Kim-1 and urinary clusterin were the most sensitive biomarkers for detection of cisplatin-induced kidney damage. Thereafter, urinary Kim-1 and osteopontin, as well as clusterin immunostaining accurately correlated with the histopathological findings. When AKI is suspected in preclinical rat studies, Kim-1, clusterin, and osteopontin should be part of urinalysis and/or IHC can be performed.
Introduction
Proximal tubular injury due to drug-induced nephrotoxicity occurs more frequently than other nephrotoxic effects, reflecting the high number of xenobiotics that are reabsorbed and excreted within the proximal tubule. The evaluation of nephrotoxicity is therefore important for determination of the safety of drug candidates. In addition to several urinary tests (e.g., urine density, dipstick analysis, and microscopy of urine sediment), blood urea nitrogen (BUN) and serum creatinine are the traditional clinical pathology markers for detecting kidney injury. Neither markers are, however, very specific nor very sensitive, as there is usually a significant loss of renal function and renal mass before BUN and creatinine increase. Furthermore, their levels are also affected by a range of other parameters, as the synthesis and release of BUN into the blood depends on protein intake, catabolism, and liver function, whereas serum creatinine levels depend on muscle mass, age, and dehydration status.
It is therefore clear that there is a need for more specific and sensitive biomarkers not only in clinical settings but also in preclinical development, allowing early detection of potential nephrotoxic drug candidates. In recent years, collaborative cross-pharma projects, also involving regulatory agencies, have delivered new tools for improved assessment of nephrotoxicity, but also for improved clinical care and increased diagnostic performance (Dieterle et al. 2008, 2010; Vaidya et al; 2010). The Predictive Safety Testing Consortium (PSTC), organized by the Critical Path Institute (C-Path), qualified a “kidney biomarker panel,” including Kim-1, clusterin, albumin, total protein, β2-microglobulin, cystatin C, and trefoil factor 3 (TFF3) in urine that was approved by the FDA and EMEA in the context of nonclinical drug development (FDA 2008; EMEA 2008). In addition, renal papillary antigen-1 (RPA-1) was qualified by the ILSI/HESI consortium as urinary biomarker for the detection of renal collecting duct injury in male rats (EMA 2010). Other urinary renal safety biomarkers such as osteopontin, neutrophil gelatinase-associated lipocalin (NGAL), and α-gluthathione-S-transferase (α-GST) have been described in recent literature (Gautier et al. 2010; Haase et al. 2009; Yang et al. 2007) as associated with renal injury.
Some of these novel biomarkers can also be useful in other preclinical species than the rat, like Kim-1 mRNA, described as a predictive biomarker for AKI in dogs at time points earlier than serum creatinine (McDuffie et al. 2010). Furthermore, the investigation of several of the above mentioned kidney biomarkers in dogs and nonhuman primates is an ongoing effort by the PSTC.
The present study focuses on AKI in male Sprague Dawley (SD) rats after administration of CDDP (cisplatin, or cis-diamminedichloroplatinum(II)), a well-established nephrotoxicant that induces lesions in the renal proximal tubules and comprises the spatio-temporal characterization of a set of urinary biomarkers compared with the traditional end points. Kim-1, clusterin, NGAL, osteopontin, albumin, β2-microglobulin, α-GST, and RPA-1 protein levels were analyzed in urine and/or kidney samples using a combination of ELISA-techniques, multiplex biological assays, and immunohistochemical (IHC) staining.
Materials and Methods
Statement of Ethical Approval
All animal experiments were performed in accordance with the European (ETS No. 123; 2007) and Belgian (Belgian Law 1991) guidelines, and with the principles of euthanasia as stated in the “AVMA Guidelines on Euthanasia” (AVMA 2007). The experiment was approved by the Janssen Research & Development Ethical Committee and conducted in an AAALAC-approved facility.
Animals and Maintenance
Fifty male Sprague Dawley rats (Crl: CD (SD) IGS) of approximately 5 weeks of age upon arrival were supplied by Charles River Laboratories and acclimatized for 1 week before the start of the experiment. They were group-housed (5 rats/cage) in polysulphone cages with a wire-mesh roof under routine conditions of temperature, relative humidity, ventilation, and illumination. A pelleted maintenance diet (Ssniff, Germany) was available ad libitum with free and continuous access to drinking water. Prior to blood sampling, during urine collection, and prior to terminal kill, animals had access to water but were fasted (20 hr ± 30 min).
Study Design
Prior to the start of treatment, the rats were randomly allocated to each of the control or CDDP group. CDDP (Sigma-Aldrich, Germany) was prepared in sterile saline at a concentration of 1 mg/kg body weight and administered once daily via the intraperitoneal route (ip) for 1, 3, 5, 7, or 14 days. Control animals received sterile saline at the same volume dosage according to the same schedule.
Urine and blood samples were collected once before start of treatment, on days 1, 3, 5, 7, and 14. Urine samples were collected on ice overnight during approximately 20 hr via individual metabolic cages, aliquoted, and stored at approximately –80°C until analysis. Blood for clinical chemistry was collected from fasted rats from the sublingual veins after isoflurane anesthesia. On days 1, 3, 5, 7, and 14, 5 treated and 5 control animals were euthanized. The study design is depicted in Table 1.
Experimental design.
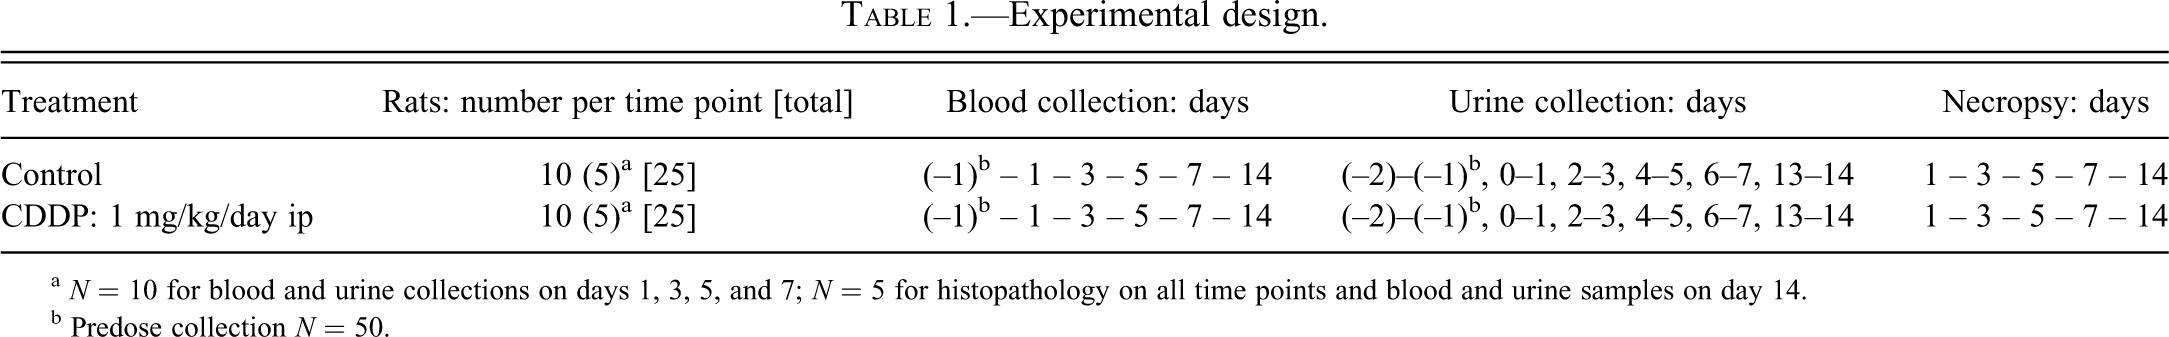
a N = 10 for blood and urine collections on days 1, 3, 5, and 7; N = 5 for histopathology on all time points and blood and urine samples on day 14.
b Predose collection N = 50.
Laboratory Tests
Urine samples were analyzed for the following parameters using standard laboratory procedures: urine volume (measured gravimetrically and corrected for specific gravity), specific gravity (Urisys 2400, Roche Diagnostics, Switzerland), creatinine, total urinary protein, and urinary glucose (Hitachi Modular, Roche Diagnostics, Switzerland). α-GST and RPA-1 in urine were evaluated via enzyme immunoassay with commercial antibodies (Biotrin, Ireland). Commercially available Rat ELISA kits for detection of β2-microglobulin and clusterin were used (BioVendor Laboratory Medicine, Czech Republic). Rat albumin, Kim-1, osteopontin, and NGAL were measured in a multiplex assay, Rat Kidney Injury Panel 1, on a Sector Imager–type instrument (Meso Scale Discovery, United States).
Concentrations of urinary biomarkers were normalized to urinary creatinine, which was shown not to change in this study. Routine blood chemistry parameters, including BUN and serum creatinine, were obtained utilizing a Hitachi-Modular automated clinical chemistry analyzer and Roche reagents (Roche Diagnostics, Switzerland). Creatinine clearance was calculated from the creatinine concentration in the collected urine sample, the urine flow rate (volume/min), and the creatinine serum concentration, and corrected for body weight.
Histology and IHC
On the day of necropsy, a complete physical examination was performed and the body weight was recorded for all rats. After anesthesia with isoflurane, they were euthanatized by exsanguination via the carotid artery, and a necropsy was performed where all macroscopic changes were recorded. The brain and kidneys were weighed (the brain weights were used to calculate the kidney to brain weight ratio) and sampled together with all tissues showing macroscopic changes in 10% formalin.
Kidneys were processed routinely (trimming, embedding, sectioning at 3–5 µm, and staining with hematoxylin and eosin [H&E] histochemical stain).
Additional sections of kidney fixed by immersion in 10% buffered formalin for 48 hr and embedded in paraffin were prepared on silane-coated glass slides, and manually immunostained for Kim-1 or clusterin detection. Briefly, for the anti-Kim-1 antibody, after routine deparaffination and rehydration through gradient ethanol immersions, the slides were exposed to peroxidase-blocking solution (Dako, Denmark), then avidin and biotin blocking solutions (Dako, Denmark) according to the manufacturer. Then, normal horse serum (Vector Laboratories, USA) at 1/10 was applied for 30 min at 4°C, and the primary antibody (TIM/KIM-1, ref. AF3689, R&D Systems, USA) at 3 µg/ml was incubated for 2 hr at 4°C, a horse anti-goat biotinylated secondary antibody (Vector Laboratories, USA) was incubated at 1/200 for 30 min at room temperature, an avidine-biotine complex (VECTASTAIN Elite ABC Kit, Vector Laboratories, USA) was applied. Diaminobenzidine (Liquid DAB+, Dako, Denmark) was used as chromogen, Mayer’s hematoxylin as counterstain, then the slides were dehydrated and coverslipped with a synthetic mounting media. The buffer used in all steps was TBS (prepared in the laboratory). For the anti-clusterin antibody (Clusterin [H-330], ref. sc-8354, Santa Cruz Biotechnology Inc., USA), the protocol was similar except that the blocking steps were preceded by a heat-induced epitope retrieval step (microwave technique with Target Retrieval, pH 9, Dako, Denmark: 3 min at 600 W, then 2 × 5 min at 180 W), the primary anti-clusterin antibody was incubated for 1 hr at room temperature, and PBS (Invitrogen, USA) was used as buffer. A secondary antibody control (Burry 2011) was performed by eliminating the primary antibody (“negative control”).
Organ weight and gross and histopathology data were captured with the PathData system (PDS Preclinical Data Systems, Inc., USA) for statistical analysis and reporting. A pathologist performed the assessment of each animal and recorded the findings with a qualitative scale of 5 grades (minimal, slight, moderate, marked, severe) indicating either an increase in the number of cells affected or in the distribution of the finding, or an increase in the staining intensity, particularly for the IHC stains. The individual findings and their grades were then compiled in Tables 6 to 8.
Statistical Analysis
Routine biochemistry and biomarker data were expressed as means ± standard error (SE). The significance of differences between the CDDP-dosed group and the control group was assessed by the Mann-Whitney U-test for pairwise comparison (Siegel and Castellan 1988) (two-tailed with correction for ties). Fold-changes of serum and urinary biomarkers results were expressed versus time matched controls. Kidney weights were expressed as means ± standard deviation, and analyzed by the closed Dunn’s test (Dunn 1964). Values significantly different from control were indicated as *p < .05, **p < .01, and ***p < .001.
Results
Urinalysis and Serum Chemistry
After administration of CDDP at 1 mg/kg/day ip daily for up to 14 days, the levels of nephrotoxicity biomarkers were analyzed. Routine urinalysis and serum chemistry data are shown in Table 2. Traditional measurements for detection of renal damage were statistically (p < .05) increased from day 5 onward. Serum creatinine was increased by 2- to 3-fold on day 5, 7, and 14; and BUN showed a gradual increase from 3-fold on day 5 up to 6-fold by day 14. Glucose was detected in urine from day 5 onward (150-fold increase on day 5, 18-fold on day 7, and 5-fold on day 14, relative to controls), with no biologically relevant alterations observed in serum glucose. Additionally on day 5 and thereafter, creatinine clearance in CDDP-treated rats was decreased to 24–40% of that in control rats, signaling decreased renal functionality.
Urinalysis and clinical chemistry findings after CDDP treatment.
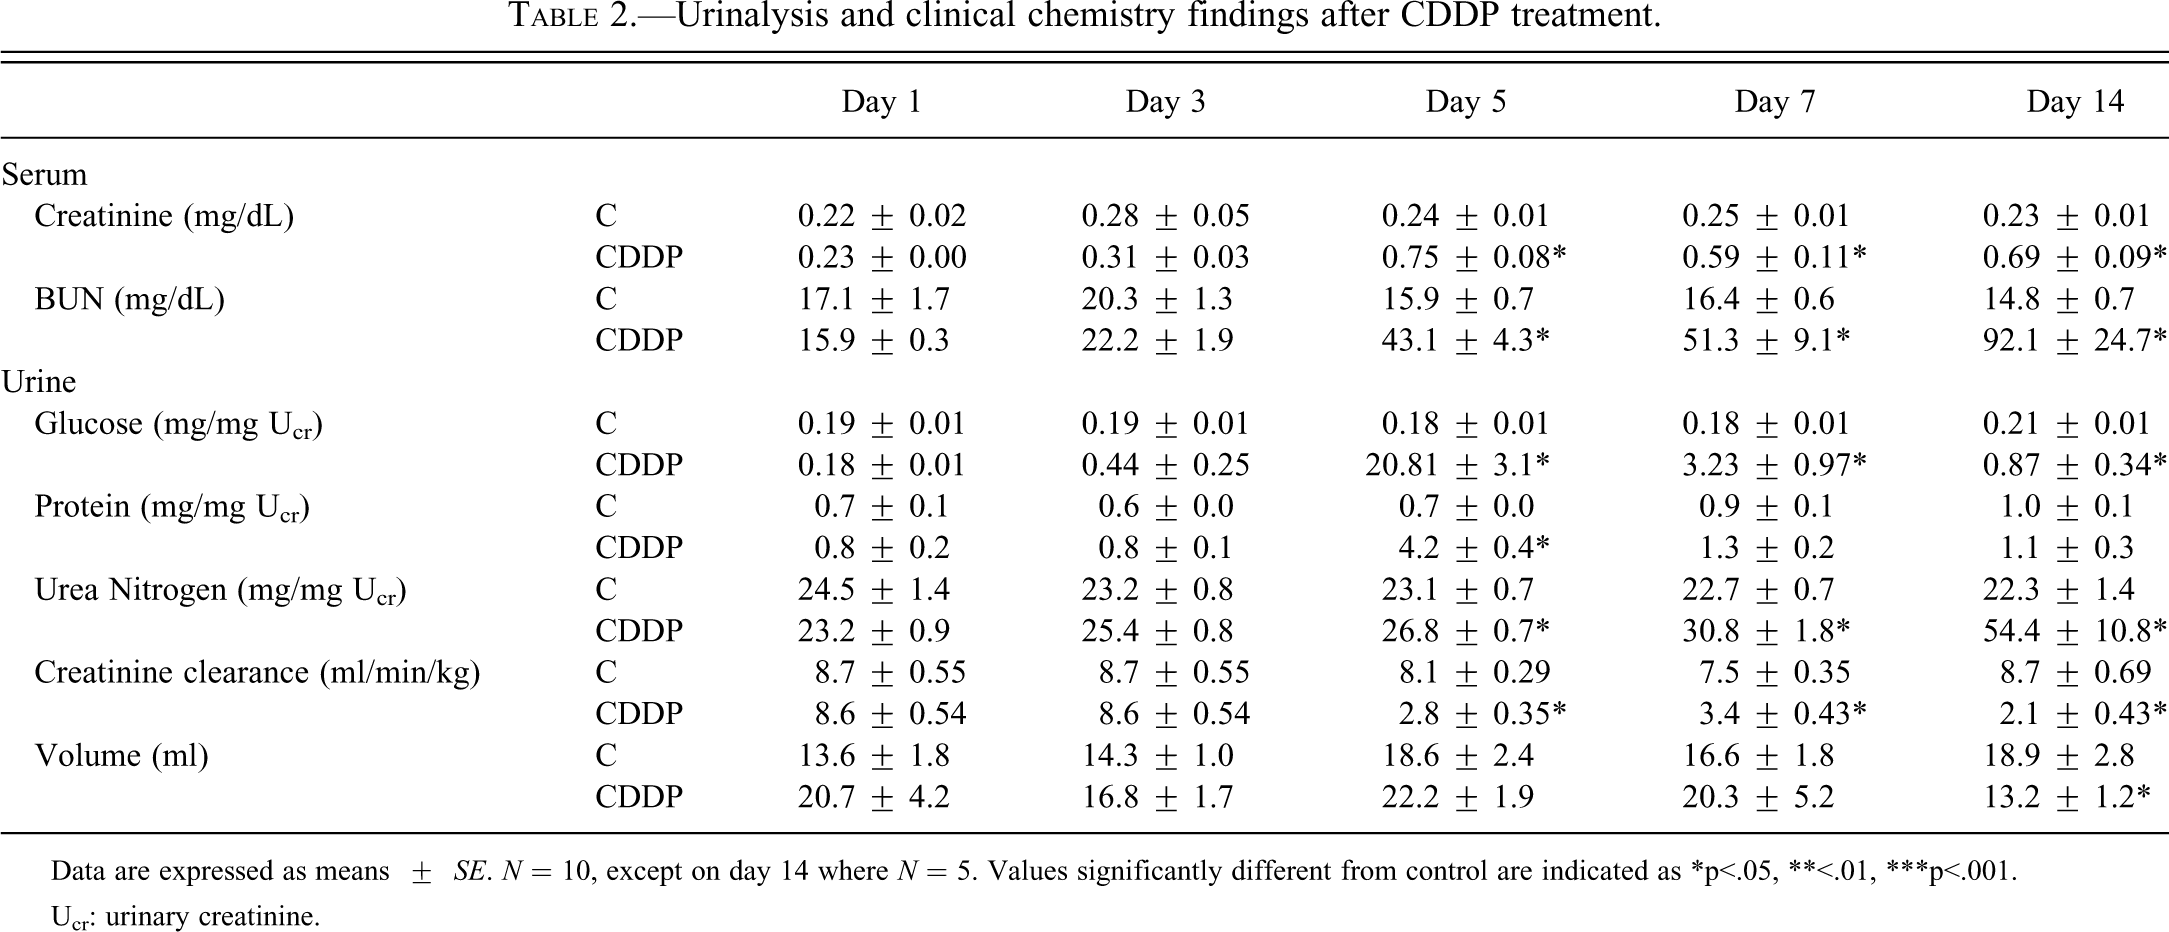
Data are expressed as means ± SE. N = 10, except on day 14 where N = 5. Values significantly different from control are indicated as *p<.05, **<.01, ***p<.001.
Ucr: urinary creatinine.
Analysis of Urinary Biomarkers
In control animals, urinary biomarker concentrations were consistent with the predose data throughout the study, except for RPA-1 and clusterin (Table 3). RPA-1 levels showed a gradual increase in control rats during the 14-day period, whereas clusterin levels in the control group were consistently lower during the treatment period than for predose values (Figure 1).
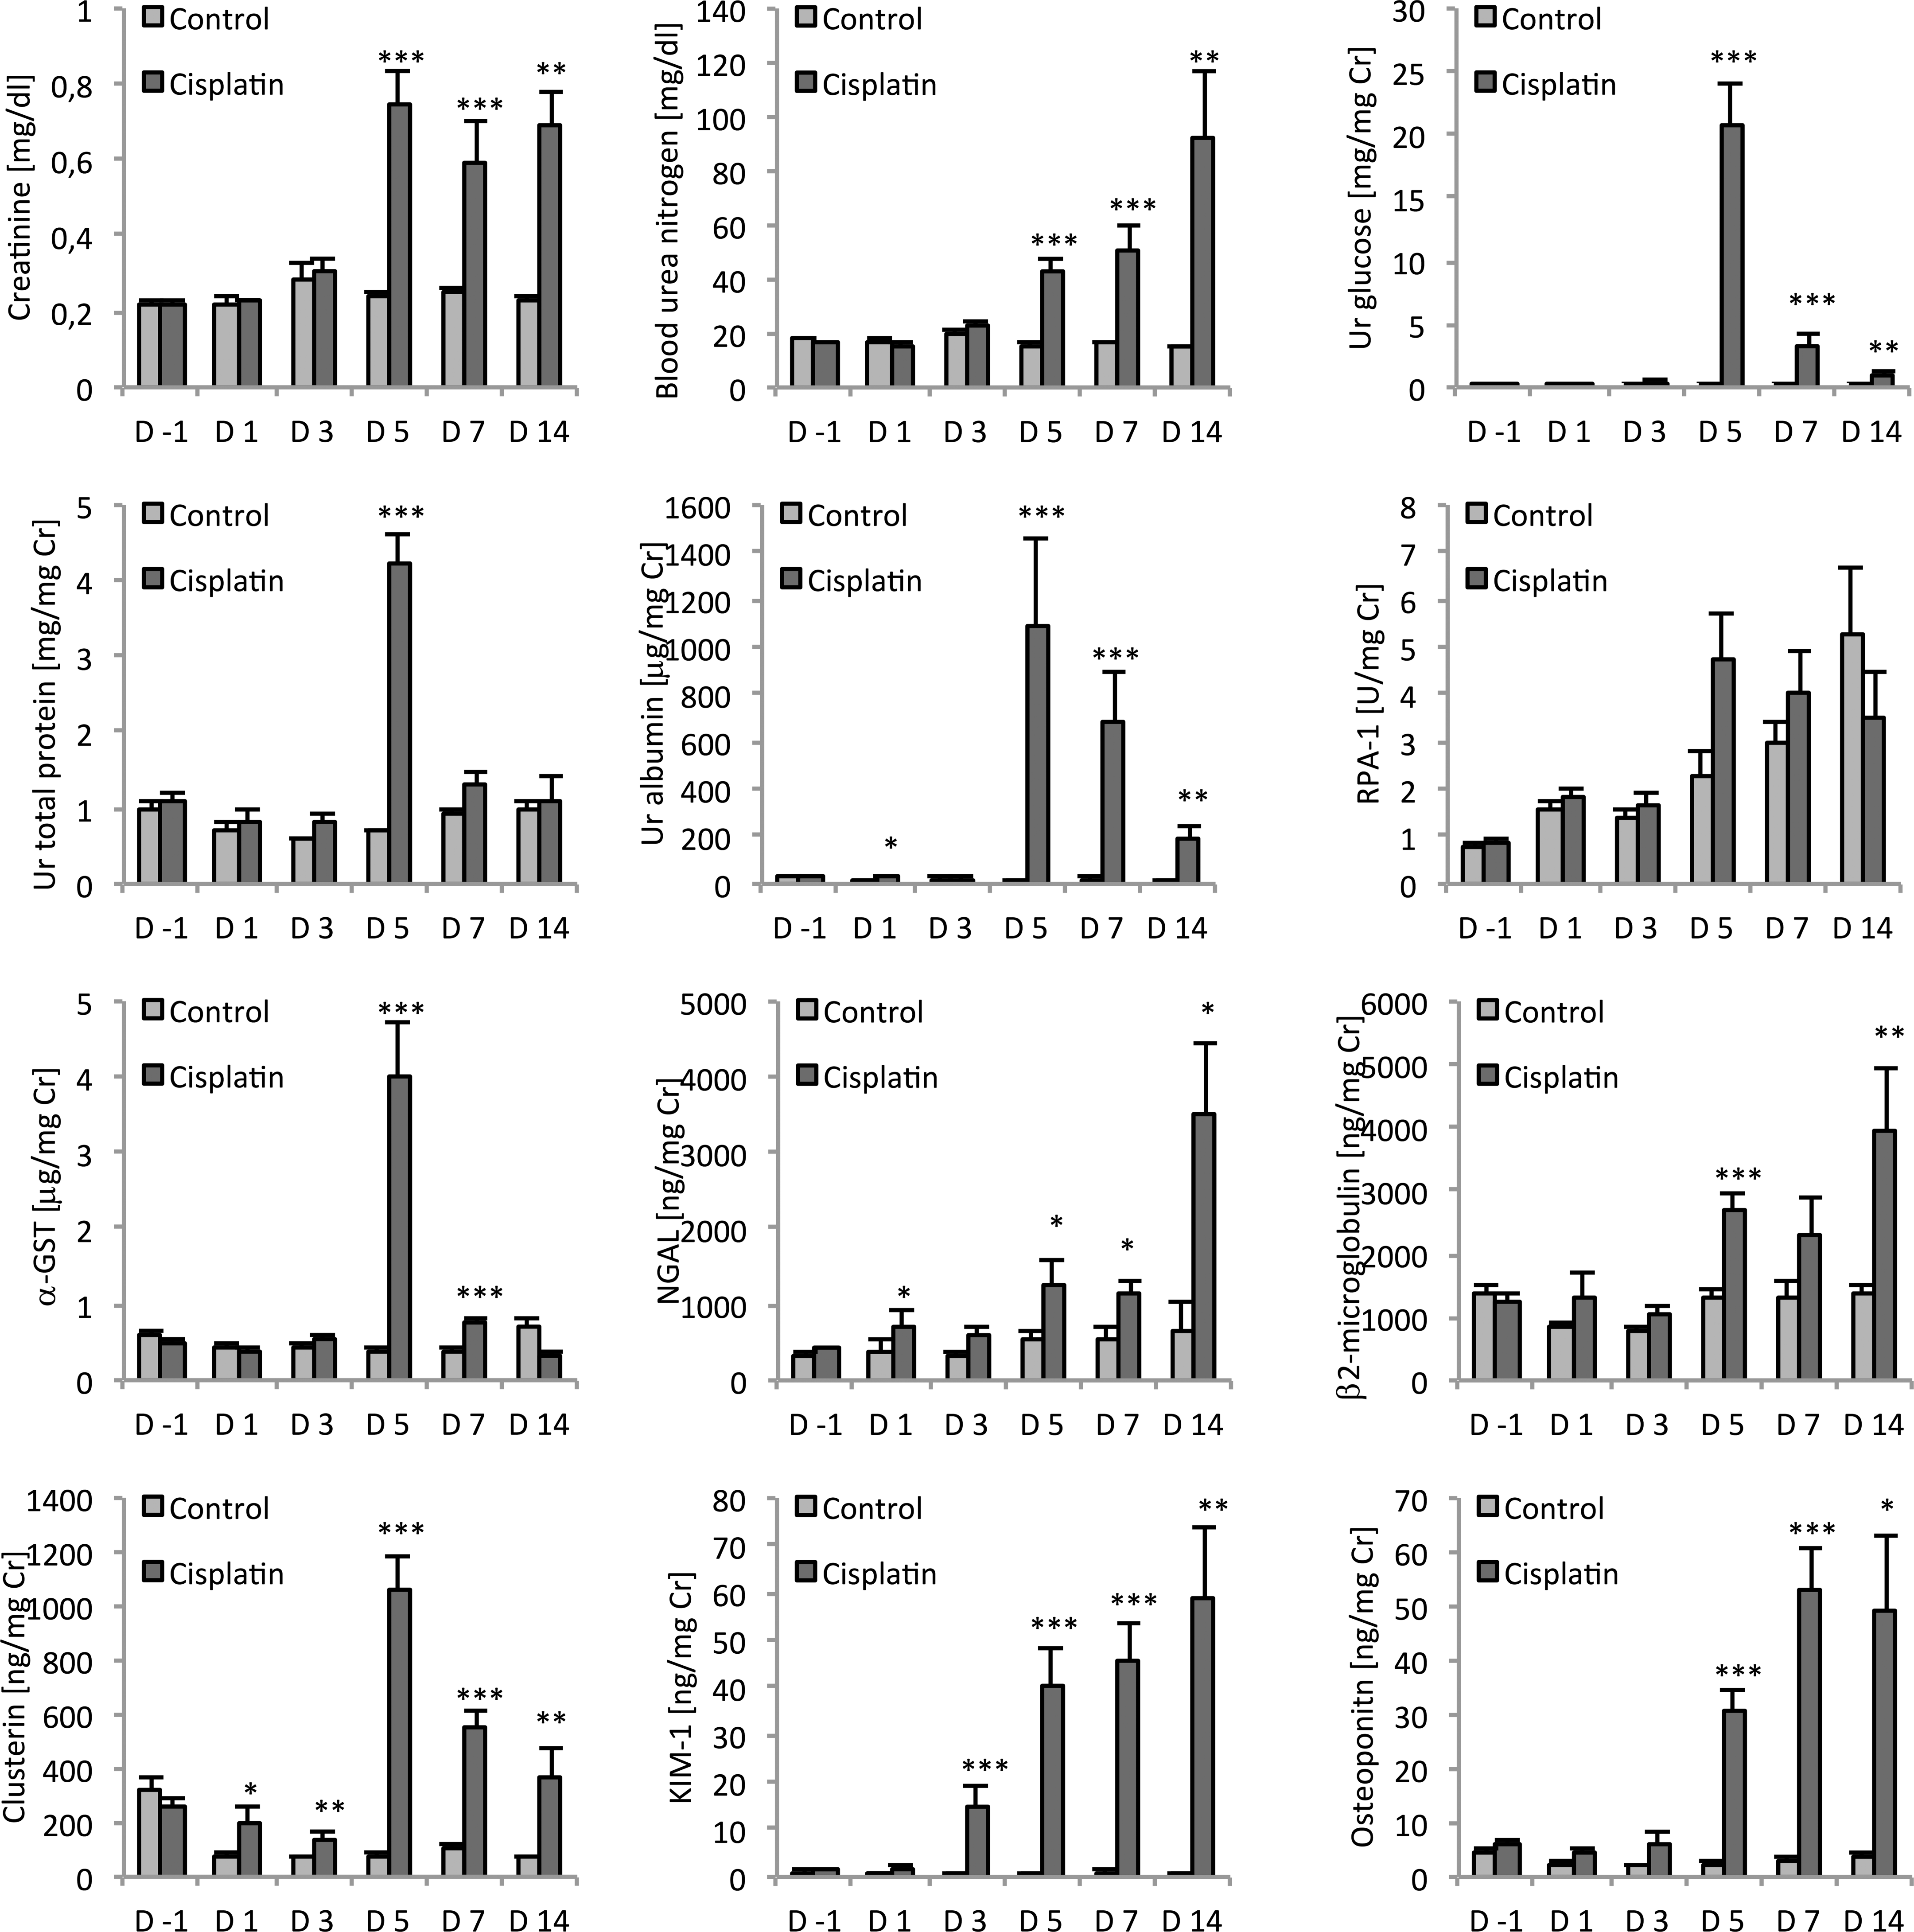
Analysis of serum (creatinine, BUN) and urinary (glucose, total protein, albumin, RPA-1, α-GST, NGAL, β2-microglobulin, clusterin, Kim-1, and osteopontin) biomarkers in male SD rats treated with CDDP (1 mg/kg) for 1, 3, 5, 7, and 14 days. Parameters were also analyzed prior to CDDP treatment on day –1 (predose). All urinary parameters are normalized to urinary creatinine. Data are expressed as means ± SE. N = 50 on day –1, N = 10 on days 1,3, 5, and 7, N = 5 on day 14. Values significantly different from control are indicated as *p < .05, **p < .01, and ***p < .001 at each sampling point.
Urinary biomarker reference ranges in untreated male Sprague Dawley rats.
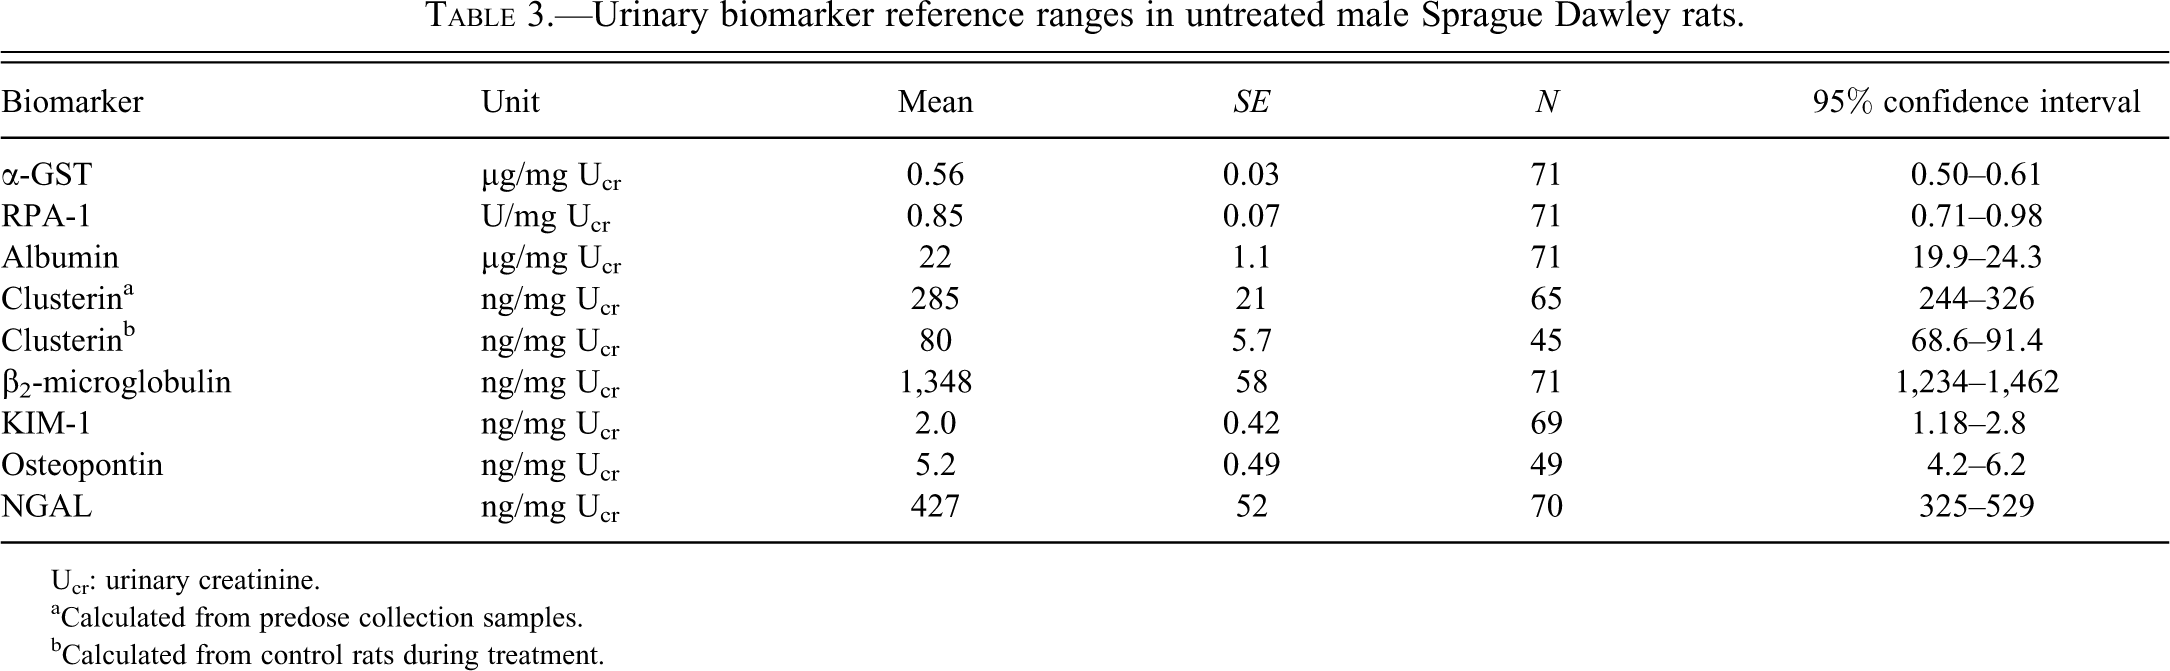
Ucr: urinary creatinine.
aCalculated from predose collection samples.
bCalculated from control rats during treatment.
Final body weights and kidney weights.
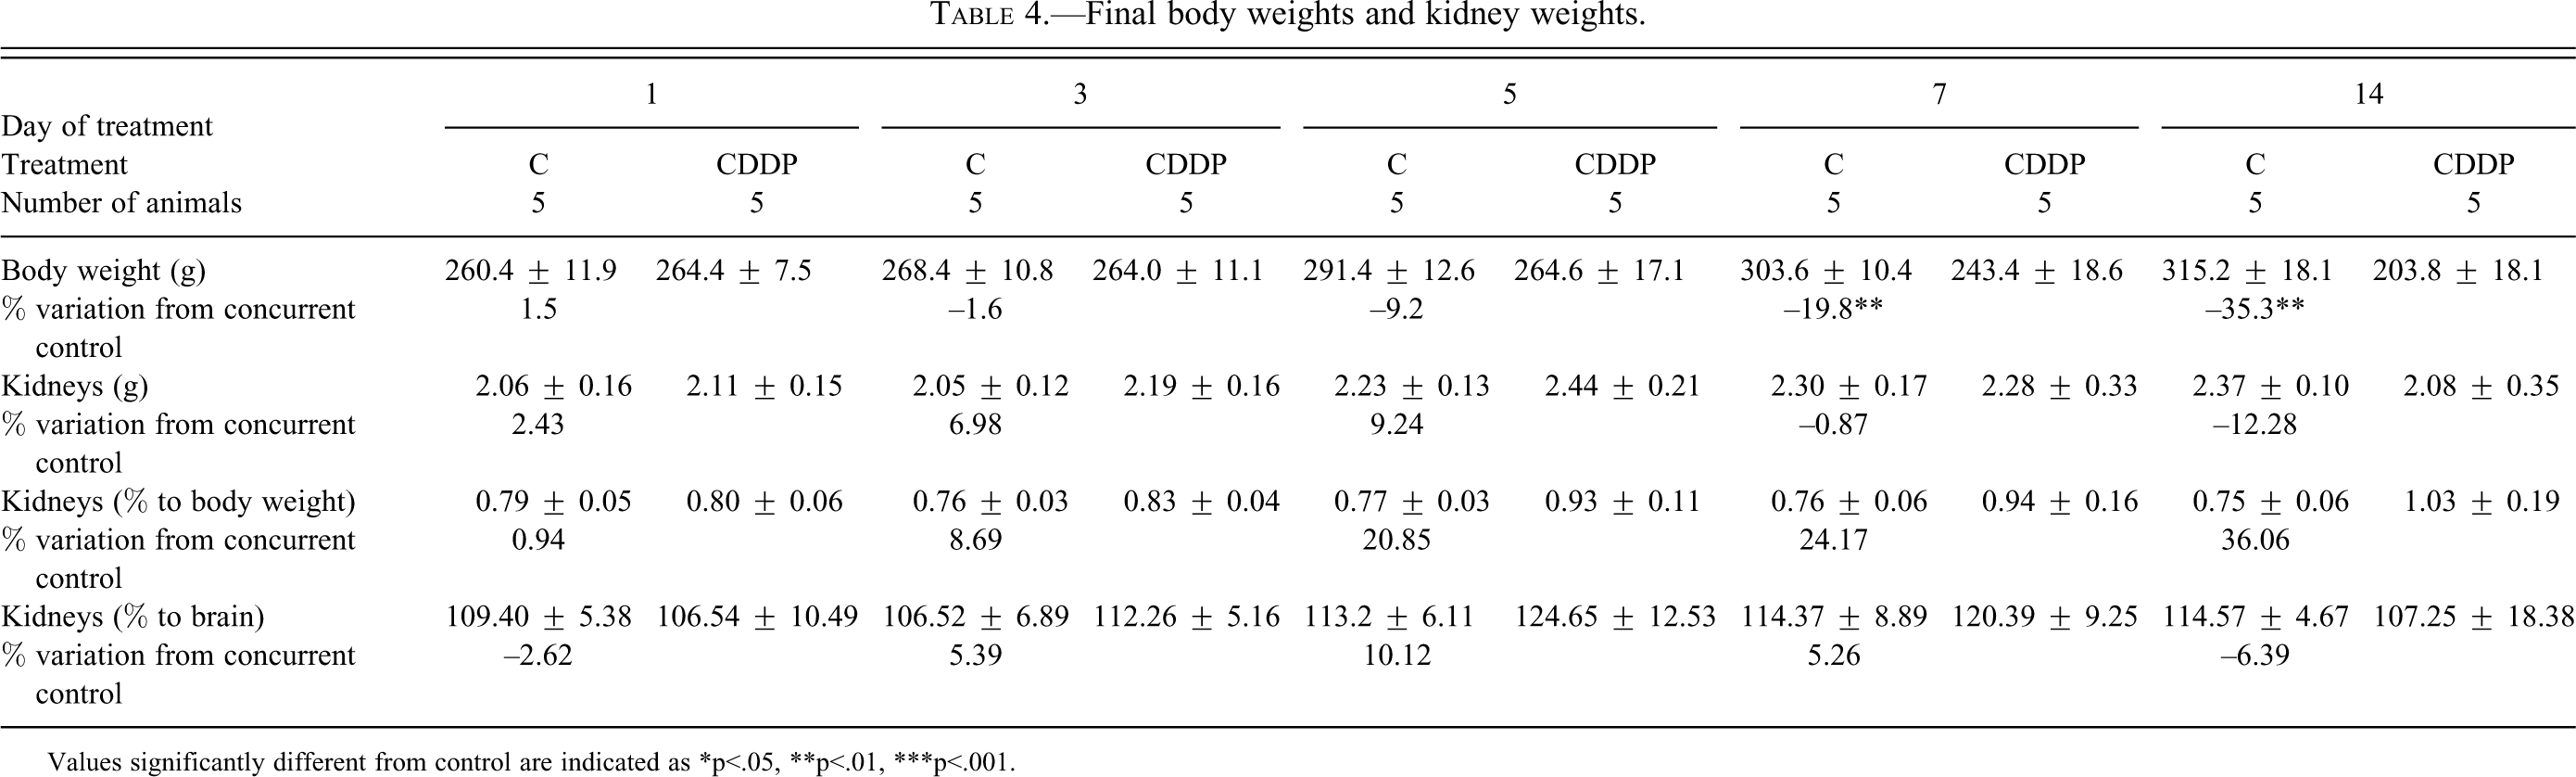
Values significantly different from control are indicated as *p<.05, **p<.01, ***p<.001.
Following repeated dosing with CDDP, the urinary concentrations of several biomarkers exhibited a time-related increase, apparent from day 1 with an increase in clusterin, urinary albumin, and NGAL. Clusterin in urine was increased 2- to 3-fold (p < .05) on day 1 and day 3 and 13-fold (p < .001) on day 5 as compared with concurrent controls. Thereafter clusterin levels declined but were still significantly increased compared with control. Urinary albumin showed an early and significant (p < .05) 3-fold increase in the CDDP group on day 1, and although there was no measurable change on day 3, remarkable increases of 73-, 29-, and 15-fold on day 5, 7, and 14, respectively, were observed. Increased urinary protein levels were detected on day 5 only. Urinary NGAL was increased in the CDDP dose group on day 1 (1.9-fold, p < .05) and on days 5, 7, and 14 (up to 5.5-fold, p < .05) but did not show a statistically significant increase on day 3.
The CDDP treated rats exhibited a marked elevation of urinary Kim-1 in a time-dependent manner starting at day 3. Kim-1 exhibited a 22-, 60-, 57-, and 79-fold increase (p < .001) compared with the control group on day 3, 5, 7, and 14, respectively. An increase in urine osteopontin concentrations in urine was detected after 3 days of treatment (3-fold increase, not statistically significant) and peaked on day 7 (18-fold increase, p < .001) in the CDDP group, although the values remained markedly elevated until the end of the study.
Urinary α-GST displayed a significant increase on day 5 (10-fold; p < .001) and day 7 (2-fold increase, p < .001) but returned to baseline values comparable with control rats by day 14. Urinary β2-microglobulin was also increased on day 5 (2-fold, p < .001) and on day 14 (2-fold, p < .01), but was comparable with control levels on day 7.
No relevant treatment-related changes were observed for RPA-1.
Body Weights, Organ Weights, Necropsy Findings
A toxicologically significant decrease in final body weights in the groups dosed for 7 or 14 days with CDDP resulted in an apparent increase in kidney to body weights (Table 4); as other weight parameters were not modified, kidney weight change was not considered toxicologically relevant. Pale discolorations were noted in the kidney (Table 5), particularly at the corticomedullary junction, with an increasing incidence from day 5 to day 14. These findings are consistent with the histopathological changes seen in these groups (tubular dilatation, accumulation of cell debris, and hyaline casts).
Macroscopic findings in CDDP-treated groups.
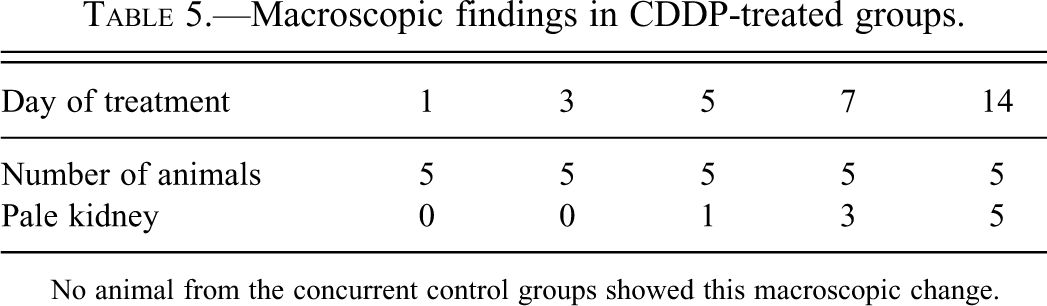
No animal from the concurrent control groups showed this macroscopic change.
Summary of histopathological observations in kidney from CDDP-treated groups (H&E staining).
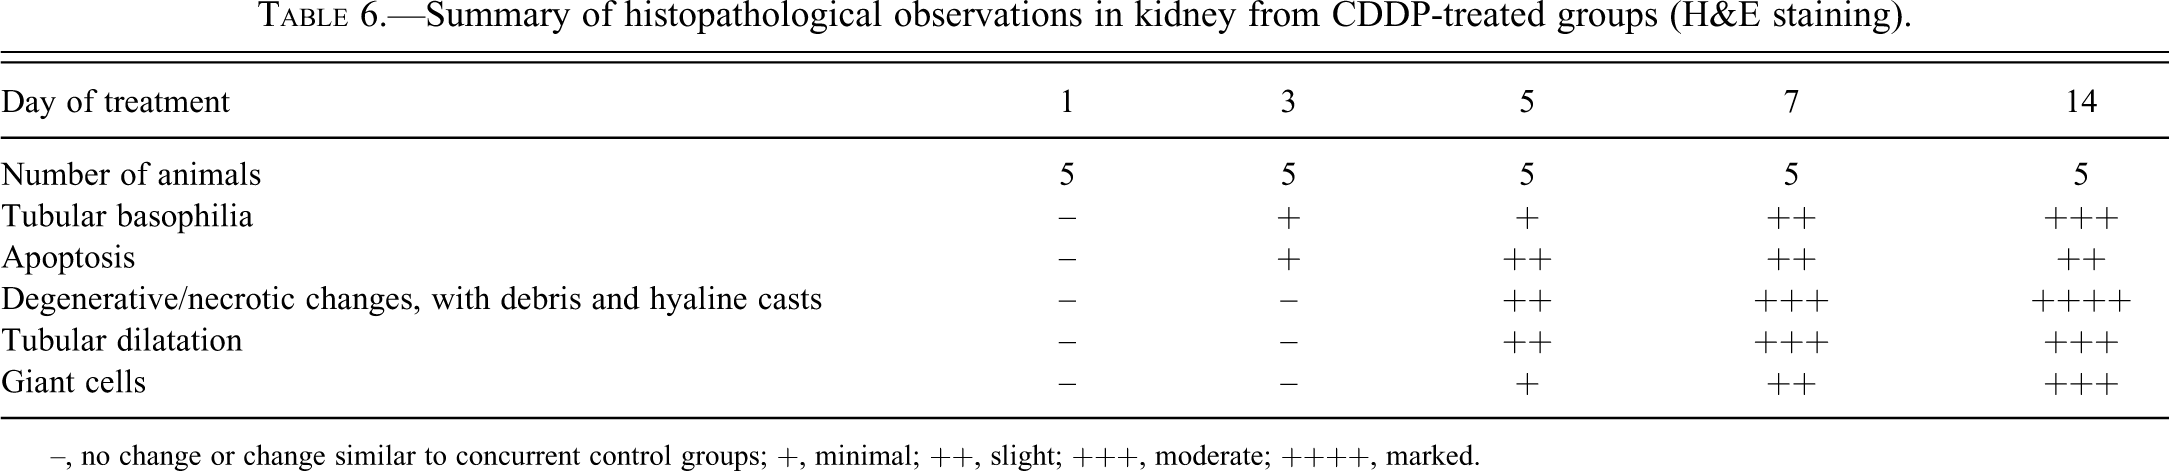
–, no change or change similar to concurrent control groups; +, minimal; ++, slight; +++, moderate; ++++, marked.
Histopathology Findings
No noteworthy findings were recorded in the control group at any time point.
Microscopic examination of H&E slides showed typical changes associated with CDDP administration (Yao et al. 2007) as shown in Figures 2 and 4. Table 6 presents the changes recorded in relevant pathological processes. Tubular basophilia with apoptosis in the pars recta of the proximal tubules (S3) close to the outer stripe of the outer medulla (OSOM), of a minimal severity, was seen after 3 days of treatment. With increased dosing duration, other degenerative changes were noted: tubular giant cells, crowded basophilic nuclei with prominent nucleoli and megalokaryosis, thickened basement membrane in basophilic/degenerative tubules; tubular necrosis; hyalin casts and cell debris/exfoliation in the lumen, tubular dilatation. The incidence and severity of the changes increased over time, and the distribution extended from the OSOM to the medullary rays (straight tubules, then upper collecting ducts), the cortex (proximal, S2 tubules), and the papilla (loop of Henle, lower collecting ducts).
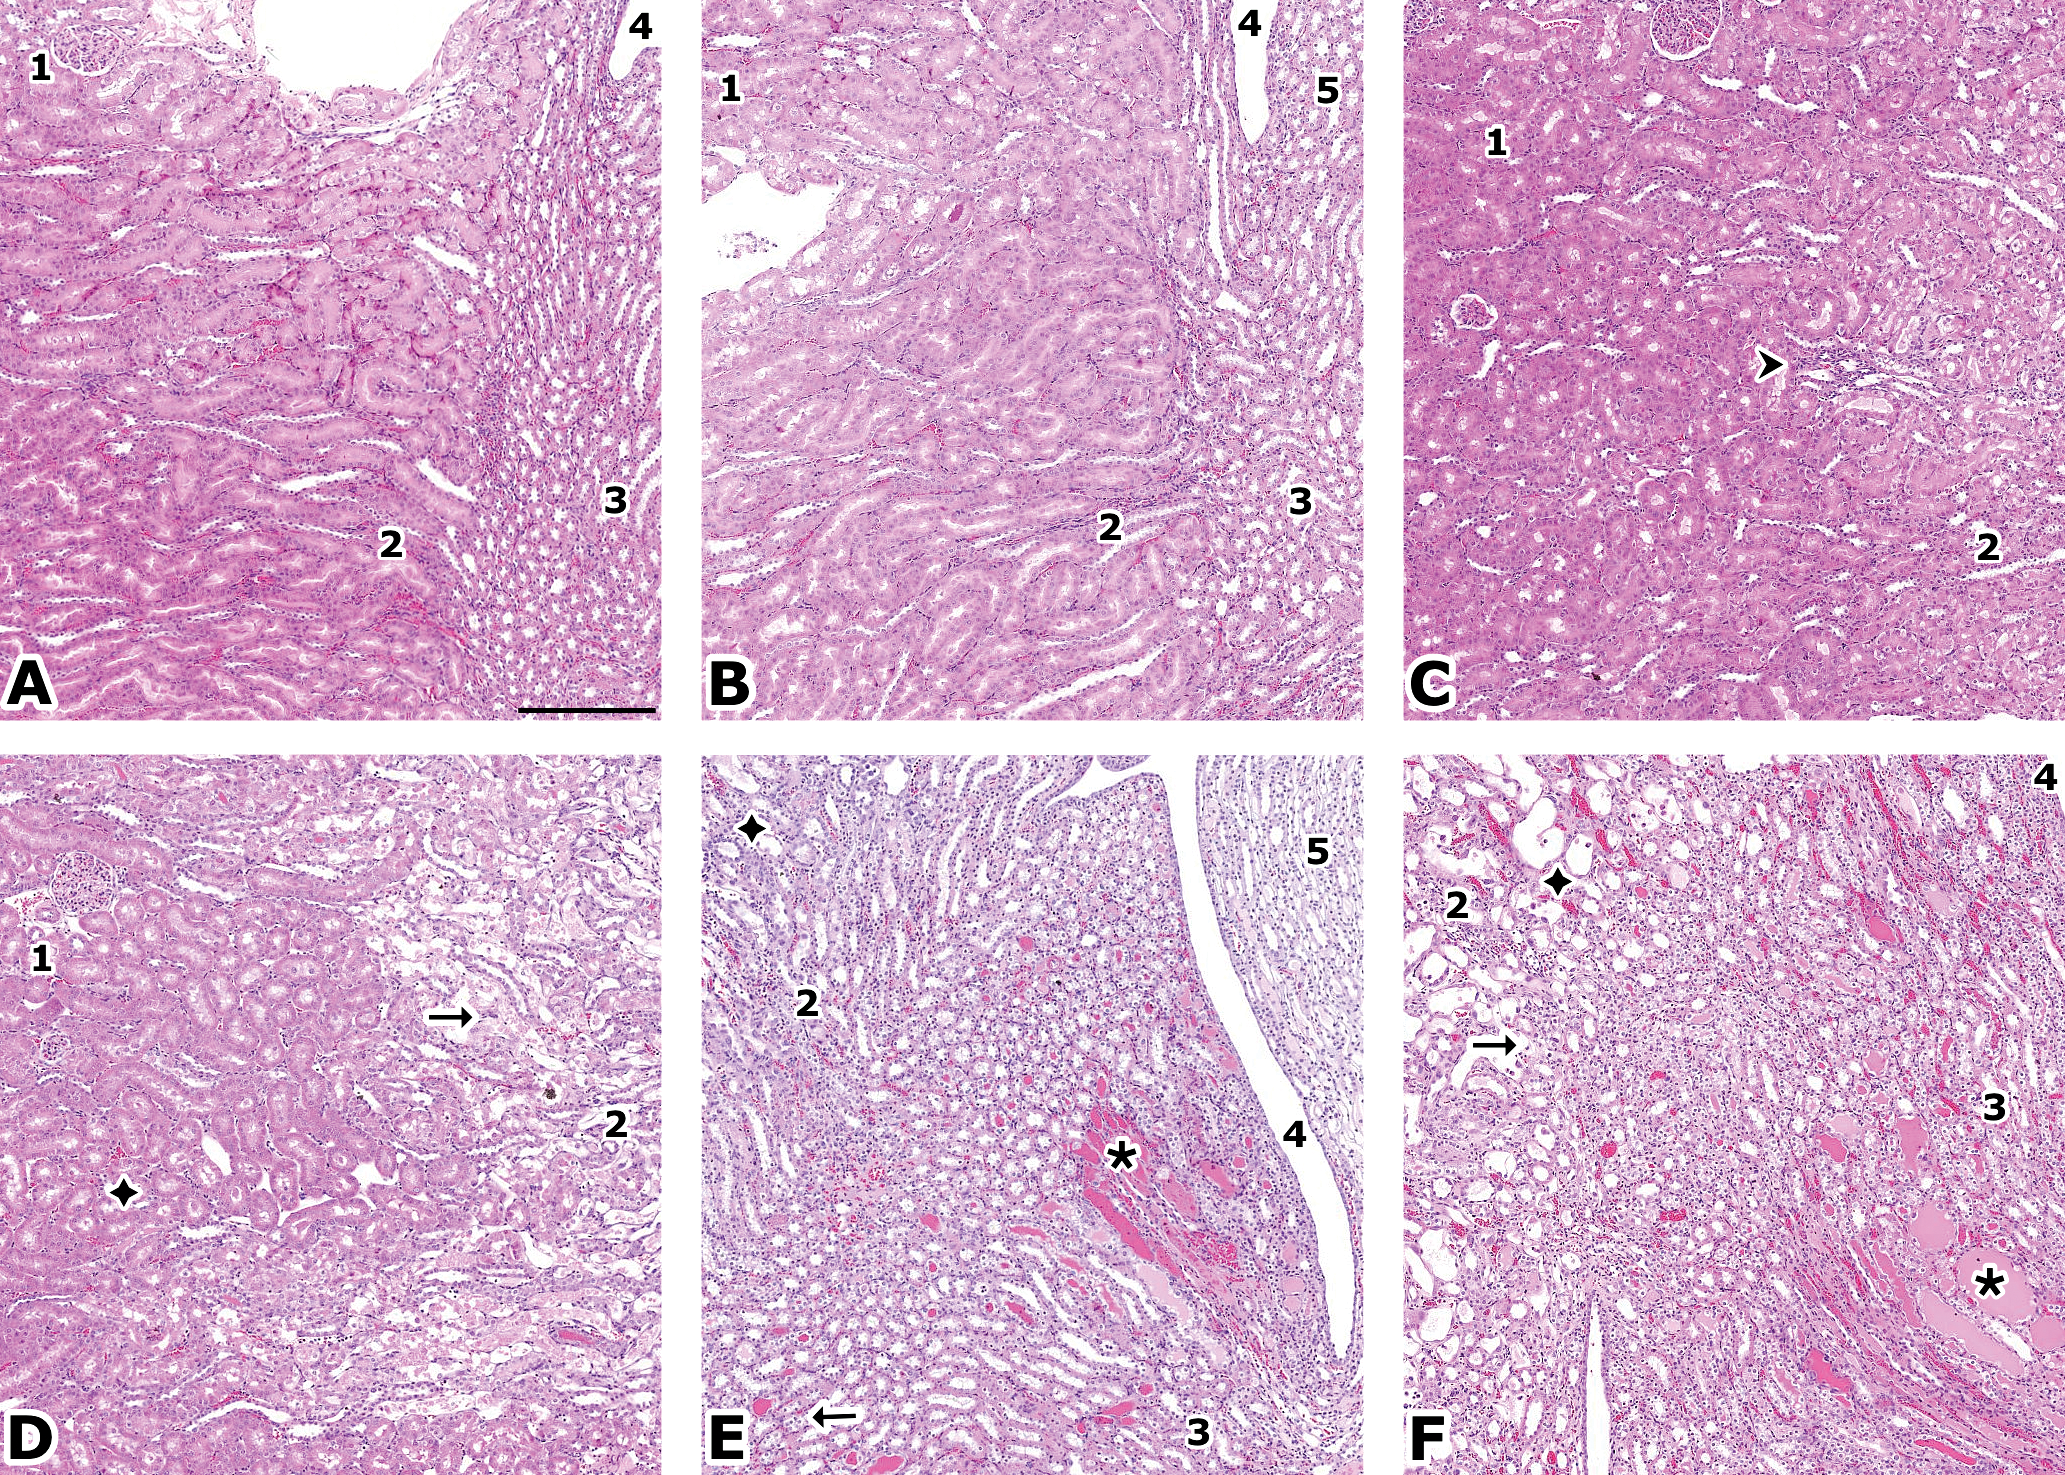
H&E stain. A (control) and B (CDDP, 1 day): no finding. C (CDDP, 3 days): basophilic tubules (
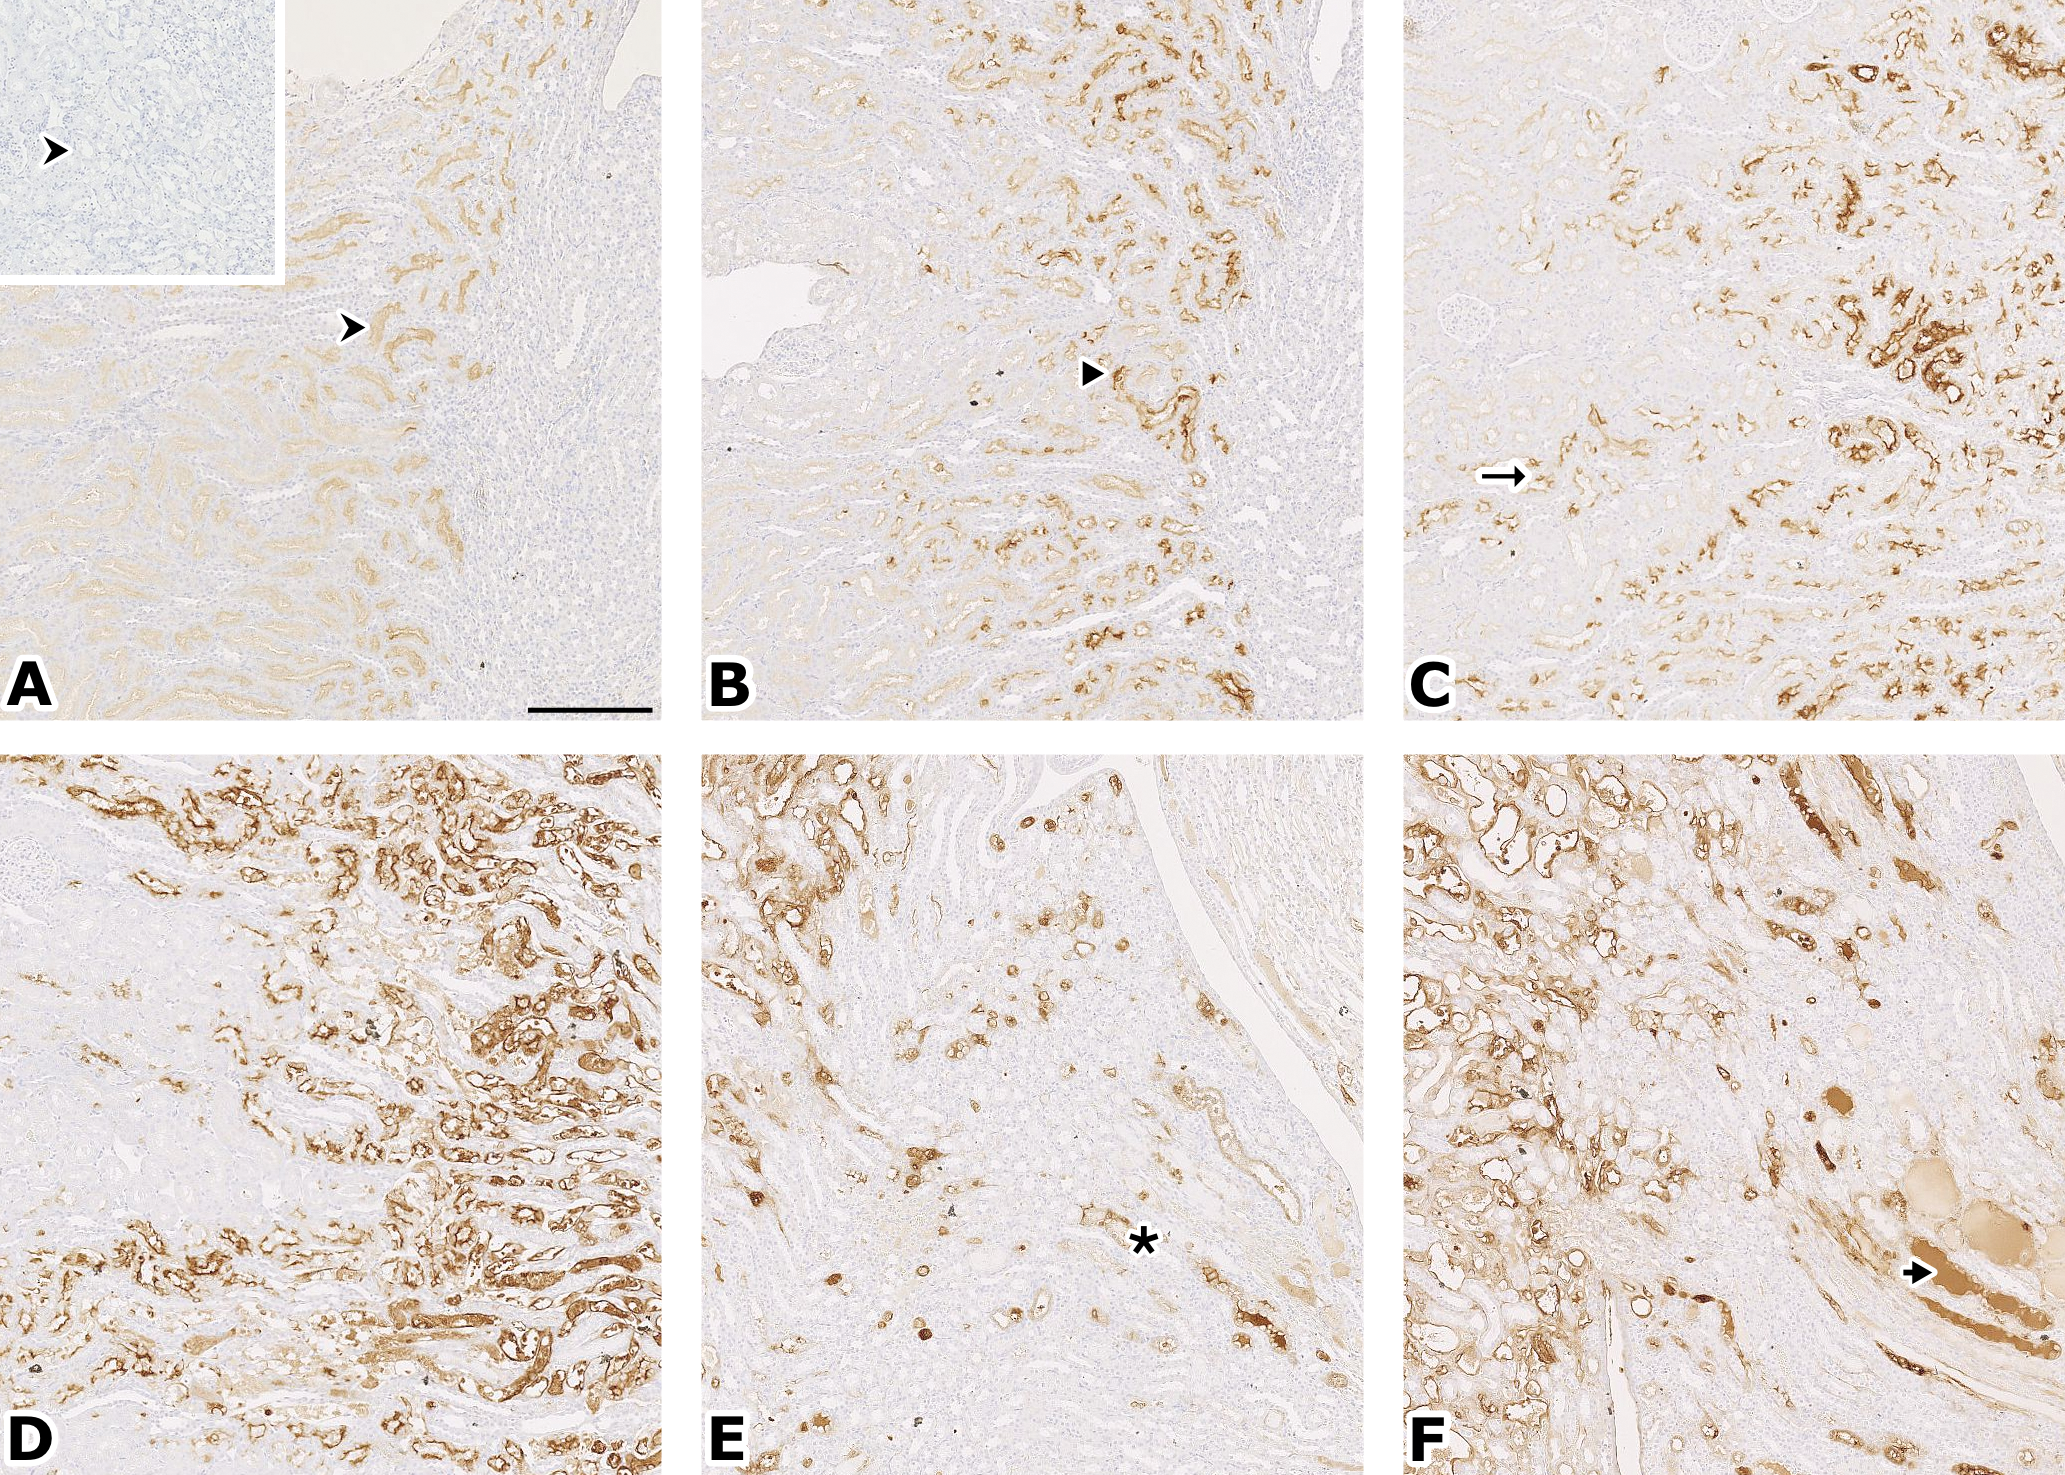
Kim-1 stain. A (control): specific cytoplasmic staining, apical, in pars recta (S3) in the OSOM (↠); insert: similar area in a negative control at higher magnification. B (CDDP, 1 day): slight cytoplasmic staining in the same area (➤). C (CDDP, 3 days) and D (CDDP, 7 days): the staining extends in the medullary rays (→) with an increased intensity. E (CDDP, 7 days): the staining reaches the collecting ducts in the medulla (٭). F (CDDP, 14 days): medullary hyalin casts are stained (➤); in the cortex, the only areas preserved are around glomeruli (not shown). Original magnification: 5×, bar = 250 µm. Respective images from Figures 2 and 3 are taken from serial sections.
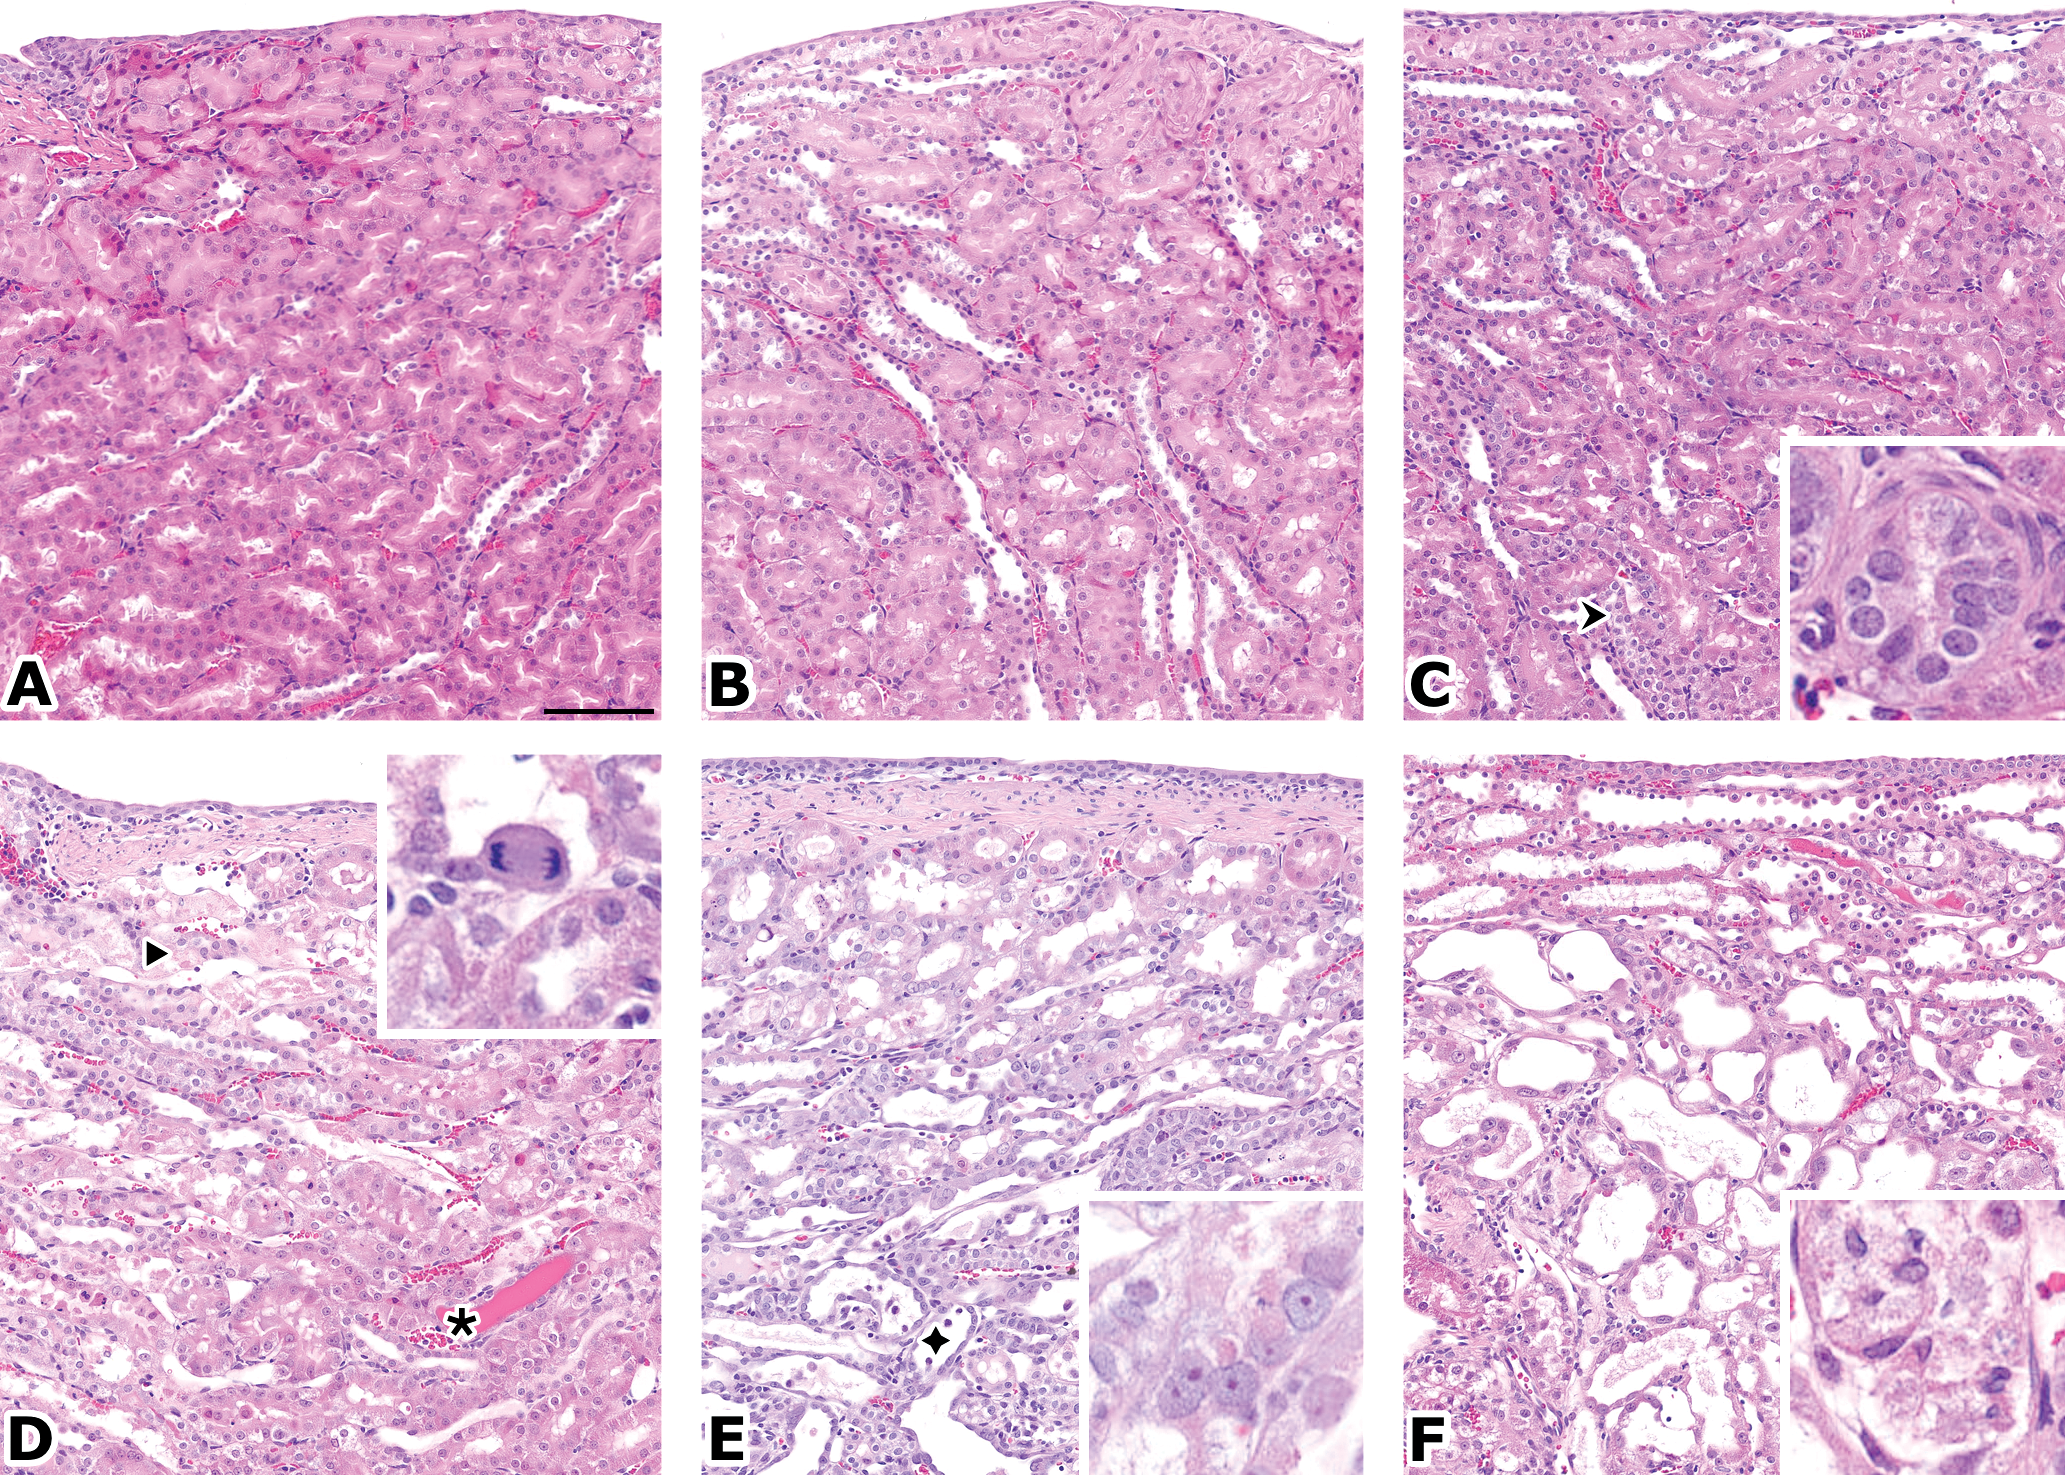
OSOM, H&E stain. A (control) and B (CDDP, 1 day): no finding. C (CDDP, 3 days): early basophilic tubules (↠) with slightly darker tubules and crowed nuclei; insert: basophilic, regenerating tubule with thickened basement membrane. D (CDDP, 7 days): degenerative tubular cells (➤) with apoptotic bodies; hyaline casts (٭); insert: mitosis of an exfoliated giant tubular epithelial cell. E (CDDP, 7 days): exfoliating cells (◆) with tubular dilation, elongating, regenerating tubular cells and inconspicuous inflammation; insert: megalokaryosis of epithelial cells, with prominent nucleoli. F (CDDP, 14 days): similar, more severe changes; insert: exfoliation of tubular cells. Original magnification: 20×, bar = 100 µm.
A minimal positive Kim-1 staining in the brush border of cells of the pars recta was detected in the control animals. In the treated animals, an increase of the specific staining was seen first in the OSOM at day 1, as summarized in Tables 7 and 8 and shown in Figures 3, 5, and 6. Its intensity and extent increased with the treatment duration, in close correlation with the histopathological changes. On day 1, the apical cytoplasm of OSOM tubular cells was stained (Figure 3B); in the later time points, all the cytoplasm and the luminal debris were stained. Conversely, the loops of Henle and collecting ducts in the papilla showed a positive staining of luminal debris first, and a cytoplasmic staining in later time points.
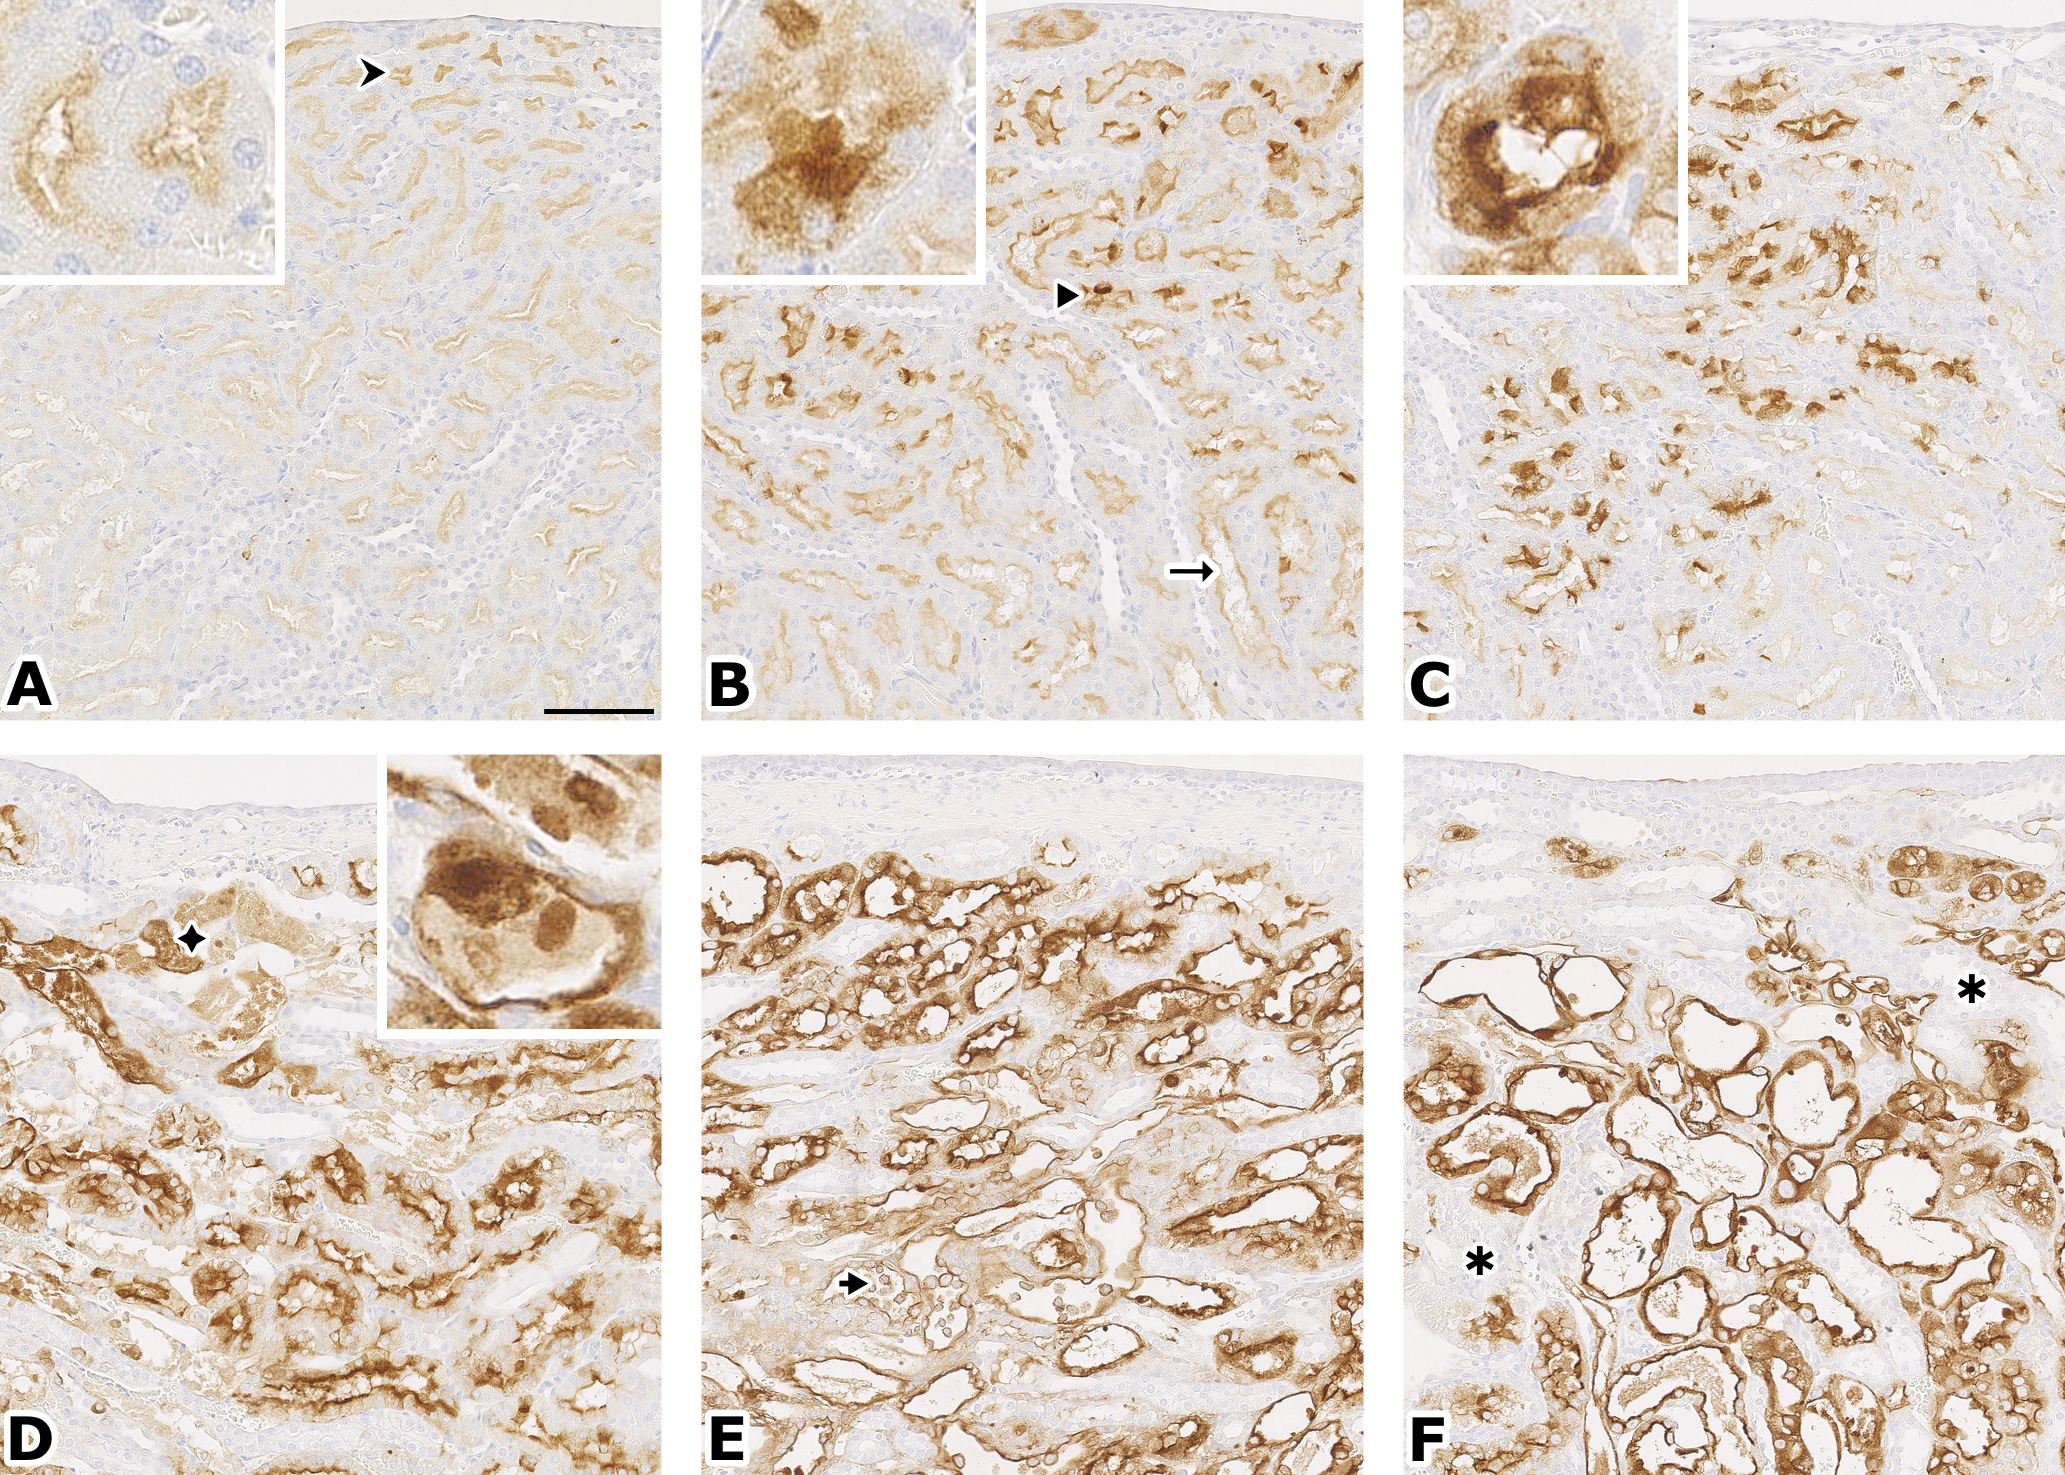
OSOM, Kim-1 stain. A (control): inconspicuous staining of some deep tubules (↠); insert: staining of apical cytoplasm and brush border. B (CDDP, 1 day): the staining is more intense and more basal (➤), and extends in the medullary rays (→); insert: cytoplasm almost completely stained. C (CDDP, 3 days): more intense staining; insert: cytoplasm completely stained in a basophilic tubule, with thickened basement membrane. D (CDDP, 5 days): most of the tubular cells are stained, but also the cell debris and hyaline casts in the tubular lumen (◆); insert: flattened, regenerating cells are also stained. E (CDDP, 7 days): the full cytoplasm is stained; note the staining of exfoliated tubular cells (➤). F (CDDP, 14 days): note rare, unstained, and intact tubules (٭). Original magnification: 20×, bar = 100 µm. Respective images from Figures 4 and 5 are taken from serial sections.
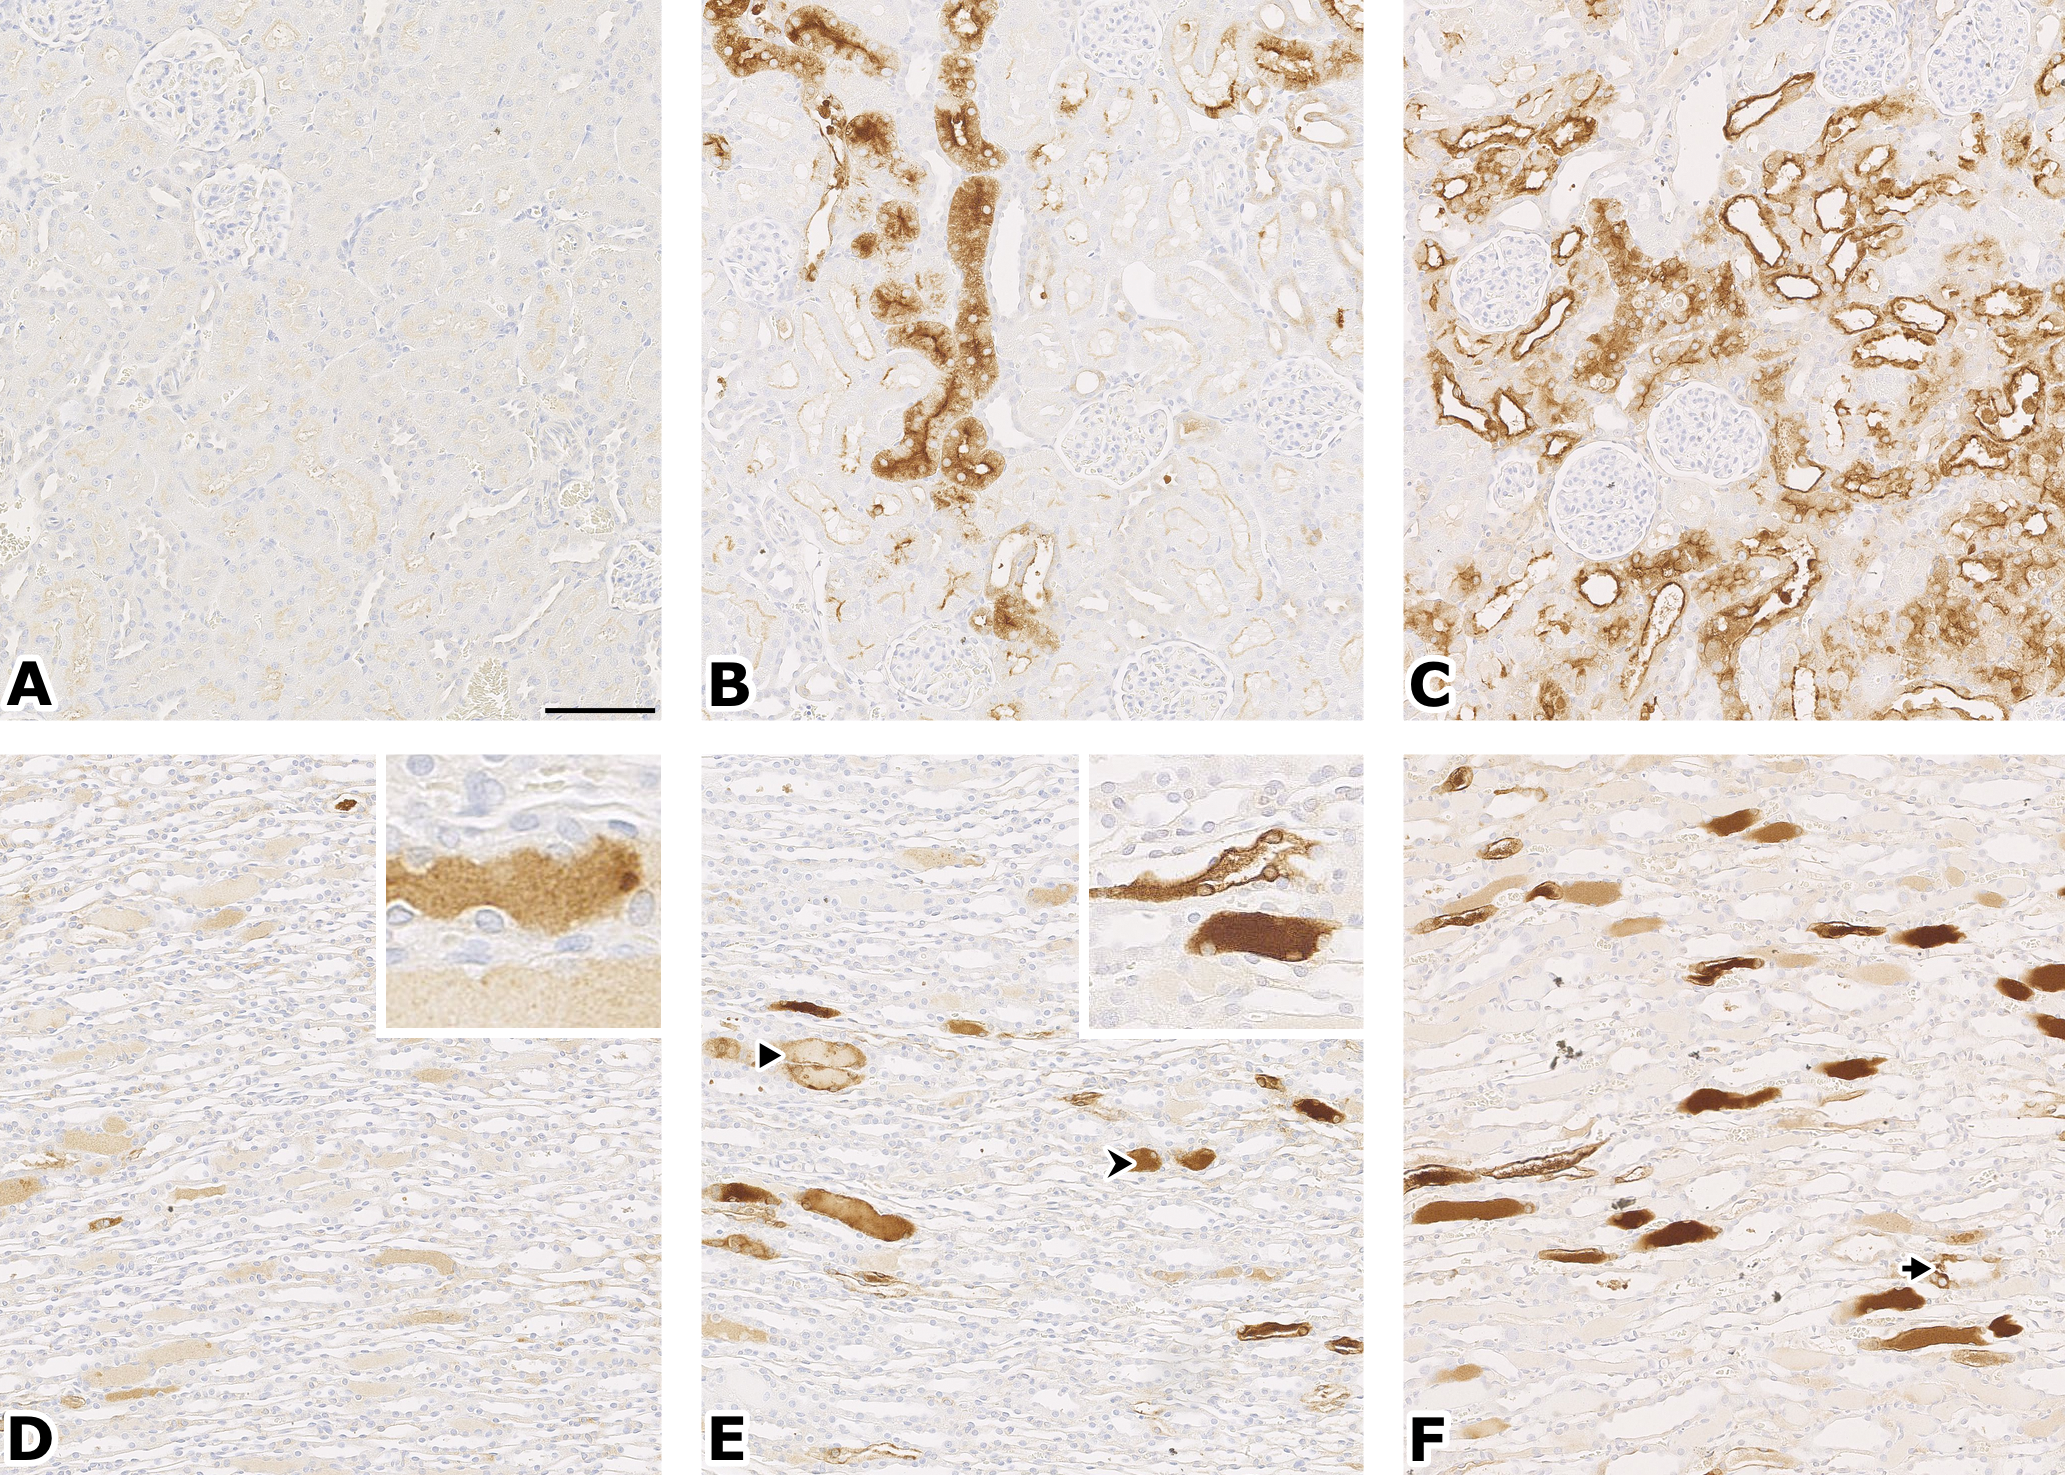
Kim-1 stain. Cortex (A, B, C); papilla (E, F, G). A (control): no staining. B (CDDP, 7 days): staining in medullary rays. C (CDDP, 14 days): staining of most cortex, except the glomerules and the tubules closest to the glomerules. D (CDDP, 5 days): staining of hyaline casts; insert: epithelial cells are not stained. E (CDDP, 7 days): hyaline cast staining in loops of Henle (↠) and collecting ducts (➤); insert: detail of stained epithelial cells and cellular debris. F (CDDP, 14 days): stronger and more frequent staining, not only of hyaline casts but also cytoplasmic (➤). Original magnification: 20×, bar = 100 µm.
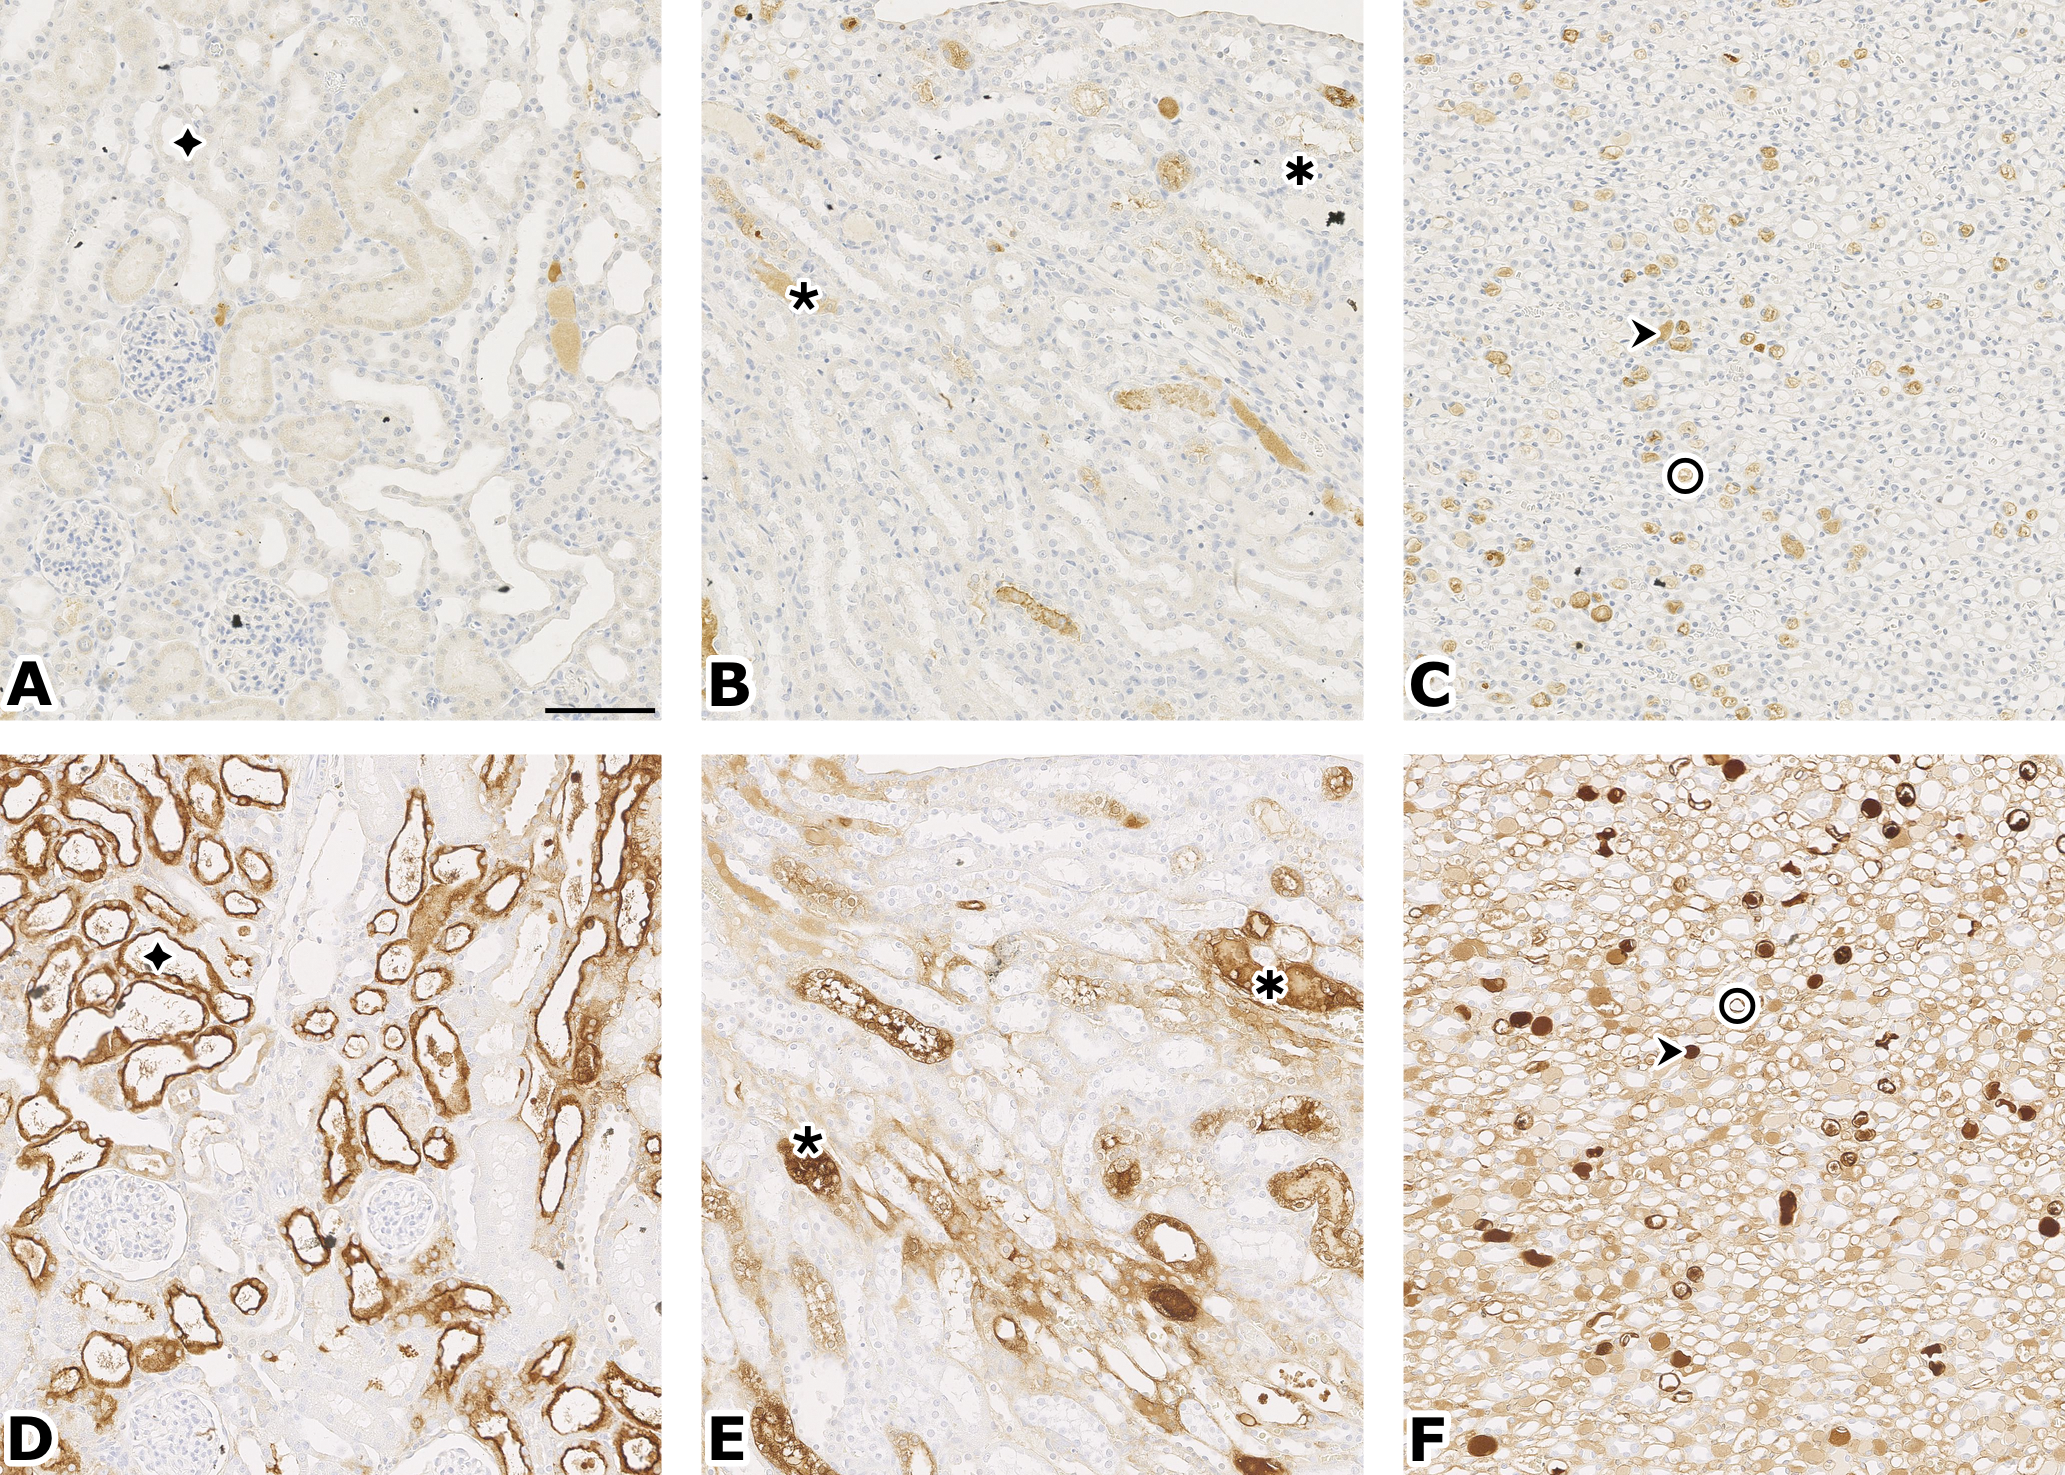
Clusterin (A, B, C) vs. Kim-1 (D, E, F) stain, same animal treated with CDDP for 14 days. Compare staining in similar areas of cortex (A, D), OSOM (B, E), papilla (C, F): tubular cells (◆), hyaline casts/debris (٭✱↠), cytoplasm in loop of Henle (O). Original magnification: 20×, bar = 100 µm.
Summary of Kim-1 staining in kidney from CDDP-treated groups.

–, no staining or similar to concurrent control groups; +, minimal; ++, slight; +++, moderate; ++++, marked.
Summary of clusterin staining in kidney from CDDP-treated groups.
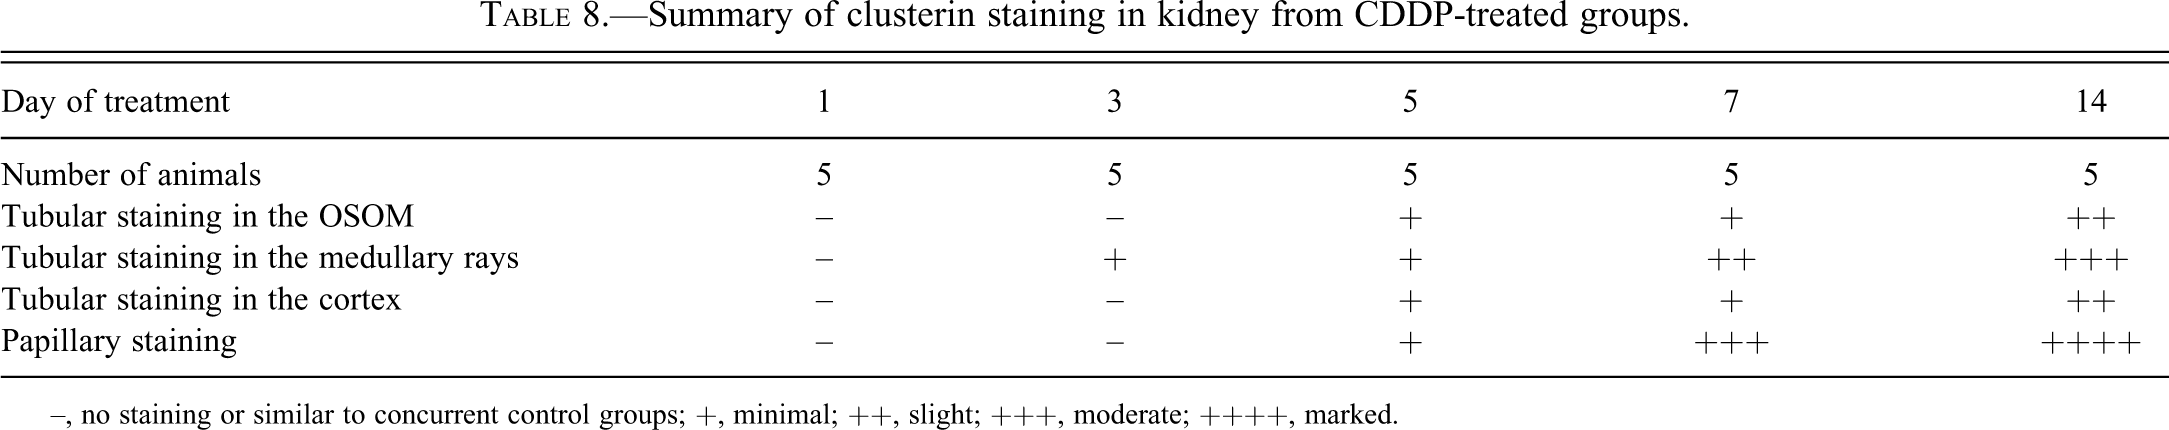
–, no staining or similar to concurrent control groups; +, minimal; ++, slight; +++, moderate; ++++, marked.
The clusterin staining followed a pattern similar to the Kim-1 staining, except that there was no positive staining at day 1, the staining was generally less intense, mainly luminal and rarely cytoplasmic (and in only 1 animal at day 3), and less areas were positively stained in the cortex and medulla, although more areas were stained in the papilla (Figure 7).
The staining similarities between Kim-1 and clusterin were exemplified in 2 animals: both markers correctly detected that the severity of the findings of 1 animal dosed for 5 days was lower than the mean of its group, while it was higher in 1 animal dosed for 3 days (however, the clusterin staining was less intense than the Kim-1).
Overall, there was a close correlation between the kidney to body weight increase (after dosing for 7 and 14 days), necropsy findings (discoloration after dosing for 5, 7, and 14 days), and microscopy (tubular and ductular degeneration to necrosis), in relation to dose duration.
Discussion
The purpose of this 2-week study was to evaluate the time course of both newly qualified and traditional nephrotoxicity biomarkers after repeated CDDP dosing in parallel with histopathology assessments, in a well-characterized model of nephrotoxicity in Sprague Dawley rats. Due to the number of time points, and to reduce the number of animals included in the study, it was decided to only use male rats. The animals were dosed daily at 1 mg/kg/day for 1, 3, 5, 7, or 14 consecutive days. The simultaneous collection of serum, urine, and kidney samples allowed us to relate the response of biomarkers in serum or urine to renal histopathology and IHC of specific biomarkers.
Histologically, administration of CDDP resulted in the expected kidney changes, namely degeneration and necrosis of the S3 segment of the renal proximal tubules (Yao et al. 2007), and confirmed the validity of our experiment.
We interpreted the minimally positive immunostaining seen in control animals as a limited specific expression of Kim-1 in untreated animals, rather than a background or nonspecific staining, because it was limited to the brush border of cells in the pars recta, very different from an edge effect seen in the subcapsular area, and there was no background staining in the negative control in our experiment. Moreover, this result is in line with previous reports of low levels of Kim-1 mRNA (van Timmeren et al. 2006) and low kidney Kim-1 protein expression (de Borst et al. 2007) in control rats.
The increase in specific Kim-1 IHC staining allowed detection of the kidney damage as early as 24 hours after the first CDDP dose, and showed a large magnitude of change over time with the progression of toxicity. Changes in urinary Kim-1 paralleled renal Kim-1 staining although with a slight time lag, with elevated levels by day 3 of CDDP administration, as Kim-1 expression on the apical membrane of the proximal tubule is required before Kim-1 can be shed in the lumen and detected in urine. All these data are consistent with other reports of Kim-1 as a highly sensitive marker of acute drug-induced kidney injury (Vaidya et al. 2010; Tonomura et al. 2010) and a useful biomarker for monitoring toxicity progression following repeated dosing up to 90 days in a subchronic setting (Hoffmann, Fuchs, et al. 2010).
Clusterin immunostaining was as specific but less noticeable than Kim-1, in contrast with urinalysis, where clusterin was more sensitive than Kim-1 for early detection, although the response magnitude was smaller and the biomarker’s progression differed from that of Kim-1. Levels peaked at day 5 but did not increase further with progressing toxicity at subsequent time points, although still remained elevated compared with controls. Clusterin upregulation has been described with proximal tubule and collecting duct degeneration and regeneration (Harpur et al. 2011). However, the more limited clusterin immunostaining, compared to both the urine clusterin data and the Kim-1 immunostaining, suggests that the antibody and the immunostaining method lacked sensitivity.
Osteopontin showed a similar time course as urine Kim-1 but seemed somewhat less sensitive for early detection. Osteopontin in urine indicated kidney damage on day 3, which is comparable in time scale with H&E staining. Similarly to Kim-1, osteopontin gradually increased with the duration of dosing and its levels in urine correlated with the degree of kidney damage.
Urinary albumin, NGAL, α-GST, and β2-microglobulin did not increase consistently prior to day 5 and hence did not show a greater sensitivity compared with the standard clinical pathology parameters. However, the magnitude of increase in these novel biomarkers was larger than for serum creatinine or BUN, and their correlation with specific kidney areas is said to be higher (Dieterle et al. 2008).
In contrast to Kim-1 and osteopontin, the concentrations of other urinary markers of toxicity, including glucose, total protein, albumin, and α-GST, displayed peak levels in urine generally on day 5 but declined thereafter, despite ongoing and progressive damage to the kidneys as evidenced by microscopy. The reason for this discrepancy between expanding kidney damage and regressing markers of toxicity is unclear. It may be postulated, however, that due to an overload state at the level of the remaining intact proximal tubular cells, cell signaling pathways and gene transcription become altered and as a result the expression and activity of renal transporters is modulated to compensate for the glucose and protein loss (Mather and Pollock 2011; Baines and Brunskill 2010). For α-GST, which can be found in proximal tubular cells, this regression could be related to the abnormal physiology of cells which are either deeply damaged or contributing to tubular regeneration (see Figures 4 and 5); in contrast, Kim-1 secretion would be very robust as long as the cell is not dead. The temporal expression of all the parameters is summarized in Table 9.
Temporal changes of relevant parameters.
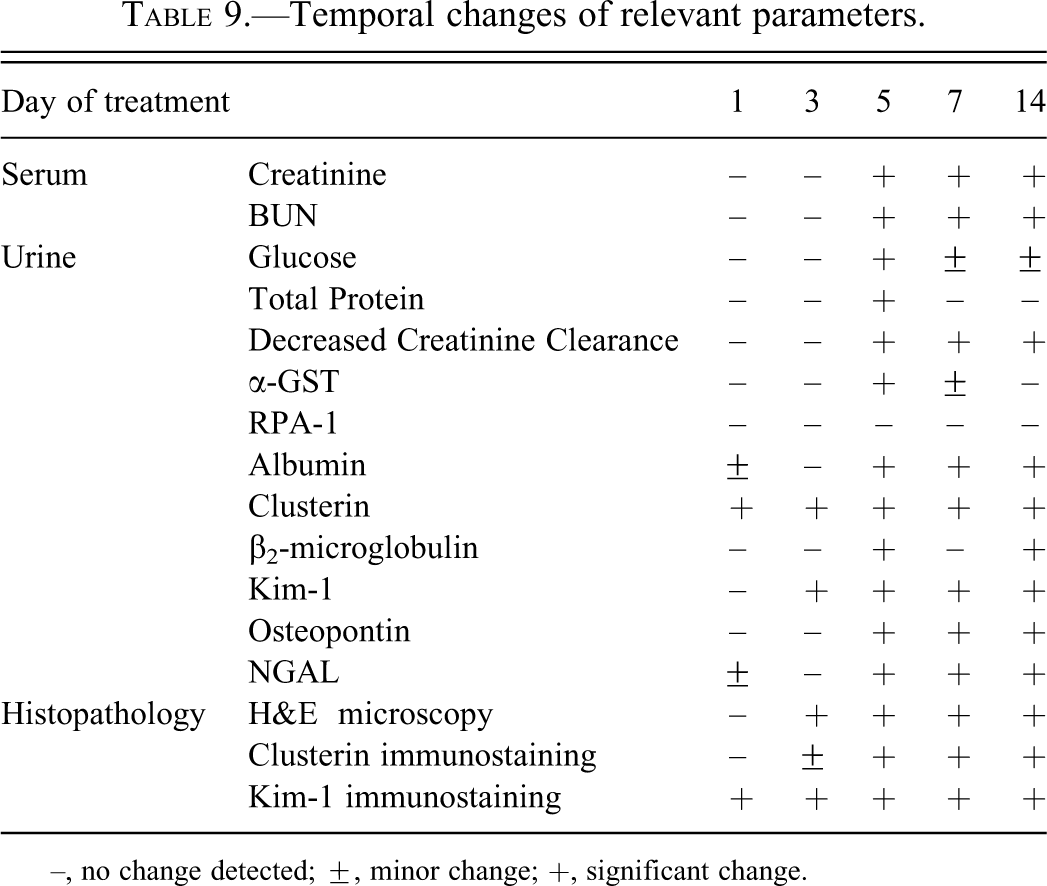
–, no change detected; ±, minor change; +, significant change.
Urinary biomarkers were also measured prior to start of treatment to establish a preliminary reference range and to assess the physiological and biological variation of the new urinary biomarkers. Despite known differences in immunoassay results due to differences in sensitivity and specificity of antibodies and differences in standardization, the normal range obtained for the different biomarkers was generally in line with other published data (Hoffmann, Adler, et al. 2010; Ozer et al. 2010; Zhou et al. 2008). It should be noted that predose samples were collected under suboptimal conditions because the rats were not allowed time to acclimatize to the metabolism cages. As a consequence, urinary clusterin values were remarkably higher in control animals during the predose collection compared with the results obtained during the dosing period. We therefore believe that the results for clusterin obtained from control animals during the study (ip saline) are more representative than those collected predose. Several urinary RPA-1 data in control animals are published, showing either steady concentrations (Gautier et al. 2010) or a degree of variation at different time points (Rouse et al. 2011), and in this study, RPA-1 also showed a trend for a continuous increase over time in control animals. In view of the observed variability we consider RPA-1 a less robust marker in our experiment. Furthermore, RPA-1 levels in treated rats did not differ from the controls and this was in contrast to Kim-1 IHC staining in the papilla at day 5 (lumen only) and at days 7 and 14 (lumen and cytoplasm).
In conclusion, the advantage of the novel urinary biomarkers is that they provide a noninvasive and quick way for the early assessment of kidney injury, and that they also allow monitoring of the pathophysiological process in the same animal. This is an important feature in preclinical toxicity studies, to enable the detection of potential issues related to kidney toxicity earlier during the screening and development of new drug candidates. Our experiment in male SD rats demonstrated once more that traditional biomarkers, which are primarily functional endpoints, fail to detect minimal to moderate kidney injury. Tissue Kim-1 and urine clusterin were the most sensitive parameters for detection of CDDP-induced proximal tubular toxicity before any histopathological alterations occurred. Thereafter, levels of urinary Kim-1 and osteopontin, as well as clusterin immunostaining accurately correlated with the progression of kidney injury. In preclinical rat studies, the combinatorial use of the above-described biomarkers with traditional endpoints allows the early detection and monitoring of nephrotoxicity, together with tissue Kim-1 for the precise localization of the region of kidney injury.
Footnotes
Acknowledgments
We thank the laboratory staff of the Drug Safety Sciences department for the labour intensive tasks involved in this study, Tim Erkens for his helpful suggestions, and Graham Bailey for the review of this article. We also thank the Renal Integrated Safety Assessment (ISA) team and the Safety Biomarkers Center of Excellence within Janssen Research and Development for their support of this manuscript. Petra Vinken, Sofie Starckx, and Erio Barale-Thomas contributed equally to this work