
Abstract
Cisplatin is an anticancer agent that induces renal proximal tubule lesions in many species. Studies were conducted in Sprague-Dawley and Han-Wistar rats to evaluate the utility of novel preclinical biomarkers of nephrotoxicity for renal lesions caused by this compound. Groups of 10 males of each strain were given a single intraperitoneal injection of 0.3, 1, or 3 mg/kg cisplatin and were sacrificed on days 2, 3, and 5. The novel biomarkers α-glutathione-S-transferase (α-GST) (for proximal tubular injury), μ-glutathione-S-transferase (μ-GST) (for distal tubular injury), clusterin (for general kidney injury), and renal papillary antigen-1 (RPA-1) (for collecting duct injury) were measured in urine by enzyme immunoassay. Histologically, degeneration and necrosis of the S3 segment of the renal proximal tubule were observed on day 2 (Han-Wistar) and days 3 and 5 (both strains) at 1 and 3 mg/kg. Results showed that in both strains of rats, urinary α-GST and clusterin can be detected in urine soon after injury, are more sensitive than BUN and serum creatinine, and therefore are usable as noninvasive biomarkers of proximal tubule injury. Changes in both μ-GST or RPA-1 were considered to represent secondary minor effects of proximal tubular injury on distal segments of the nephron.
Introduction
Cisplatin is a major antineoplastic drug that is effective against a wide range of solid tumors, but it has dose-dependent renal toxicity (Yao et al. 2007). Cisplatin-induced renal damage is characterized by tubular degeneration/necrosis localized in the S3 segment of the proximal tubules with loss of microvilli, alterations in the number and size of lysosomes, and mitochondrial vacuolation (Dobyan et al. 1980). Cisplatin is concentrated in the proximal tubule at least in part by active uptake via energy-dependent processes such as the organic anion transporter 2 protein (Filipski et al. 2009). Cisplatin causes both inhibition of protein synthesis and glutathione depletion (Kuhlmann, Burkhardt, and Kohler 1997). Rodent models of nephrotoxicity using cisplatin dose levels ranging from 1 to 5 mg/kg by intravenous or intraperitoneal route have been described (Huang et al. 2001; Silkensen et al. 1997).
Traditional clinical pathology indicators of nephrotoxicity such as blood urea nitrogen (BUN), serum creatinine, and urinalysis parameters, including total protein, albumin or electrolytes, and sediment examination are relatively insensitive, as changes in these markers are generally observed after extensive renal damage (Ferguson et al. 2008). Approximately half of the nephrons need to be damaged before a significant increase in serum creatinine is observed. Additionally, BUN and serum creatinine are functional markers of renal clearance of nitrogenous waste and are greatly influenced by nonrenal factors and other physiological events, including changes in protein synthesis and degradation. Urinary enzymes such as N-acetyl-β-D-glucosaminidase (NAG) and γ-glutamyl transpeptidase (GGT) have also been used to assess renal toxicity. However, variability, lack of specificity, and/or lability have limited the usefulness of these enzymes (Ferguson, Vaidya, and Bonventre 2008). Therefore, there is a clear need for more reliable and sensitive biomarkers of nephrotoxicity that are indicative of minimal kidney damage rather than tests that confirm advanced-stage disease.
Several urinary proteins have recently been proposed as sensitive biomarkers of renal injury and as indicators of the localization of the kidney lesions. Among these candidate biomarkers, four proteins were selected for evaluation by the Health and Environmental Sciences Institute (HESI) Biomarkers Nephrotoxicity Working Group: α-glutathione-S-transferase (α-GST), μ-glutathione-S-transferase (μ-GST), clusterin, and renal papillary antigen-1 (RPA-1). α-GST is localized in the proximal tubule in both rat and human; whereas in the distal tubule, μ-GST (GSTYb1) is the isoform found in rat, and π-GST is the isoform found in human (Rozell et al. 1993; Harrison et al. 1989). The increased presence of GSTs in the urine after nephrotoxic injury is attributed to leakage from the tubular epithelial cells into the tubular lumen secondary to cell damage (Harrison et al. 1989). Clusterin has been shown to be upregulated and released in the urine when the kidney is damaged (Rosenberg and Silkensen 1995). Clusterin has no specific renal location and has been suggested to play an anti-apoptotic role or to be involved in cell protection, cell aggregation, and cell attachment during tissue remodeling and repair (Rosenberg and Silkensen 1995). RPA-1 is a renal papillary antigen (Hildebrand et al. 1999) released in the urine in the event of collecting duct injury. The identity of RPA-1 and its biological role remain unknown, but it is considered as a leakage marker of collecting duct injury in the rat and, as such, a potential biomarker for the detection of renal papillary necrosis in the rat.
The objective of this work conducted as part of the HESI Biomarkers Committee nephrotoxicity program was to evaluate whether the novel urinary biomarkers candidates α-GST, μ-GST, clusterin, and RPA-1 report renal injury with higher sensitivity and greater diagnostic utility than conventional clinical pathology parameters in male rats given a single intraperitoneal injection of ascending doses of cisplatin. Rats are the species most extensively studied in investigations of nephrotoxicity and the standard rodent species used in preclinical safety assessment. The HESI study used two strains of rat commonly used in pharmaceutical development (Sprague-Dawley and Han-Wistar) to assess the robustness of these candidate novel biomarkers.
Materials and Methods
Animals and Husbandry
Male Sprague-Dawley specific pathogen-free rats [Crl:CD(SD)], 6 weeks of age and weighing 150-215 g, were obtained by sanofi-aventis from Charles River Laboratories (Les Oncins, Saint Germain sur L’Arbresle Cedex, France) and acclimated for 1 week before use. Two or three animals per cage were maintained in suspended stainless steel wire-mesh cages under conditions of 20-24°C and 40-70% relative humidity with a 12-hour light/12-hour dark cycle. The rats were fed commercial rodent chow A04-10 pelleted diet and given filtered tap water ad libitum. The animal care and experimental procedures were conducted in compliance with the European Economic Community (EEC) Directive 86/609/EEC (1986) and U.S. Federal Guidelines (1985), Laboratory Animal Welfare Act. The study was performed in accordance with the standards of the Institute of Laboratory Animals Resources (ILAR) Guide (1996) and was approved by an internal ethics committee.
Male Han-Wistar rats, 7 weeks old and weighing 170-210 g, were purchased by Bayer Schering from Charles River Laboratories (Sulzfeld, Germany) and acclimated for 14 days before use. Animals were housed singly in Makrolon Type III plastic cages with bedding and maintained under conditions of 21-23°C and 53-60% relative humidity with a 12-hour light/12-hour dark cycle. Rats were fed commercial pulverized rodent chow (Sniff R/M-H diet) and offered filtered tap water ad libitum. The animal care and experimental procedures of this study were conducted in compliance with the Council Directive 86/609/EEC and the European Convention for the protection of vertebrate animals used for experimental and other scientific purposes and by approval of the local state ethics committee.
Study Design and Procedures
Rats (n = 10/dose at each of three time points) were given a single dose of 0.3, 1, or 3 mg/kg of cisplatin dissolved in 0.9% physiological saline or the same volume of vehicle as controls (5 mL/kg) by intraperitoneal injection. Cisplatin (cis-diammineplatinum (II) dichloride) (CAS N°15663-27-1) was purchased from Sigma-Aldrich. Doses were selected on the basis of results obtained in an exploratory dose-range finding toxicity study where a clear dose response for degeneration/necrosis of the S3 segment of the proximal tubules was observed at 1 and 5 mg/kg on days 2 and 5 in both Sprague-Dawley and Han-Wistar rats, and no response was observed at 0.1 mg/kg. The high dose was selected to establish clear kidney toxicity without lethality. The low and mid doses were chosen to establish a dose-response relationship for any treatment-related effect. The dose 0.3 mg/kg was anticipated to be below the threshold for renal morphologic injury and to correspond to a no-observable-adverse-effect level.
The first day of dosing was designated as day 1. Animals were examined clinically and weighed daily. Ten rats per group were terminated 24, 48, or 96 hours after dosing on days 2, 3, or 5, respectively. Animals were fasted overnight for approximately 16 hours prior to clinical pathology collections and necropsy. Sprague-Dawley rats were euthanized by exsanguination from the abdominal aorta under pentobarbital anesthesia, and Han-Wistar rats were euthanized by exsanguination from the jugular vein after chloroform anesthesia. The kidneys and liver were collected and prepared for histopathological examination as described below. Blood samples for clinical pathology parameters were collected via either abdominal aorta or jugular vein.
Urine samples were collected overnight from all animals in individual metabolism cages over ice for a period of approximately 16 hours before necropsy. Animals had free access to water during this time. At the end of the collection period, urine samples were centrifuged at 1,000 g for 5 min for cytologic examination and urinalysis. Multiple 500 μl aliquots of urine were placed in 1.2 mL cryo NUNC tubes, diluted with 125 μl of rat urine stabilizing buffer (Argutus Medical, Dublin, Ireland), and then immediately frozen at –80°C until analyzed by immunoassay for novel biomarkers as described.
Histopathological Examination
At necropsy, a portion of the liver (for both rat strains) and a transverse section through the hilus of both kidneys for Sprague-Dawley rats were fixed in 10% neutral phosphate-buffered formalin. The left kidney was cut longitudinally, whereas the right kidney was cut transversely for Han-Wistar rats. The fixed tissues were processed, embedded in paraffin wax, cut (4 μm thickness), and stained with hematoxylin, eosin, and saffron for Sprague-Dawley rats or with hematoxylin and eosin for Han-Wistar rats. For histopathological evaluation of tissues, a board-certified veterinary pathologist performed an initial assessment with full knowledge of the treatment groups (unblinded). After this initial assessment, the same pathologist performed a “targeted masked evaluation (blinded)” of selected slides to reevaluate findings as needed to resolve compound-related changes from normal variation and to establish appropriate grades. At this step, the pathologist was blinded to knowledge of treatment group assignments. At all stages of the histopathological evaluation, the pathologist did not have knowledge of the biomarker data to avoid any bias in the analysis. A peer review was conducted by a second board-certified veterinary pathologist initially unblinded to treatment group and then, as needed, a targeted masked evaluation was performed to resolve discrepancies. A pathology working group was convened to agree on nomenclature and severity grading, for creation of a diagnostic lexicon, and to peer review results of studies conducted with all of the nephrotoxicants evaluated by the HESI Biomarkers Nephrotoxicity Working Group (cisplatin, gentamicin, N-phenylanthranylic acid). Histopathology data were assessed and similar terminologies were combined to remove redundancies.
Immunohistochemistry Methods
Immunohistochemistry was performed on kidneys from Sprague-Dawley rats treated at 3 mg/kg and sacrificed on day 5 to confirm the site of nephron injury on representative sections using α-GST and calbindin-D28 for visualization of proximal (Rozell et al. 1993) and distal tubules, respectively (Taylor, McIntosh, and Bourdeaum 1982). Similarly, colabeling with Tamm-Horsfall protein and aquaporin-2 allowed visualization of profiles of medullary thick ascending limb (Vekaria et al. 2006) and collecting duct (Reilly and Ellison 2000), respectively. All immunohistochemistry was performed on the Ventana Discovery System®, and all reagents, unless specified otherwise, were obtained from Ventana Medical Systems, Inc. (Tucson, AZ). A serial process was used to colabel tissue sections with α-GST and calbindin-D28 or Tamm-Horsfall protein and aquaporin-2. Briefly, sections were deparaffinized and rehydrated. Nonspecific staining was blocked with 3% hydrogen peroxide and protein block (DAKO, Carpinteria, CA). For colabeling, serial sections were incubated with either polyclonal rabbit anti-aquaporin-2 (Sigma Aldrich, St Louis, MO) at a concentration of 5 μg/ml or mouse monoclonal anti-calbindin-D28 at a dilution of 1:500 (Abcam Ltd, Cambridge, MA) for 1 hour. Anti-aquaporin-2 or anti-calbindin-D28 antibodies were labeled with goat anti-rabbit IgG biotinylated (1:200; Vector Labs, Burlingame, CA) or horse anti-mouse IgG biotinylated (1:100; Vector Labs), respectively, followed by streptavidin-horseradish peroxidase. Immunoreactivity was visualized with 3′3-diaminobenzidine (DAB).
For double immunostaining, sections stained with aquaporin-2 were colabeled with polyclonal sheep Tamm-Horsfall protein antibody (Cheimicon, Temecula, CA) at a concentration of 3 μg/ml, and sections stained with calbindin-D28 were colabeled with rabbit anti-α-GST (1:500; CalBiochem, San Diego, CA) for 1 hour. Anti-Tamm-Horsfall protein and anti-α-GST antibodies were labeled with anti-sheep IgG (Jackson ImmunoResearch, West Grove, PA) or anti-rabbit IgG (Vector Labs), respectively. Secondary antibodies were detected with streptavidin-AP and Fast Red chromagen. Sections were counterstained with hematoxylin, dehydrated, cleared, and coverslipped.
Traditional Clinical Pathology Parameters
In the study with Sprague-Dawley rats, measurements of serum parameters (BUN, creatinine, aspartate aminotransferase, alanine aminotransferase, alkaline phosphatase, total bilirubin, total protein, albumin, globulin, glucose) and urine parameters (total protein, creatinine, GGT, NAG) were performed with a Hitachi 917 using reagents from Roche Diagnostics (Mannheim, Germany). Creatinine was determined using an enzymatic method. Urinary total protein was measured by the pyrogallol red method. Urinary albumin was measured using the SPI BIO Rat Albumin enzyme immunoassay (EIA) kit A05102 96 wells (Montigny-le-Bretonneux, France).
In the study with Han-Wistar rats, BUN, serum creatinine and total protein, urinary creatinine, urinary total protein, as well as urinary GGT were measured with an ADVIA 1650 using reagents from Bayer Diagnostics (now Siemens Diagnostics, Fernwald, Germany). Creatinine was determined by the Jaffé method. Urinary NAG was measured on the same analyzer with reagents from Roche Diagnostics. Urinary total protein was determined semi-quantitatively by dipstick analysis (Combur 9 Test dip-sticks) on a reflectance spectrometer (Miditron; Roche Diagnostics). Urinary GGT was measured on the Bayer ADVIA 1650 using reagents from Bayer Diagnostics (now Siemens Diagnostics). Urinary albumin was not measured in Han-Wistar rats.
EIA Assays for Novel Biomarkers of Nephrotoxicity
Urinary α-GST (Rozell et al. 1993), GSTYb1 (μ-GST) (Rozell et al. 1993), clusterin (Rosenberg and Silkensen 1995), and rat Renal Papillary Antigen-1 (RPA-1) (Hildebrand et al. 1999) were measured in urine with EIA assays developed by Argutus Medical Ltd (Dublin, Ireland). Rat α-GST, μ-GST, and RPA-1 EIAs involved sequential addition and incubation of sample antibody-enzyme conjugate and substrate to microassay wells coated with the respective anti rat α-GST, μ-GST, or RPA-1 IgG, respectively. The Argutus Medical rat clusterin EIA was a quantitative solid-phase EIA based on the sequential addition of primary detecting antibody, secondary antibody-enzyme conjugate, and substrate to microassay wells coated with rat urine samples. All assays were incubated at room temperature. The resultant color intensities were proportional to the amount of α-GST, μ-GST, RPA-1, or clusterin, respectively. Sample concentrations were calculated from simultaneously run calibration curves. Absorbances were read using microplate reader MRX revelation 4.06 (Dynex technologies, Thermo, France) for the study with Sprague-Dawley rats and using a microplate reader Spectra Max Plus (Molecular Devices, Sunnyvale, CA) for the study with Han-Wistar rats. The assay range was 0-100 μg/L for α-GST, μ-GST, and RPA-1 and 0-5 μg/L for clusterin. Commercially available assayed control materials with assigned ranges were used to daily monitor these EIA assays. The analytical validation of the EIA assays included assessment of linearity, accuracy, repeatability (intra-assay precision), and intermediate precision (intralaboratory precision). All assays performed very well with respect to linearity (r 2 ≥ .98) and accuracy (91-106%). Estimated repeatability and intermediate precision coefficients of variation were generally < 10%. It was concluded that the EIA assays for these biomarkers are fit for use in biological qualification studies.
Expression of Urinary Biomarker Data
Preliminary analyses were conducted with urinary biomarker data expressed both as total excretion and normalized to urinary creatinine; the conclusions drawn were similar using both methods. It was first checked that urinary creatinine amounts (concentration × volume) were similar across all dose groups and thus shown to be unaffected by treatment. Normalization to creatinine is the most consistent method of data presentation used in the literature. Therefore, all of the urinary biomarker data shown in the tables are expressed as urinary biomarker concentration relative to urinary creatinine concentration. In the text, the term “level” is used to describe the biomarker values expressed in this way. Fold differences in the normalized values were calculated relative to the contemporary control mean value for each strain.
Statistical Analysis
All data are represented as mean ± standard deviation. Differences between treated versus time-matched control animals were evaluated by a Student t-test. All p-values < .05 were considered to be statistically significant. No adjustment was made for multiple testing.
Results
Clinical Observations
In the study with Sprague-Dawley rats, there were no clinical signs of toxicity and no changes in group mean body weights at any time point. Similarly, in Han-Wistar rats, there were no clinical signs of toxicity, although at 3 mg/kg a slight decrease in body weight gain (–8%) compared with controls (–2%) was observed from day 1 to day 5 (data not shown).
Histopathological Examination
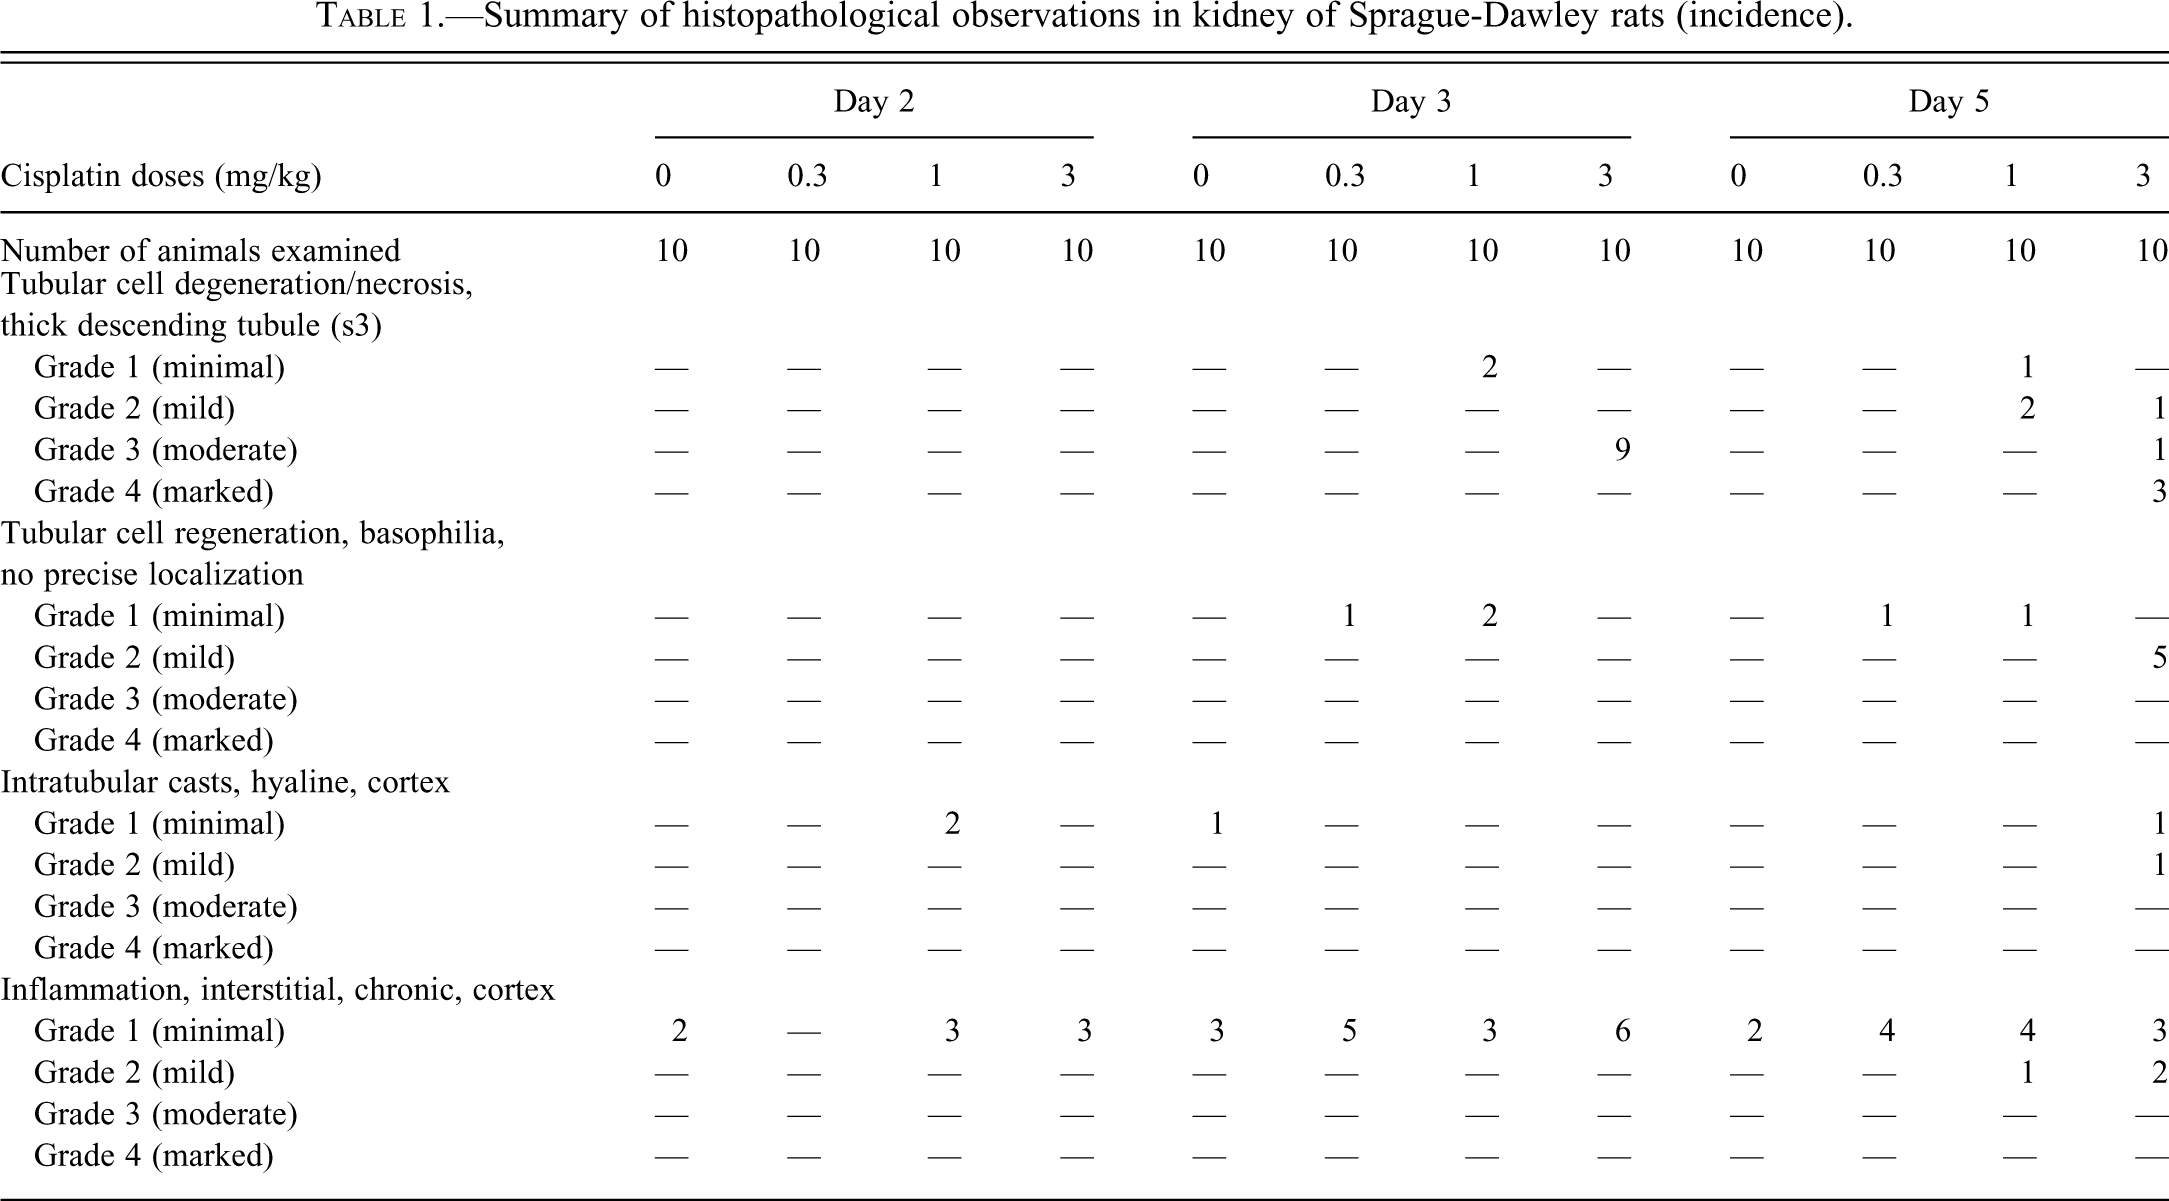
In Sprague-Dawley rats, minimal to moderate degeneration/necrosis of the S3 segment of the proximal tubule was observed on day 3 in 2/10 and 9/10 rats at 1 and 3 mg/kg, respectively (Table 1). On day 5, minimal to mild degeneration/necrosis of the S3 segment of the proximal tubule was observed in 3/10 rats at 1 mg/kg and mild to marked degeneration/necrosis of the S3 segment of the proximal tubule was observed in 5/10 rats at 3 mg/kg. Tubular degeneration/necrosis of the S3 segment of the proximal tubule is shown in Figure 1. Mild regeneration was associated with the degeneration/necrosis in the 5 affected rats at 3 mg/kg. It is not known why 5 rats treated at 3 mg/kg did not respond, but it is suspected that the intraperitoneal injections may have been given directly into the lumen of the intestine. This interpretation is supported by the observation that in none of the 5 rats given 3 mg/kg and euthanized on day 5 was there an increase in any serum or urinary biomarker above the control range. Consequently, we only put in the tables the data for the 5/10 animals treated at 3 mg/kg and sacrificed on day 5 that showed histopathological evidence of damage. Individual data for the 5 excluded animals are available online as supplementary material at http://tpx.sagepub.com/supplemental. Immunohistochemistry with antibodies against α-GST (for proximal tubules), calbindin-D28 (for distal tubules), aquaporin-2 (for collecting duct), and Tamm-Horsfall protein (for medullary thick ascending limb) on kidneys of Sprague-Dawley rats treated with 3 mg/kg cisplatin and sacrificed on day 5 confirmed localization of the tubular necrosis within the outer stripe of the outer medulla to the S3 segment of the proximal tubule, with minimal to no evidence of injury in adjacent profiles of collecting duct and medullary thick ascending limb (Figure 2).
Summary of histopathological observations in kidney of Sprague-Dawley rats (incidence).
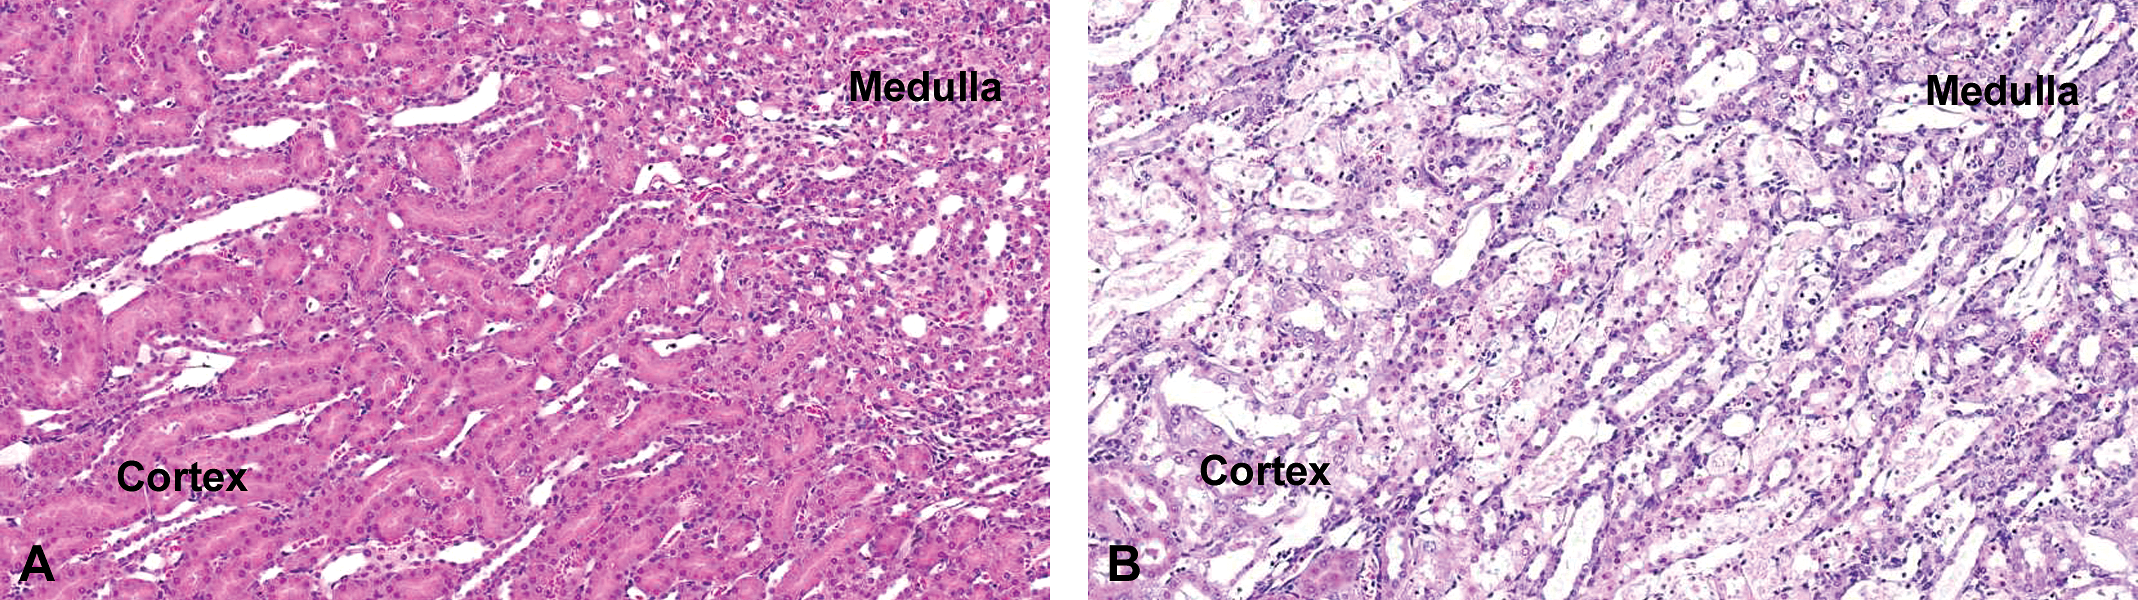
Typical necrosis of the S3 segment of the proximal tubule in the outer stripe of the outer medulla (OSOM) of a male Sprague-Dawley rat treated at 3 mg/kg cisplatin on day 5 (B). (A) Untreated control kidney. Hematoxylin, Eosin, and Saffron, x10.
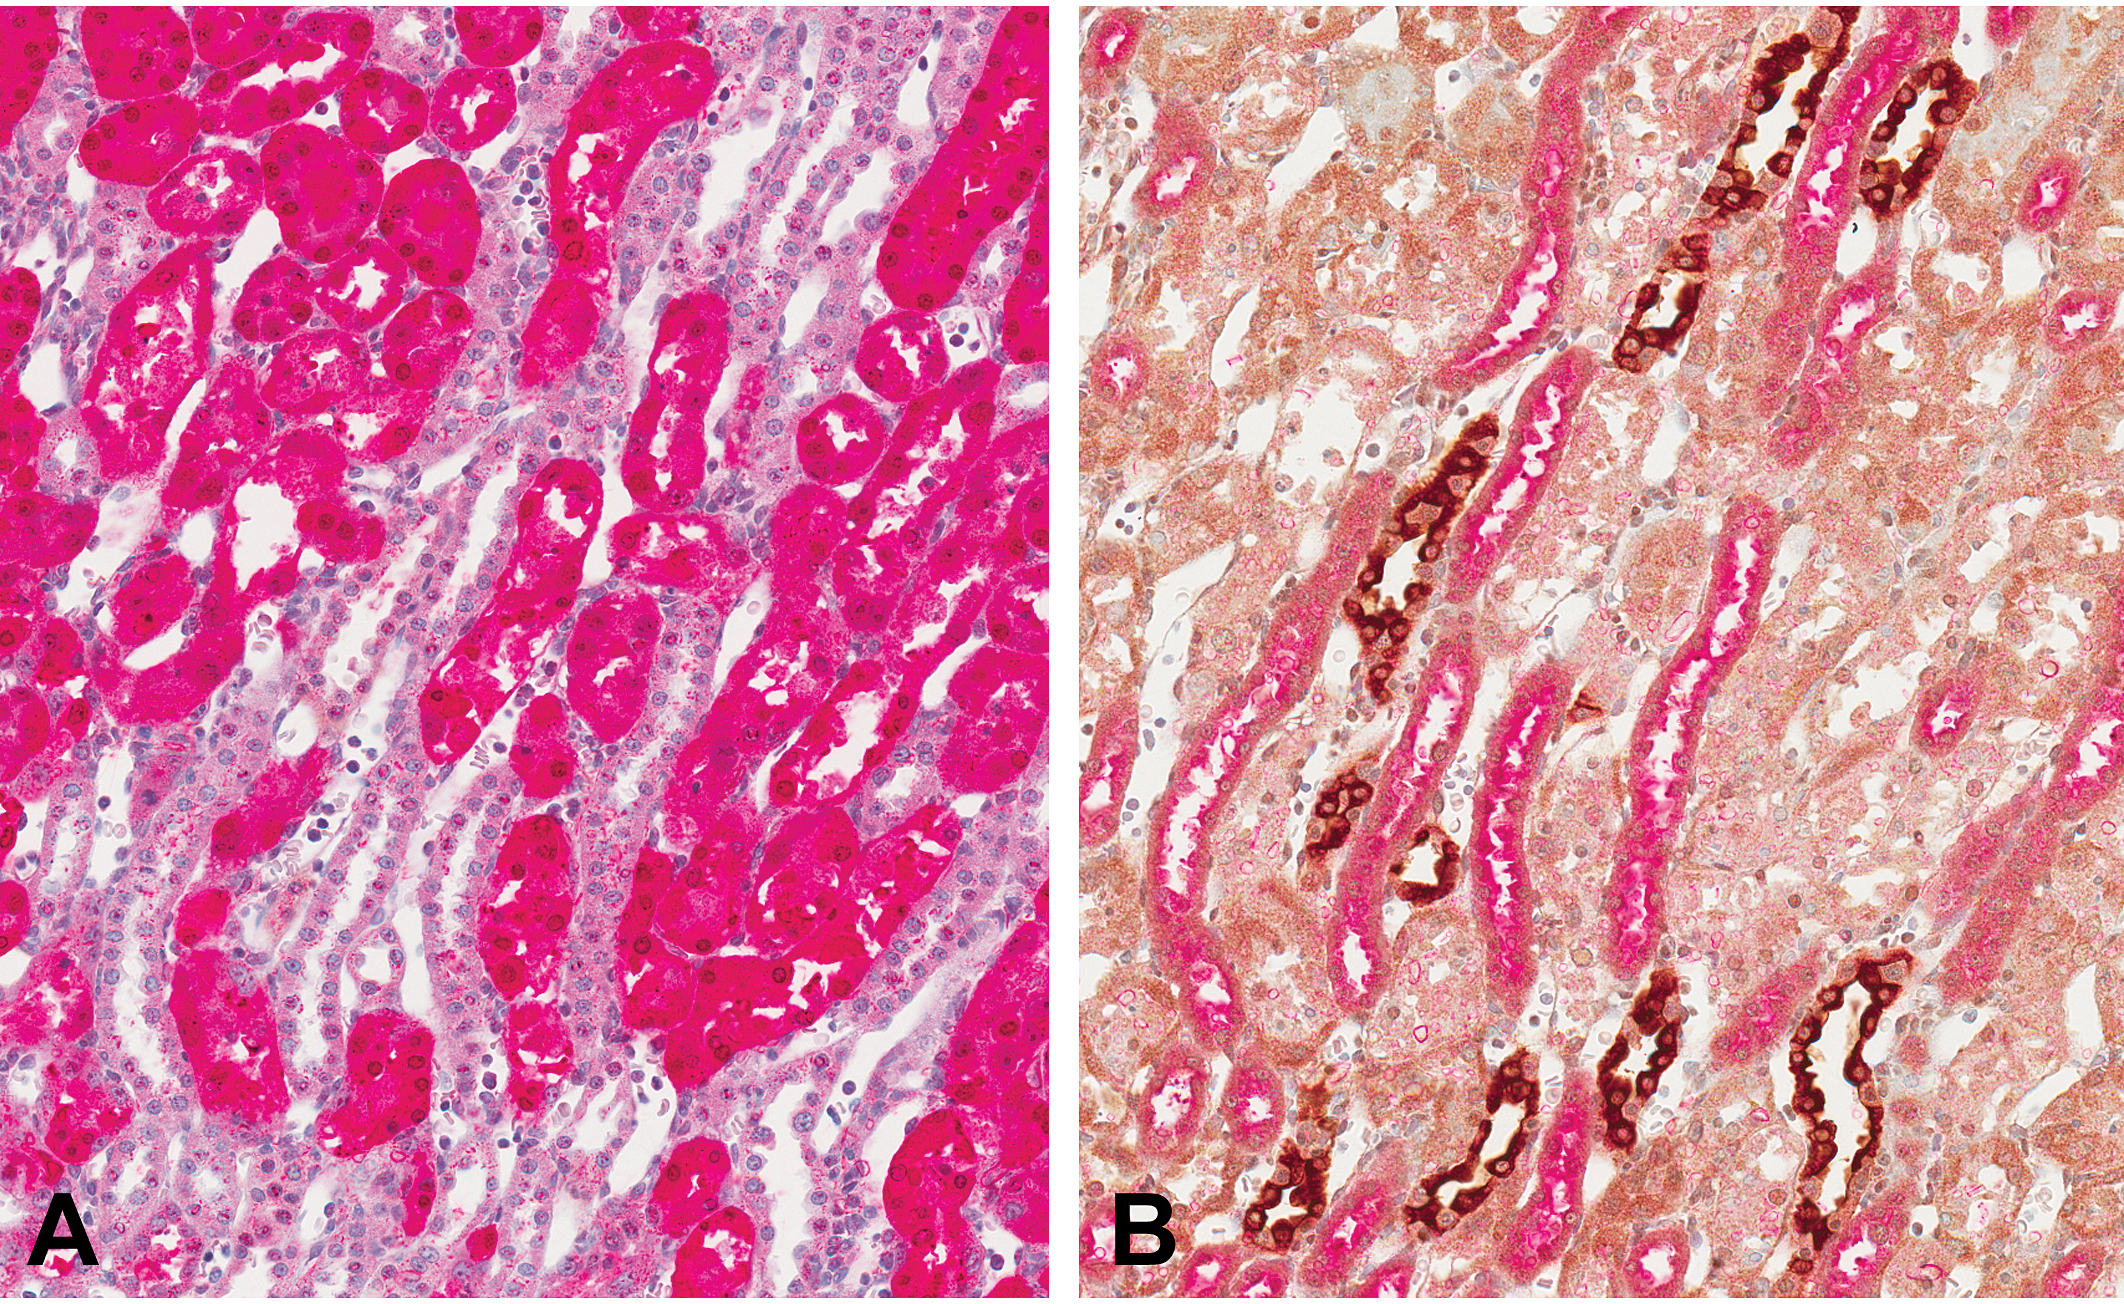
Immunohistochemistry of serial sections of kidney from a Sprague-Dawley rat given 3 mg/kg cisplatin and sacrificed on day 5. (A) Immunostaining with α-GST for identification of proximal tubules demonstrates extensive necrosis of the S3 segment of proximal tubule within the OSOM characterized by epithelial attenuation, detachment, and luminal debris; with (B) sparing of adjacent profiles of collecting duct and medullary thick ascending limb dual labeled with aquaporin 2 (brown chromagen) and Tamm-Horsfall protein (red chromagen), respectively (20x objective).
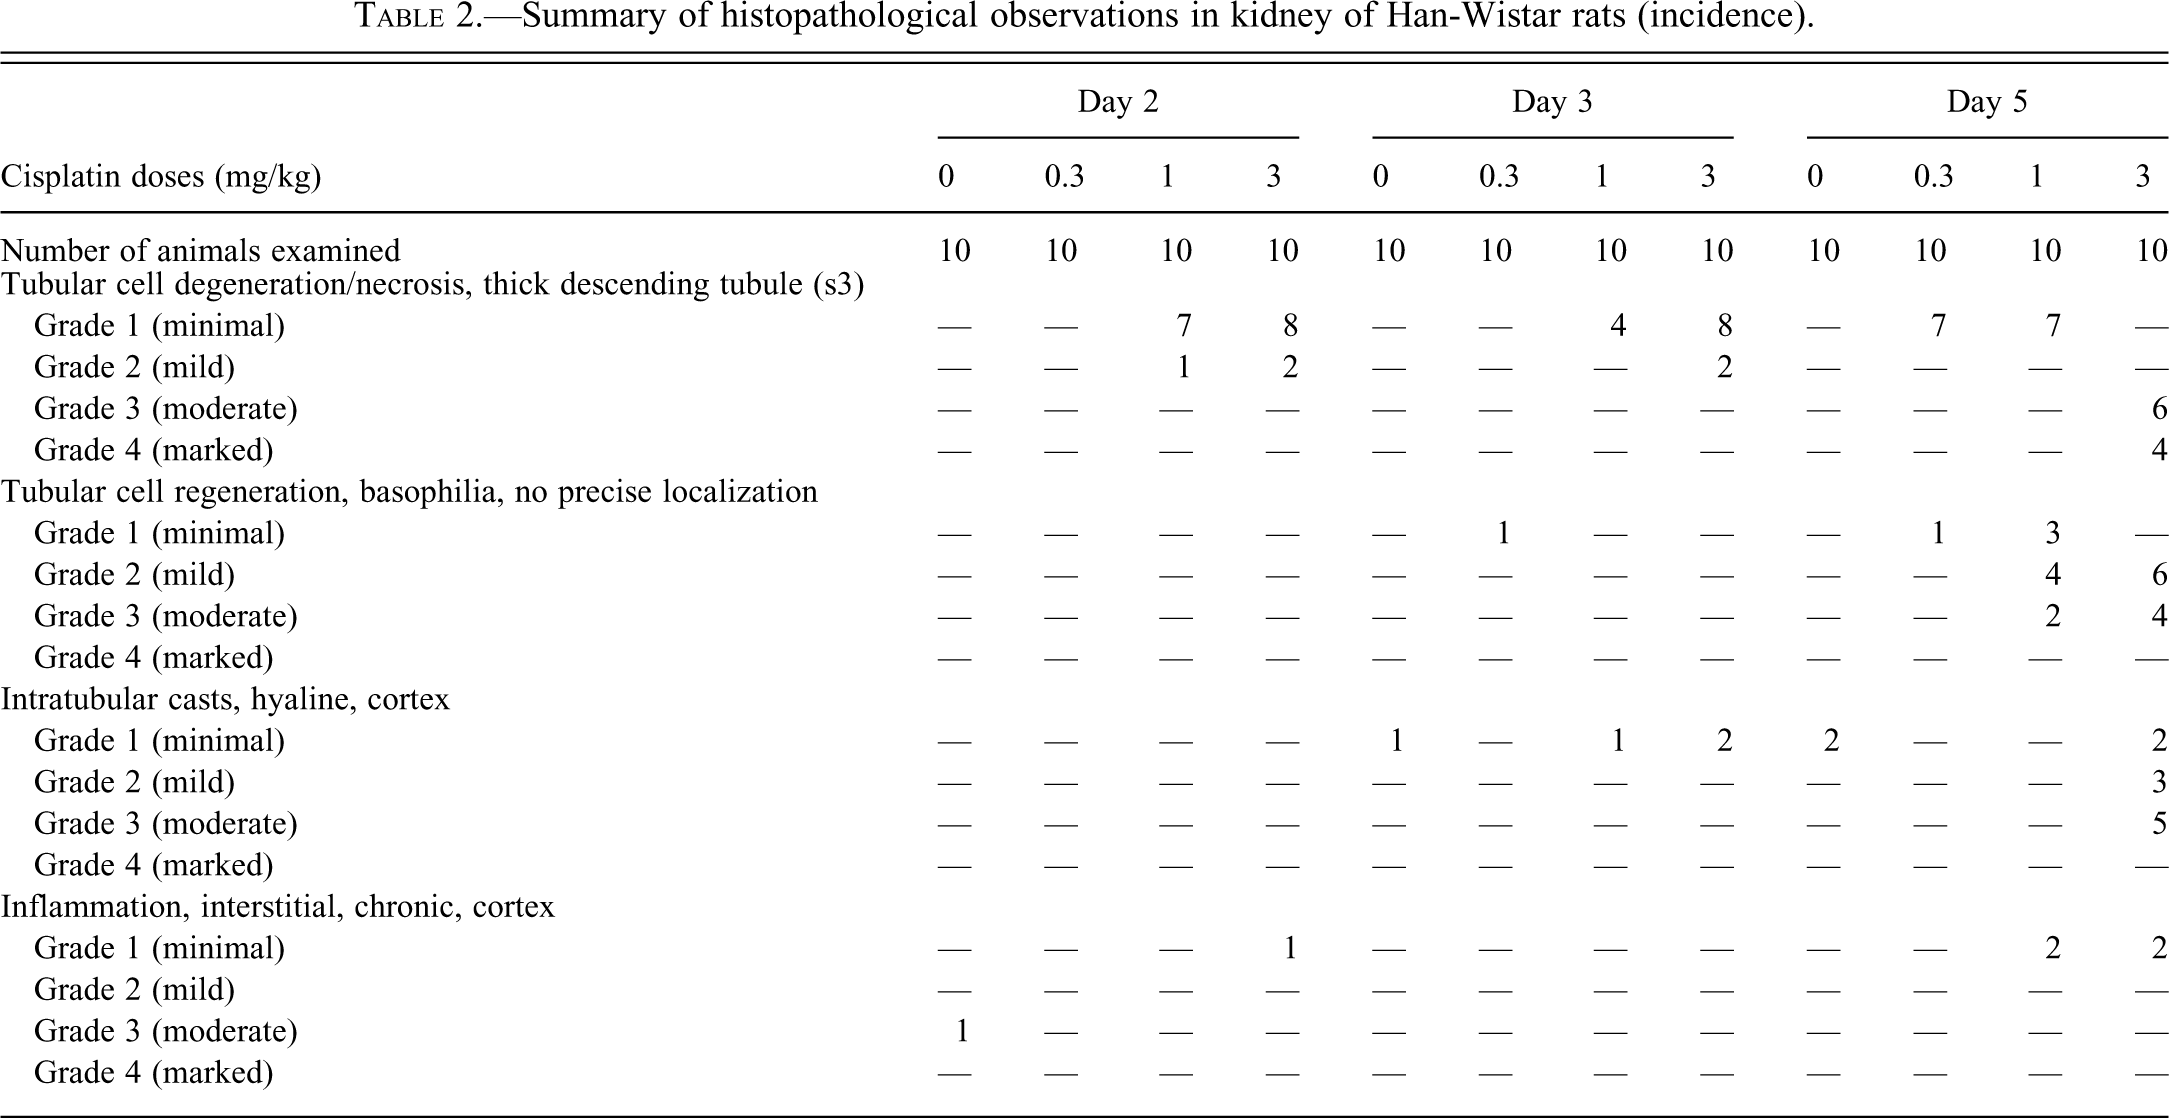
In Han-Wistar rats, minimal to mild necrosis of the S3 segment of the proximal tubule was observed as early as day 2 at 1 and 3 mg/kg (Table 2). On day 5, moderate to marked necrosis in the proximal tubules was observed in animals given 3 mg/kg. In addition, tubular basophilia, indicating cell regeneration, was noted on day 5 at ≥ 1 mg/kg, with severities ranging from minimal to moderate. Cortical tubular dilation was observed at 3 mg/kg beginning on day 3. On day 5, tubular dilation occurred in single animals given 0.3 and 1 mg/kg and in all animals with moderate severity at 3 mg/kg (data not shown).
Summary of histopathological observations in kidney of Han-Wistar rats (incidence).
Other findings considered unrelated to treatment included interstitial inflammation of minimal severity and of comparable incidence in both untreated and treated Sprague-Dawley rats. There were no compound-related microscopic findings in liver for either rat strain.
Changes in Traditional Biochemical Parameters
In Sprague-Dawley rats, BUN and serum creatinine were increased at 3 mg/kg (2.2- and 2.4-fold the time-matched controls, respectively) on day 5 (Table 3). At the individual animal level, rats were variably affected by these changes, but there was a good correlation between increases in BUN (Figure 3) or serum creatinine (data not shown) and the presence of tubular necrosis at the higher levels of pathology grade 3 or 4 for 4 of 5 rats at 3 mg/kg on day 5. BUN and serum creatinine were minimally but significantly increased at 3 mg/kg on day 3 (1.4-fold and 1.2-fold, respectively). A minimal increase of urinary volume (1.3-fold) was observed at 3 mg/kg on day 5 (data not shown). Urinary total protein (4.6-fold) and NAG (2.0-fold) were significantly increased at 3 mg/kg on day 5 only (Table 3). Urinary NAG was also minimally but significantly increased at 3 mg/kg on day 3 (1.3-fold). At the individual animal level on day 5 at the high dose, there was good correlation between increases of urinary total protein and NAG and the presence of moderate or marked degeneration/necrosis of the S3 segment (data not shown). Urinary GGT was increased in rats treated at 3 mg/kg on day 3 (1.6-fold), but not on day 5 (Table 3). Urinary albumin was clearly increased at 3 mg/kg on days 3 and 5 (6.4-fold and 5.6-fold, respectively) (Table 3). At the individual animal level, there was a good correlation between increased albumin in urine and the presence of grade 3 or 4 tubular necrosis of S3 at the high dose on days 3 and 5 (Figure 4).
Changes in serum and urine traditional clinical pathology parameters in Sprague-Dawley rats.
a This mean value is increased because of an outlier value of NAG normalized with creatinine for one animal.
b Means and standard deviations calculated from data obtained for 5 of 10 animals treated at 3 mg/kg and sacrificed on day 5 that showed histopathological evidence of damage (individual data for the 5 other animals are available online as supplementary material at http://tpx.sagepub.com/supplemental).
* p < .05 in Student t-test.
** p < .01 in Student t-test.
BUN (mmol/L) versus cisplatin dose levels (mg/kg) by study day in Sprague-Dawley and Han-Wistar rats. Symbols indicate histopathology grades for tubular degeneration/necrosis of S3 segment.
Urinary albumin (mg/mmol urine creatinine) versus cisplatin dose levels (mg/kg) by study day in Sprague-Dawley rats. Symbols indicate histopathology grades for tubular degeneration/necrosis of S3 segment.
In Han-Wistar rats, there were no treatment-related effects on BUN and serum creatinine at 0.3 and 1 mg/kg (Table 4). An increase of BUN (3.5-fold) and serum creatinine (2.5-fold) was noted at 3 mg/kg on day 5. There was good correlation between the increased BUN (Figure 3), serum creatinine (data not shown), and the presence of moderate or marked tubular degeneration/necrosis of the S3 segment on day 5 at 3 mg/kg. Urinary sediment analysis showed slight increases in leukocytes at 3 mg/kg on day 5 (data not shown). Urinary NAG increased at 3 mg/kg by 1.9-fold on day 5 relative to control (Table 4). Semiquantitative urinalysis revealed changes in urinary total protein only at 3 mg/kg on day 5 (5.6-fold increase) relative to respective controls. There were no changes in any other traditional biochemical parameters measured in both Sprague-Dawley and Han-Wistar rats.
Changes in serum and urine traditional clinical pathology parameters in Han-Wistar rats.
ND = not determined.
** p < .01 in Student t-test.
Changes in Novel Urinary Biomarkers
Urinary α-GST levels increased in Sprague-Dawley rats given 3 mg/kg on days 3 and 5 (2.3- and 7.0-fold, respectively) (Table 5). Clusterin was increased at 3 mg/kg on day 5 (8.0-fold) and on day 3 (1.8-fold). The magnitude of increases in urinary α-GST and clusterin were higher than for the traditional urinary parameters tested. At the individual animal level, despite interindividual variability in biomarker values, concordance between magnitude of increase in α-GST (Figure 5) and clusterin (Figure 6) and the presence of moderate or marked tubular degeneration/necrosis of S3 segment at the high dose was excellent. The high variability in urinary μ-GST and clusterin in rats given 3 mg/kg cisplatin on day 5 was attributed to the absence of microscopic findings in the kidney of 5/10 rats. As mentioned earlier (Histopathological Examination section), in the 3 mg/kg dose group euthanized on day 5, there was no increase in any of the novel urinary biomarkers in the 5 animals without microscopic findings. Urinary μ-GST levels were highly variable relative to the other parameters tested as reflected in control rat values on days 2, 3, and 5. Mean urinary μ-GST was increased 3.7-fold at 3 mg/kg on day 5 due to an increase in 4/5 animals (Figure 7). Urinary RPA-1 levels were minimally increased in rats given 3 mg/kg on day 3 (1.6-fold) and in 1/5 rats at 3 mg/kg on day 5 (Figure 8).
Changes in novel biomarkers of nephrotoxicity in Sprague-Dawley rats.
a Means and standard deviations calculated from data obtained for 5 of 10 animals treated at 3 mg/kg and sacrificed on day 5 that showed histopathological evidence of damage (individual data for the 5 other animals are available online as supplementary material at http://tpx.sagepub.com/supplemental).
* p < .05 in Student t-test.
** p < .01 in Student t-test.
Urinary α-GST (μg/mmol urine creatinine) versus cisplatin dose levels (mg/kg) by study day in Sprague-Dawley and Han-Wistar rats. Symbols indicate histopathology grades for tubular degeneration/necrosis of S3 segment.
Urinary clusterin (μg/mmol urine creatinine) versus cisplatin dose levels (mg/kg) by study day in Sprague-Dawley and Han-Wistar rats. Symbols indicate histopathology grades for tubular degeneration/necrosis of S3 segment.
Urinary μ-GST (μg/mmol urine creatinine) versus cisplatin dose levels (mg/kg) by study day in Sprague-Dawley and Han-Wistar rats. Symbols indicate histopathology grades for tubular degeneration/necrosis of S3 segment.
Urinary RPA-1 (IU/mmol urine creatinine) versus cisplatin dose levels (mg/kg) by study day in Sprague-Dawley and Han-Wistar rats. Symbols indicate histopathology grades for tubular degeneration/necrosis of S3 segment.
In Han-Wistar rats, urinary α-GST was increased on days 3 and 5 at 3 mg/kg (3.3-fold and 22.5-fold, respectively) versus time-matched controls (Table 6). In addition, urinary α-GST levels were minimally increased at 1 and 0.3 mg/kg on day 5 (2-fold and 1.4-fold, respectively). The pattern of novel marker changes was similar to that observed in Sprague-Dawley rats, although the magnitude of increases was generally greater in Han-Wistar rats (Figure 5), in part at least reflecting a greater level of injury in this strain. Urinary clusterin was increased in Han-Wistar rats on day 5 at 1 mg/kg and at 3 mg/kg (2.5-fold and 27-fold, respectively). There was a good correlation between increases in α-GST (Figure 5) and clusterin (Figure 6) and the presence of grade 3 or 4 tubular degeneration/necrosis of the S3 segment at the high dose on day 5. Urinary μ-GST was increased in Han-Wistar rats at 3 mg/kg on days 3 and 5 (2.8-fold in both conditions). Urinary RPA-1 was significantly increased at 3 mg/kg on day 5 (2.9-fold) and on day 3 (1.3-fold). Although there was a good concordance between increases in μ-GST (Figure 7) and RPA-1 (Figure 8) and the presence of moderate or marked tubular degeneration/necrosis of S3 segment at the individual animal level at the high dose on day 5, these increases were of low magnitude relative to marker variability (μ-GST) or dynamic range (RPA-1).
Changes in novel biomarkers of nephrotoxicity in Han-Wistar rats.
* p < .05 in Student t-test.
** p < .01 in Student t-test.
Discussion
The objective of this study was to evaluate the performance of the novel biomarkers examined in comparison with the traditional clinical pathology parameters as indicators of nephrotoxicity using the drug cisplatin and two strains of rat commonly used in the pharmaceutical industry. Thus, male Sprague-Dawley and Han-Wistar rats were given a single intraperitoneal dose of 0.3, 1, or 3 mg/kg of cisplatin to produce dose-dependent lesions in the proximal tubule (Yao et al. 2007). Serum and urine samples were collected in parallel with histopathological evaluation of kidney on days 2, 3, and 5 to relate the response of traditional clinical pathology parameters in serum and urine as well as the new urinary biomarkers α-GST, μ-GST, clusterin, and RPA-1 to renal histopathology. There were some minor differences in the protocols between the two laboratories involved in this study, for example, for methods of anesthesia and euthanasia, creatinine and total protein measurement, processing of kidneys for histopathological examination. However, such differences in practice between laboratories are common in the conduct of animal toxicity studies and provide real-world context. These differences in study protocols were not considered to compromise the primary objective of determining whether the novel biomarkers performed better than traditional clinical pathology parameters as indicators of nephrotoxic injury.
Characteristic degeneration and necrosis of the S3 segment of the renal proximal tubule was observed in both Sprague-Dawley and Han-Wistar rats given 1 and 3 mg/kg cisplatin on days 3 and 5 with severity ranging from minimal to marked. The localization of injury to proximal tubule profiles within the outer stripe of the outer medulla (OSOM) was confirmed by immunohistochemistry using antibodies directed against α-GST. Similarly, the absence of injury to collecting duct and medullary thick ascending limb profiles within this region was confirmed with IHC for aquaporin-2 and Tamm-Horsfall protein, respectively. Han-Wistar rats exhibited greater sensitivity to nephrotoxic injury due to cisplatin than the Sprague-Dawley rats, as indicated by the occurrence of changes at earlier time points and at lower dosages in the Han-Wistar rats. Strain differences in the severity of toxic response to chemicals, including nephrotoxicants, are known to occur (Kacew, Ruben, and McConnell 1995; Mazze, Cousins, and Kosek 1973; Newton et al. 1983a, 1983b; Tarloff, Goldstein, and Hook 1989). However, this would not be a confounding factor in the evaluation of the diagnostic utility of the biomarkers in this study since biomarkers were assessed at the individual animal level relative to time-matched control animals of the same strain.
The new urinary biomarkers α-GST (specific for proximal tubule) and clusterin (a general renal injury biomarker with no specific nephronal location) were increased at 3 mg/kg on days 3 and 5 in both Sprague-Dawley and Han-Wistar rats, and also at 1 mg/kg on day 5 in Han-Wistar rats. The response was qualitatively the same in both strains. At the individual animal level, the increases of α-GST and clusterin correlated with the presence of moderate or marked tubular necrosis of S3. There was a relatively subtle difference in the quantitative response in individual animals, in that there seemed to be a higher response of α-GST to the same level of injury in Han-Wistar rats as compared with Sprague-Dawley rats. However, this observation was based on a small number of animals and both within and between strains there was overlap between urinary biomarker levels and histopathology severity scores. Furthermore, the same apparent difference in magnitude of response between strains was seen with the conventional biomarker, BUN (Figure 3). In any case, quantitative differences in biomarker response to the same severity of injury would only be problematic if trying to determine a fixed threshold (or normal range) for diagnosis of injury applicable to both strains. In both strains, the magnitude of increase of α-GST and clusterin was higher than the traditional parameters tested (serum creatinine, BUN, urinary NAG, and total protein), and the increase was observed earlier (on days 3 and 5 instead of only on day 5). This is consistent with data from Kharasch et al. (1997) reporting that α-GST was the most sensitive biomarker of mild proximal tubular cell necrosis in a study of the effects of volatile anesthetics on the kidney in rats. In addition, measurement of the GST isoforms in urine was found to be more sensitive than either BUN or creatinine for detection of tubular injury in a study with human volunteers administered volatile anaesthetics (Eger et al. 1997). Clusterin has also been detected in the urine of rats treated with gentamicin before serum creatinine changes were evident (Aulitzky et al. 1992; Eti et al. 1993). Of note, urinary clusterin was recently qualified by the Critical-Path Institute Predictive Safety Testing Consortium (PSTC), and data submitted to the Food and Drug Administration (FDA) and the European Medicines Evaluation Agency (EMEA) was considered sufficient to support the voluntary use of urinary clusterin as biomarker of drug-induced acute kidney tubular alterations in rat studies to support clinical trials (Critical-Path Institute 2008).
Urinary albumin levels were increased at 3 mg/kg on days 3 and 5 in Sprague-Dawley rats in parallel with increases of α-GST and clusterin. Although this limited data set is insufficient to draw any conclusions about the diagnostic utility of albuminuria for proximal tubular injury in rats, it merits further evaluation, particularly in the light of the findings of the recent Critical-Path Institute PSTC Consortium biomarker qualification submission that urinary albumin showed high sensitivity for tubular necrosis and degeneration in the rat (Critical-Path Institute 2008). Normally, filtered albumin is largely reabsorbed in the proximal tubule. Therefore, in the absence of glomerular injury, which can cause an increased filtered load that can saturate proximal tubular reabsorption mechanisms resulting in frank proteinuria, the presence of small amounts of albumin in urine is considered indicative of reduced functional (reabsorptive) capacity in the proximal tubules (Russo et al. 2007). Microalbuminuria, defined as a urinary albumin loss of 30-300 mg/24 hours, has also been reported in humans treated with cisplatin (Kern et al. 2000; Koch Nogueira et al. 1998), ifosfamide (Koch Nogueira et al. 1998), methotrexate (Koch Nogueira et al. 1998), and gentamicin (Tugay et al. 2006). However, microalbuminuria may also occur in the setting of vigorous exercise, urinary tract infection, and dehydration (Vaidya, Ferguson, and Bonventre 2008). While this lack of specificity of urinary albumin for acute kidney injury may compromise its utility, concurrent evaluation of novel urinary markers, particularly those with specificity for the proximal tubule, such as α-GST or kidney injury molecule-1 (KIM-1) (Ichimura et al. 2004), will improve monitoring of renal injury.
Two other novel biomarkers were tested in this study: μ-GST, which is localized in the distal tubules; and RPA-1, a rat-specific marker of collecting duct injury. Although a higher degree of variability was noted with μ-GST relative to the other biomarkers investigated, a significant increase of μ-GST was observed at 3 mg/kg on day 5 in both rat strains. RPA-1 was increased at 3 mg/kg on day 3 in Sprague-Dawley rats and on day 5 in Han-Wistar rats. While these findings may indicate concomitant damage of distal tubules and/or collecting ducts as S3 segment, thick ascending limb and collecting ducts colocalize within the OSOM; they may also represent indirect effects on distal nephron segments secondary to proximal tubular injury.
In conclusion, α-GST and clusterin are promising urinary biomarkers that can detect the presence of proximal tubular necrosis as early as 48 hours after injury with cisplatin in two strains of rat. The addition of urinary albumin may improve detection of tubular injury at the individual animal level. The combination of these biomarkers with other novel urinary markers including KIM-1, cystatin C, and β2-microglobulin, recently qualified by Critical-Path Institute PSTC and approved for detection of early acute drug-induced renal toxicity in rats by the FDA and the EMEA (Critical-Path Institute 2008), will not only improve noninvasive monitoring of renal damage but also help localize the area of the nephrotoxic injury. The next step will be to qualify these nephrotoxicity biomarkers in clinical safety studies to evaluate human risk for drug-induced kidney injury. This work will be performed in the context of consortia like C-Path PSTC and the Innovative Medicines Initiative Safer and Faster Evidence-Based Translation (IMI-SAFE-T) project (Dieterle et al. 2009).
Footnotes
Acknowledgments
We thank Pascal Le Priol and Agnès Chrétien from sanofi-aventis R&D and Daniela Kirchhoff, Peter Slabke, Ronald Vorrath, and Wolfram Melinat from Bayer Schering Pharma AG for excellent technical assistance in this work; Rosanna Mirabile, GlaxoSmithKline, for immunohistochemistry; and Andrew Roche and Martin Shaw from Argutus Medical Ltd (formerly Biotrin) for helpful discussions.
The International Life Sciences Institute (ILSI) Health and Environmental Sciences Institute (HESI) Committee on Biomarkers of Nephrotoxicity is a consortium of pharmaceutical companies and government and academic scientists, whose mission is to advance development of biomarkers of target organ toxicity that bridge from the preclinical to the clinical stages of drug development. Participants in the consortium are Astra-Zeneca, Bayer Schering, Argutus (formerly Biotrin), Bristol-Myers Squibb, GlaxoSmithKline, Pfizer, sanofi-aventis, and the University of Arizona. HESI is an international, nonprofit organization that stimulates and supports scientific research that contributes to the collaborative identification and resolution of health and environmental issues of concern to the public, scientific community, government agencies, and industry.
Abbreviations
References
Supplementary Material
Please find the following supplemental material available below.
For Open Access articles published under a Creative Commons License, all supplemental material carries the same license as the article it is associated with.
For non-Open Access articles published, all supplemental material carries a non-exclusive license, and permission requests for re-use of supplemental material or any part of supplemental material shall be sent directly to the copyright owner as specified in the copyright notice associated with the article.