
Abstract
Donepezil hydrochloride is a reversible acetyl cholinesterase inhibitor approved for Alzheimer disease treatment. As an alternate therapy, a donepezil hydrochloride transdermal patch is in development. Recommended nonclinical safety studies include a 3-month Good Laboratory Practice (GLP) dose-range finding (DRF) study prior to conducting the 2-year dermal carcinogenicity study in rats. Demonstration of systemic exposure is necessary to interpret the in vivo data. Previous nonclinical reports supporting oral dosing have utilized liquid chromatography tandem mass spectrometry (LC/MS/MS) to quantify donepezil concentrations in plasma. Smaller species with limited blood volumes do not allow serial sampling to derive the full pharmacokinetic profile from a single animal. Therefore, the option of another analytical method requiring decreased sample volumes is desirable as it would decrease the required number of animals while obtaining the complete profile. The dried blood spot (DBS) technique allows drug level measurement from a few microliters; however, the method is still not widely utilized in GLP studies. Because donepezil plasma levels are known by the oral route, DBS was used to bridge the previous oral data and to support a 13-week GLP DRF study for repeated topical application in rats, comparing oral administration with 4 topical formulations. The DBS method was validated and demonstrated robustness and reproducibility for application to the DRF study. The assay results were comparable to a previously reported plasma LC/MS/MS assay-derived pharmacokinetic profile and provided justification for selection of the topical formulation and dose levels for the subsequent dermal carcinogenicity study.
Introduction
Interest in the DBS analytical methodology is increasing especially in the areas of pediatric and toxicology studies. The method allows smaller collection volumes and easier sample handling techniques and storage, that is, cards stored at room temperature. Despite its development in the 1960s, use of the methodology is not wide-spread outside of screening studies. 1 Bioanalytical method validation procedures have been described, in detail, using liquid chromatography tandem mass spectrometry (LC/MS/MS) plasma analysis in the American Association of Pharmaceutical Scientists / Food and Drug Administration (AAPS/FDA) joint bioanalytical workshops and in guidances. 2 –5 Further, the LC/MS/MS method to detect donepezil in plasma is well described. 6 –8 Specific requirements for DBS validation have not been published in a regulatory guidance; however, DBS is a viable alternative to the traditional plasma LC/MS/MS method contingent on appropriate validation procedures. In addition to validation procedures described for plasma bioanalytical assays, the DBS method has additional points for consideration. 9,10 For example, the following must be optimized to support a validated assay: choice of card, the spotting volume, the detection limit, homogeneity, hematocrit range, internal standards (ISs), and the extraction efficiency and stability on the card and throughout the handling process. To reduce the number of animals required for toxicokinetic evaluation of a Good Laboratory Practice (GLP) dose-range finding (DRF) assay, the DBS method was evaluated.
The objective of this study was to validate the DBS assay for donepezil and apply it to blood sample analysis of a 13-week GLP rat DRF study and compare between oral transdermal delivery and with previous oral data. The DRF study was conducted with 4 topical formulations in comparison to oral gavage. The goal of the DRF study was to determine dose levels and select the formulation for a subsequent 2-year dermal carcinogenicity study. The topical formulations support the donepezil hydrochloride transdermal patch currently under development for the treatment of Alzheimer disease (AD).
Transdermal patch delivery provides a viable treatment option for patients with mild to moderate AD; with important potential benefits including avoidance of gastrointestinal (GI) tract and first pass metabolism, and may mitigate the common direct gastrointestinal effects of nausea, vomiting, and diarrhea. 11 Additionally, in elderly patients, the transdermal route has several advantages over the oral route including maintenance of sustained therapeutic plasma concentrations, alternate administration route for those patients with difficulty swallowing, visual confirmation of patient compliance, and reduced systemic adverse effects.
Materials and Methods
Chemicals
Donepezil hydrochloride (HCl) was purchased from Ranbaxy Laboratories Ltd. Additional chemicals were of either USP or analytical grade available commercially. Dried blood spot (DBS) cards used were Whatman FTA DMPK-A cards (GE Healthcare, P#WB129241, Buckinghamshire, United Kingdom).
Formulations
Donepezil HCl for oral gavage was formulated at a concentration (w/v) of 1 mg/mL in deionized water. Topical formulations had 5%, 12.5%, or 25% donepezil HCl with Eudragit E100, glycerin, triethyl citrate, and sorbitan monolaurate in either acetone or isopropanol. Acetone and isopropanol were selected as vehicles for topical application based upon previous nonclinical safety data. 12 The highest concentration (25%) of donepezil HCl was also prepared in a formulation containing only Eudragit E100 with either acetone or isopropanol to directly compare to the formulations with the components listed above. A transdermal patch containing donepezil HCl was used to compare with the topical formulations in the in vitro flux assay.
In vitro Flux
Assessment of skin flux was performed to confirm transport of donepezil across epidermal layers utilizing the proposed vehicles, acetone and isopropanol. Additionally, the formulations were compared to the transdermal patch to estimate the dose range for in vivo application. Skin flux was performed on stratum corneum separated from cadaver skin and punched to a diameter of 3.2 cm. The skin sample was placed over a Franz cell chamber with approximately 10 mL of phosphate-buffered solution and maintained at 37°C with a circulating water bath. The permeation area of the Franz cell had a diameter of 1.5 cm. Approximately 1 mL of each paste formulation or a 1.59 cm (diameter) transdermal patch was applied to each chamber and samples collected at various time intervals over a 3-day period.
Animals
Male and female Sprague-Dawley rats (Crl:CDSD) obtained from Charles River Laboratories (Kingston, New York), were ~8 weeks of age with a target weight range of 200 to 300 g (males)/150 to 250 g (females). The animals were administered vehicle or donepezil HCl, daily for 13 weeks (n = 10/sex/dose group). The oral donepezil HCl dose level was 10 mg/kg and administered by oral gavage at a volume of 10 mL/kg. The topical doses ranged from 50 to 250 mg/kg and were administered at a volume of 1 mL/kg in a solution or suspension, depending on the dose. The topical dose volume was 10% of the body surface area, based on the most recent body weight measurement. The vehicle groups were either water for the oral dose group or acetone and isopropanol for the topical applications.
Animals were monitored for mortality, body weight, food consumption, clinical observations, and dermal scores (topical administration only) throughout the dosing period. Clinical pathology, including standard hematology and serum chemistry parameters, was evaluated on ~day 45 and at termination. At termination (~day 90), animals were humanely euthanized and tissues collected for microscopic evaluation.
Approximately 0.2 mL of blood was collected into tubes containing K2EDTA at predose, and 0.5, 2, 4, 8, 12 hours on day 1 and predose and 0.5, 1, 2, 4, 8, 12 and 24 hours on days 7, 28, 44, and 90 from animals administered donepezil HCl. The blood sample volume was sufficient to mix with the anticoagulant and spot on duplicate Whatman FTA DMPK-A cards using a repeater pipette. After spotting, the DBS card was allowed to air-dry at least 3 hours at room temperature. Each card was stored in a separate piece of folded wax paper that was cut to the appropriate size, placed in an amber plastic sealable bag, and stored at room temperature with desiccant packet/packets until analysis.
The procedures were reviewed by the responsible Institutional Animal and Use Committee. The study was performed in compliance with Good Laboratory Practice regulations (21 CFR, Part 58).
Dried Blood Spot Analysis
Sample
Whatman FTA DMPK-A cards were selected based upon reproducibility across the analytical concentration range as compared to other commercially available cards (data not shown). After drying, a 3-mm punch was collected from each spot on the DBS card and used for analysis. Protein-precipitation extraction (methanol and formic acid in 5 mmol/L ammonium formate and collected by centrifugation) of the samples was performed and analyzed using liquid chromatography/tandem mass spectrometry (LC/MS/MS) with electrospray ionization and positive ion mode on an API 5000 as described below.
Validation
Blood spot volume and punch size. To determine the effect of different blood spot volume on quantitation, 6 DBS replicates at the medium quality control (QC) level were prepared at a low spot volume (~50% of method-specified volume), and 6 DBS replicates were prepared at a high spot volume (~200% of method specified volume). The QC concentrations were calculated from a calibration curve prepared with the method-specified blood spot volume and were compared against theoretical. The acceptance criteria for blood spot volume were that the mean concentration of the test QCs be ≤15.0% from target; and the % coefficient of variation (CV) ≤15.0%.
Standard calibrator and QC range. Donepezil-d4 was used as the IS and the assay validated in the range of 1.00 to 1000 ng/mL. Utilizing the calibration standard concentrations of 1, 2, 5, 25, 100, 500, 850, and 1000 ng/mL, the inter-assay accuracy (% bias) ranged from −3.4% to 2.0% and the precision (%CV) ranged from 1.2% to 11.8%.
The DBS homogeneity was also assessed using accuracy and precision QCs. “Intracard” homogeneity was determined by the 6 individual QC replicates “punched” from a single card in each run, and the “intercard” homogeneity was determined from the mean statistics of 3 separate runs on separate cards.
The ability to dilute was evaluated by preparing QC samples containing analyte at a concentration greater than the upper limit of the calibration curve. Test samples were analyzed after dilution with QC0 extract to a quantifiable level within the calibration curve. The acceptance criterion was ≤15.0% deviation of the mean concentration from target; and the %CV was ≤15.0%. The ability to dilute was determined as 4000 ng/mL with a dilution factor of 10.
Carryover was evaluated in each accuracy and precision run by injecting 2 control blanks after the second replicate of the highest calibration standard. The DBS processing carryover (punch and mat) was assessed by cutting a control blank sample “punched disc” (without IS) from a DBS card immediately after cutting a upper limit of quantitation (ULOQ) sample “punched disc” from a DBS card. Analyte carryover was considered acceptable if no peaks greater than 20.0% of the peak area from the lowest acceptable lower limit of quantitation (LLOQ) standard was detected in the control blank samples at the retention time of the analyte. The IS carryover was considered acceptable if no peaks greater than 5.00% of the mean peak area of IS response for all nonblank samples in the run were detected in the control blank samples at the retention time of the IS. No carryover was detectable.
Method selectivity was determined using different matrix lots from individual donors and analyzed as selectivity blank samples. For the analyte, the acceptance criteria was that interfering peaks at the retention time of the analyte must be ≤20.0% of the peak area from the lowest acceptable LLOQ standard for the analyte. For the IS, interfering peaks at the retention time of the IS was ≤5.00% of the mean IS response for all nonblank samples in the run. No interference greater than the acceptable limits were detectable at the retention times of interest.
Matrix effects
The LLOQ reproducibility was determined using different matrix (blood collected from Sprague-Dawley rats) lots from individual donors and analyzed as LLOQ concentration samples. The acceptance criterion was ≤20.0% deviation of the mean measured concentrations of the reproducibility LLOQ QCs from the target concentration with %CV ≤20.0%. The LLOQ reproducibility in this matrix had accuracy (%bias) of 6.0% and a precision (%CV) of 10.1%.
Matrix factor was determined by extracting the control blank matrix using 6 different lots of matrix (n = 1 for each lot). After extraction, each sample was spiked with analyte and IS. The resulting mean response was then compared to the mean response obtained from 6 injections of a neat solution containing the analyte and IS at the same concentrations as the spiked matrix samples. The acceptance criteria was that only 1 of the matrix factor samples from each test group could be rejected as an outlier or for other analytical reasons. The %CV of the peak response for each test group (with and without matrix) was ≤15.0%. The analyte matrix factor was 2.69 and the IS matrix factor was 2.71, indicating ionization enhancement.
Interference
The potential interference from analyte/analytes quantitated in the assay to other analytes or ISs within the assay was evaluated through injection of a matrix sample spiked with analyte at the ULOQ level. The analyte only test was performed in a single lot of matrix. The acceptance criteria for the interference response from the analyte to IS was ≤5.00% for the mean peak area of the internal standard for all nonblank samples in the run. No significant interference was found at the retention time of interest for analyte only samples.
The potential interference from the IS/ISs to analytes quantified in the assay was evaluated through the injection of a matrix sample spiked with IS at its spiking concentration level. The IS only test was performed in a single lot of matrix. The acceptance criterion for the interference response from IS to the analyte was ≤20.0% of the peak area from the lowest acceptable LLOQ standard for the analyte. No significant interference was found at the retention time of interest for IS only samples.
Internal standard recovery
The extraction recovery from a matrix was evaluated for each analyte and IS. Analyte extraction recovery was evaluated at 3 concentrations to determine whether a concentration bias was present. Internal standard extraction recovery was evaluated at a single concentration. The mean instrument response for analyte and IS spiked after extraction was compared to the mean instrument response for analyte and IS spiked into matrix prior to extraction. The acceptance criterion for %CV of replicates at each concentration (pre- and postprocess) was ≤20.0%. Analyte recovery at the low range was 88.5%, 95.6% for medium range, and 102.7% for the high-concentration range. The IS recovery was 99.8%.
Stability
Benchtop stability was determined by comparing the response obtained from a solution stored under the test conditions (ie, temperature, light exposure, etc) to the response obtained from an aliquot of the same solution (control) that was not subjected to the test conditions. The acceptance criterion for benchtop stability was %CV of replicate measurements of ≤10.0% for MS analysis. The mean response for the test solution did not differ from the mean response of the control solution by more than 10.0%. In addition, the freshly prepared (control) solutions were within 5% of each other. Benchtop stability for both analyte and IS was 6 hours in a water:methanol (50:50 v/v) solution stored in a glass container at room temperature and protected from light. Long-term analyte solution stability was determined to be 410 days in a water:methanol (50:50 v/v) solution stored at 1°C to 8°C.
Matrix stability was evaluated through the analysis of low and high QC samples at n = 6. The matrix stability QCs were analyzed along with duplicate calibration curves and analytical QCs. Stability was determined by subjecting matrix stability QCs to the test conditions and the concentrations were compared against theoretical. Matrix stability QCs were subjected to the extreme conditions that samples may encounter during shipment at “ambient” temperatures (up to 7 days at approximately −70°C and 45°C). Intermediate-term stability was demonstrated during the course of the validation by an ongoing analysis of QC samples against freshly prepared curves. The duration of stability was calculated from the time of QC preparation to completion of extraction of the last accuracy and precision run (<5 weeks). The acceptance criterion for stability was that the mean concentration of the test QCs be ≤15.0% from target and the %CV ≤15.0%. Stability in matrix at extreme temperatures was 7 days. At room temperature, stability in matrix was 34 days.
The reinjection reproducibility of processed samples was determined by reinjecting previously acceptable calibration standards and QCs that had been stored under specified test conditions. The QC concentrations were calculated from the reinjected calibration curve and were compared against theoretical. The acceptance criterion for reinjection reproducibility was that the mean concentration of the test QCs be ≤15.0% from target and the %CV ≤15.0%. The reinjection reproducibility was 148 hours with storage at 1°C to 8°C.
The extract stability of processed samples was determined by reinjecting previously acceptable QCs that were stored under specified test conditions along with a freshly extracted standard curve and analytical QCs. The QC concentrations were calculated from the freshly prepared calibration curve and were compared against theoretical. The acceptance criterion for extract stability was that the mean concentration of the test QCs be ≤15.0% from target and the %CV ≤15.0%. The extract stability was 44 hours when stored at 1°C to 8°C.
Whole blood stability was determined through comparison of whole blood samples spiked with analyte and processed to DBS under different storage conditions and at different time intervals. Whole blood (10 days after collection) spiked with analyte, followed immediately by spotting and processing to DBS (control) was compared against whole blood spiked with analyte that had been stored for specified time intervals and conditions prior to spotting and processing to DBS (test). The mean response of the test groups was compared to the mean response of the control group. The acceptance criterion for whole blood stability was a %CV of ≤15.0% and that the mean response for each test group did not differ from the mean response of the control group by more than 15.0%. Whole blood stability was 44 hours when stored at 1°C to 8°C.
To determine the stability of analytes during the drying period on the card, 3 time points were evaluated. Six DBS replicates were prepared at approximately the medium QC level at the following times: T minus ~20 to 24 hours (overnight drying); T minus ~3 to 4 hours (same day drying); Time Zero to 0 hour (no drying).
Because the time zero control group was not dried on the card, the entire spot was cut from the DBS card (all 3 groups, n = 6), and immediately extracted (ie, a 3-mm punched disc was not used for this test). The acceptance criteria for spot drying stability was a %CV of ≤15.0% and that the mean response for each test group did not differ from the mean response of the control group by more than 15.0%. Spot drying stability on the card was 24 hours with and without light protection.
Hemolysis and hematocrit
The presence of hemoglobin in samples and its effect on the precision and accuracy of the assay was evaluated. Hemolyzed (0.5% and 2.0%) matrix was prepared by spiking hemolyzed whole blood into nonhemolyzed whole blood to achieve the required percentage of hemolysis. The hemolyzed matrices and the nonhemolyzed control matrix were then spiked with analyte to achieve the low QC concentration. Six spots were prepared from each test group on separate DBS cards and allowed to dry for at least 3 hours prior to extraction. The response of the hemolyzed test group/groups was compared to the response of a nonhemolyzed control group. The acceptance criteria for hemolysis was %CV of ≤15.0% and that the mean response for each test group did not differ from the mean response of the control group by more than 15.0%. No significant impact on sample analysis was noted with up to 2.0% hemolysis.
The effect of varying hematocrit levels on the precision and accuracy of the assay was evaluated. Blank whole blood pools with hematocrit levels at approximately 25%, 35%, 45%, 55%, 65%, and 75% hematocrit were purchased or prepared. Hematocrit test QCs at approximately the medium QC level were prepared in each of the 6 whole blood pools. The hematocrit test QCs (n = 6 for each group) were extracted and the QC concentrations were calculated from a calibration curve prepared with 45% hematocrit and were compared against theoretical. The acceptance criteria for hematocrit was %CV of each group ≤15.0% and that the mean response for each test group did not differ from the mean response of the control group by more than 15.0%. No significant impact on sample analysis was noted with hematocrit values between 35% and 55%.
Toxicokinetics
Toxicokinetics (TK) parameters were estimated using WinNonlin pharmacokinetic validated software version 5.2.1 (Pharsight Corp, California) and a noncompartmental approach consistent with the oral and topical routes of administration. All parameters were generated from donepezil concentrations in whole blood collected on days 1, 7, 28, 44, and 90. Parameters were estimated using nominal sampling times relative to the start of each dose administration because the collection times were within acceptable sample collection time ranges. The concentration at time zero on day 1 was assumed to be 0 for the purpose of parameter estimation. Blood concentration values obtained at the predose time point were used to estimate the concentration at time zero on days 7, 28, 44, and 90.
The area under the donepezil blood concentration versus time curve (AUC) was calculated using the linear trapezoidal method with linear interpolation. The AUC (0-12) was used when comparing exposure and repeat dosing parameters relative to the first dosing occasion since the sampling interval was only 12 hours on day 1 and AUC (0-24) was calculated for the remaining occasions. When practical, the terminal elimination phase of each concentration versus time curve was identified using at least the final 3 observed concentration values. The slope of the terminal elimination phase was determined using log linear regression on the unweighted concentration data. Parameters relying on the determination of the terminal elimination phase were not reported if the coefficient of determination was less than 0.800, or if the extrapolation of the AUC to infinity represented more than 20% of the total area.
Results
In Vitro Flux
Figure 1A summarizes the in vitro skin flux for each paste formulation in comparison with the transdermal patch formulation. The in vitro flux data were used to determine the formulation dose range for the topical applications in vivo. Each paste formulation used 10% donepezil HCl drug loading in either acetone or isopropanol. The acetone paste formulation had increased initial flux over the first 24 hours; but after 72 hours, the flux was decreased relative to the patch. The isopropanol paste showed similar flux to the transdermal patch during the first 48 hours and increased relative to the patch at 72 hours. The formulations were indistinguishable in their cumulative flux (Figure 1B), reaching a maximum of ~25% to 35%. Because both paste formulations demonstrated similar in vitro flux to the transdermal patch, both formulations were subsequently tested in vivo.
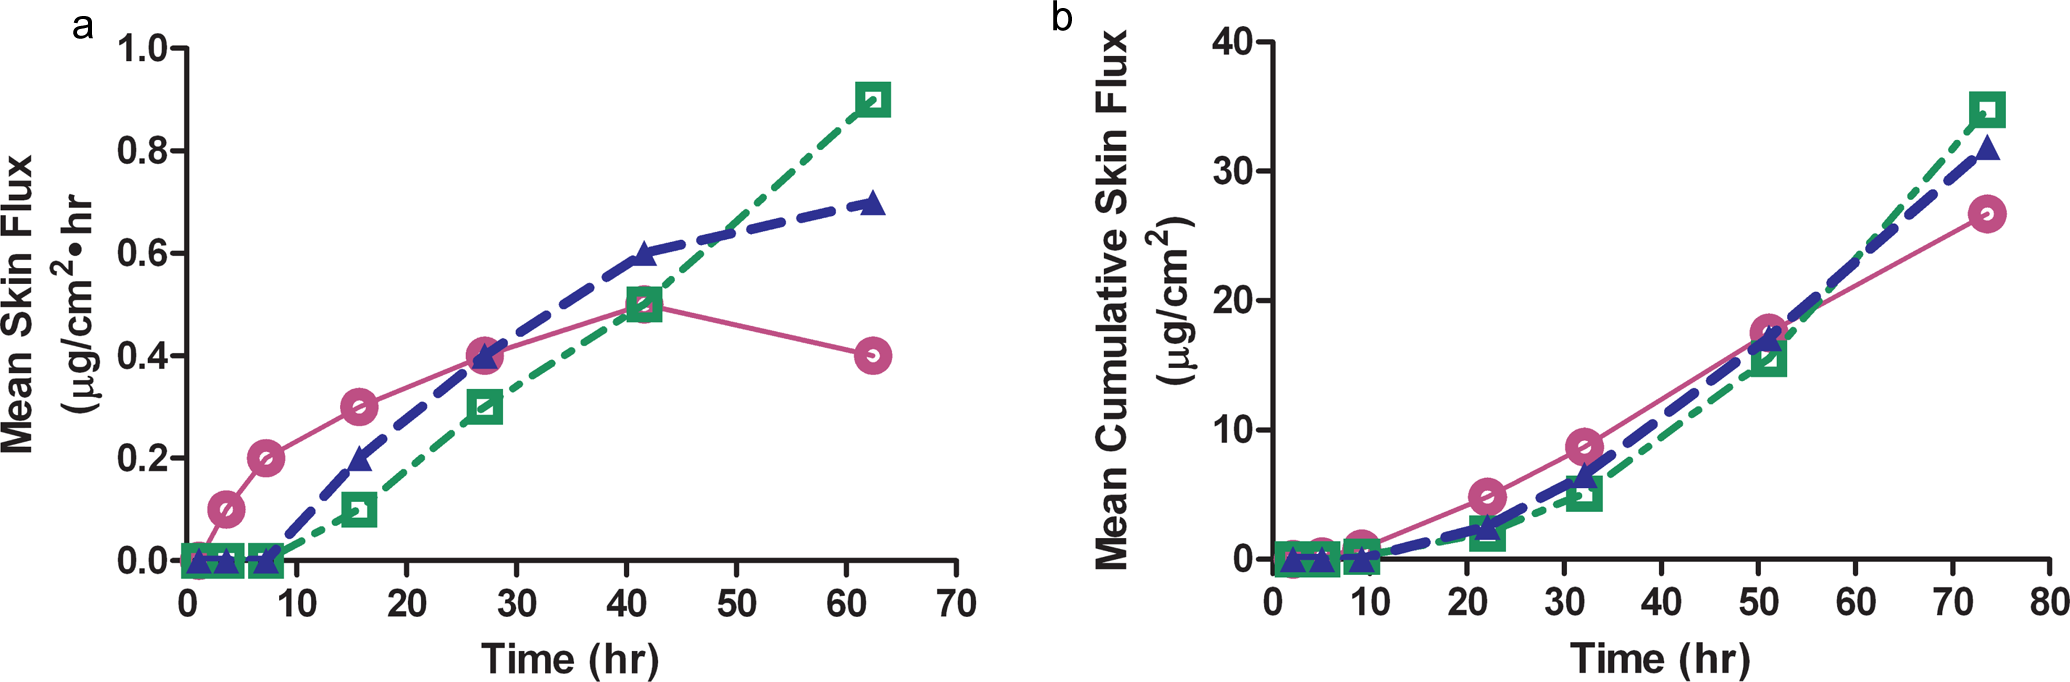
A, Mean in vitro skin flux over a 72-hour period for the acetone (○) and isopropanol ( □ ) paste formulations in comparison to the transdermal patch (▴). Values expressed as mean, n = 6 samples/time point and the time represents the midpoint of the sample collection time.
The DBS Assay
Selection of the card used for the DBS assay was determined by screening multiple cards and evaluating the cards for homogeneity. The Whatman FTA DMPK-A cards were chosen based upon uniform spotting, high recovery, and best precision. Acceptable spotting volumes were evaluated using 10, 15, and 25 µL and disc punch sizes of 3, 5, and 8 mm. No significant impact on the quantitative accuracy of the DBSs was observed using initial blood volumes ranging from 7.5 to 30 μL. The optimal solvent for the stable isotope-labeled IS (donepezil-d4) utilized a Hydrophilic Interaction Chromatography (HILIC) liquid chromatography (LC) column (SeQuant ZIC-HILIC 50 × 2 mm, 5 μm, The Nest Group Inc, Southboro, Massachusetts) with gradient elution using mobile phases consisting of formic acid, ammonium formate, and acetonitrile. The validated assay quantified donepezil in whole blood spotted on a card in the range of 1.00 to 1000 ng/mL. The LLOQ QC intra-assay accuracy (% bias) ranged from −9.2% to 5% and the precision (%CV) ranged from 7.3% to 15.4%. The LLOQ QC inter-assay accuracy (% bias) was −2.0% and the precision (%CV) was 5%. The acceptance criterion was ≤20.0% deviation of the mean concentration from target with the %CV ≤20.0%. The assay demonstrated excellent linearity (r2 > .993), selectivity, LLOQ reproducibility, accuracy (−6.3% to −1.7%), and precision (5.4%-13.3%) for all validation runs. The extraction recovery was approximately 90%, and the assay demonstrated acceptable quantitation from DBS with hematocrit levels ranging from 35% to 55%. Donepezil in DBS was shown to be stable during spotting and drying, when exposed to extreme temperatures for up to 7 days, and when stored at room temperature for up to 68 days.
Dose-Range Finding Study
The oral gavage dose of 10 mg/kg was chosen for comparison with the topical paste formulations as this dose was well tolerated in a 3-month and 12-month rat toxicity study. Additionally, the toxicokinetic data were reported for both toxicity studies (NDA 020,690). Due to the physicochemical properties of donepezil HCl in acetone and isopropanol, the concentration of the donepezil HCl in the topical formulations was limited to 5%, 12.5%, and 25%. Stability of the dose formulations was demonstrated after storage at room temperature for 14 days (data not shown).
Oral administration (gavage) of donepezil HCl (10 mg/kg) was generally well tolerated by Sprague-Dawley rats although females exhibited increased salivation, consistent with the cholinergic signs induced by donepezil. Males administered oral donepezil showed an ~10% body weight loss over the study duration. Topical administration of donepezil HCl induced a transient, dose-responsive increase in neurologic and motor clinical signs. Topical formulations induced transient dose-responsive increases in clinical observations and 5% to 7% body weight loss in males administered 125 mg/kg and >10% body weight loss at 250 mg/kg (addition of Eudragit alone). There were no test article–related clinical, macroscopic, or microscopic pathology findings associated with either route. Other than clinical observations and weight loss, the topical formulations, regardless of vehicle utilized, were well tolerated over the course of the 90 days.
Bioanalysis
Each run was evaluated to ensure that the acceptance criteria set for the calibration curve points were met, for the LLOQ and for the analytical QC samples. A representative chromatogram is found in Figure 2. Samples were analyzed within the sample stability period determined during the assay validation. Ten percent of study samples were selected for incurred sample reanalysis (ISR) and 98.2% of the ISR samples met the acceptance criteria.
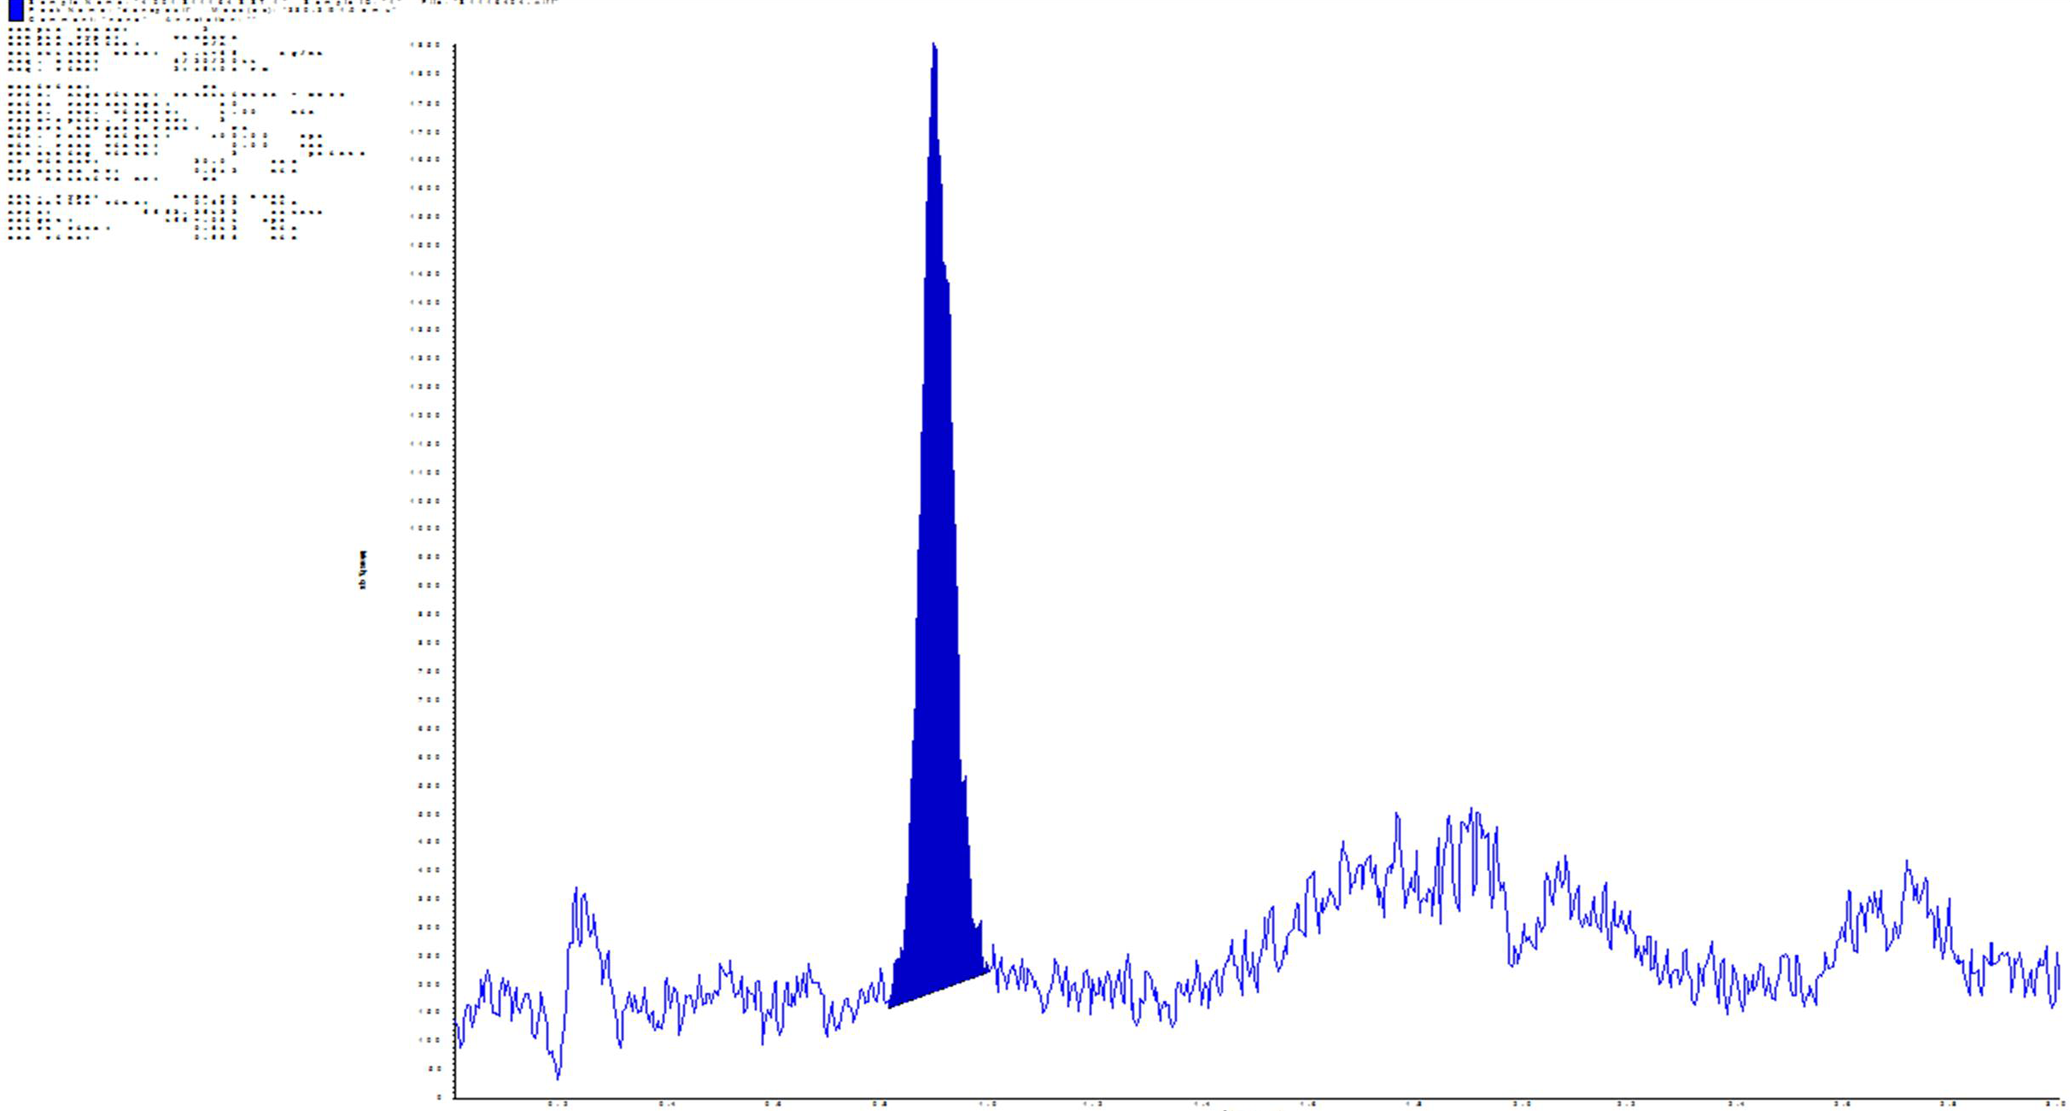
Representative chromatogram for donepezil.
Toxicokinetics
Animals administered the vehicles, water, acetone, or isopropanol, had donepezil concentrations below the level of quantification for the assay.
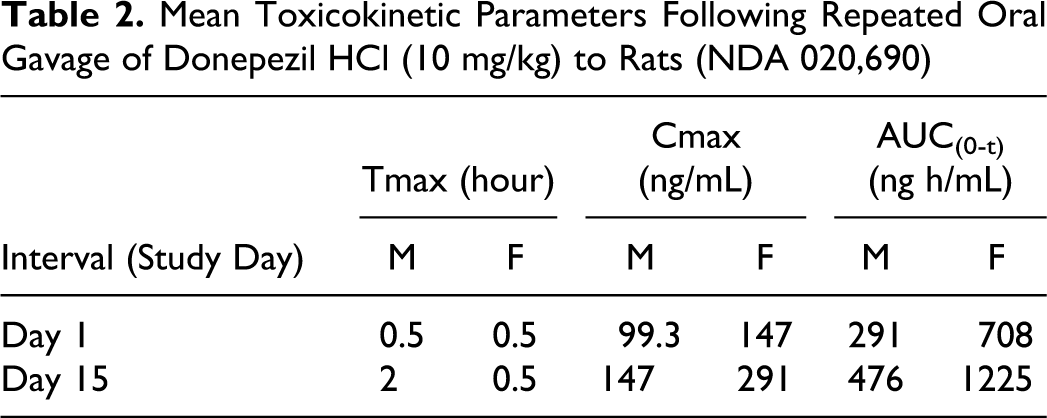
In the oral dose group (10 mg/kg), peak plasma concentrations generally occurred at 0.5 hour postdose while in the topical application groups, peak concentrations generally occurred between 0.5 and 12 hours postdose except on day 90, where Tmax occurred between 0.5 and 4 hours postdose (Figure 3). When data were available to calculate the terminal T1/2, it ranged from 3.4 to 5.4 hours in the oral dose groups throughout the study duration (Table 1). By comparison, the pharmacokinetic data after oral gavage of 10 mg/kg to unfasted rats derived from NDA 020,690 (oral donepezil HCl) is presented in Table 2.
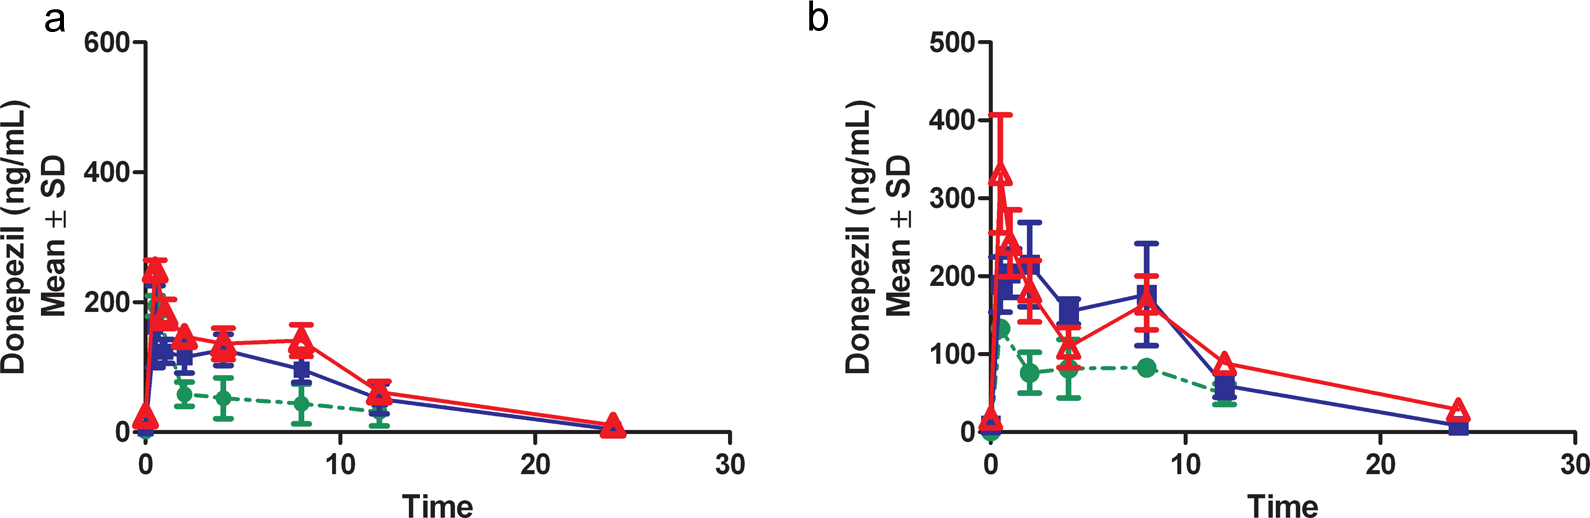
Pharmacokinetic profile from male (A) and female (B) after oral gavage (10 mg/kg) on days 1(•), 7 ( ▪ ), and 90 (▵).
Mean Toxicokinetic Parameters Following Oral Gavage of Donepezil HCl (10 mg/kg) to Sprague-Dawley Rats
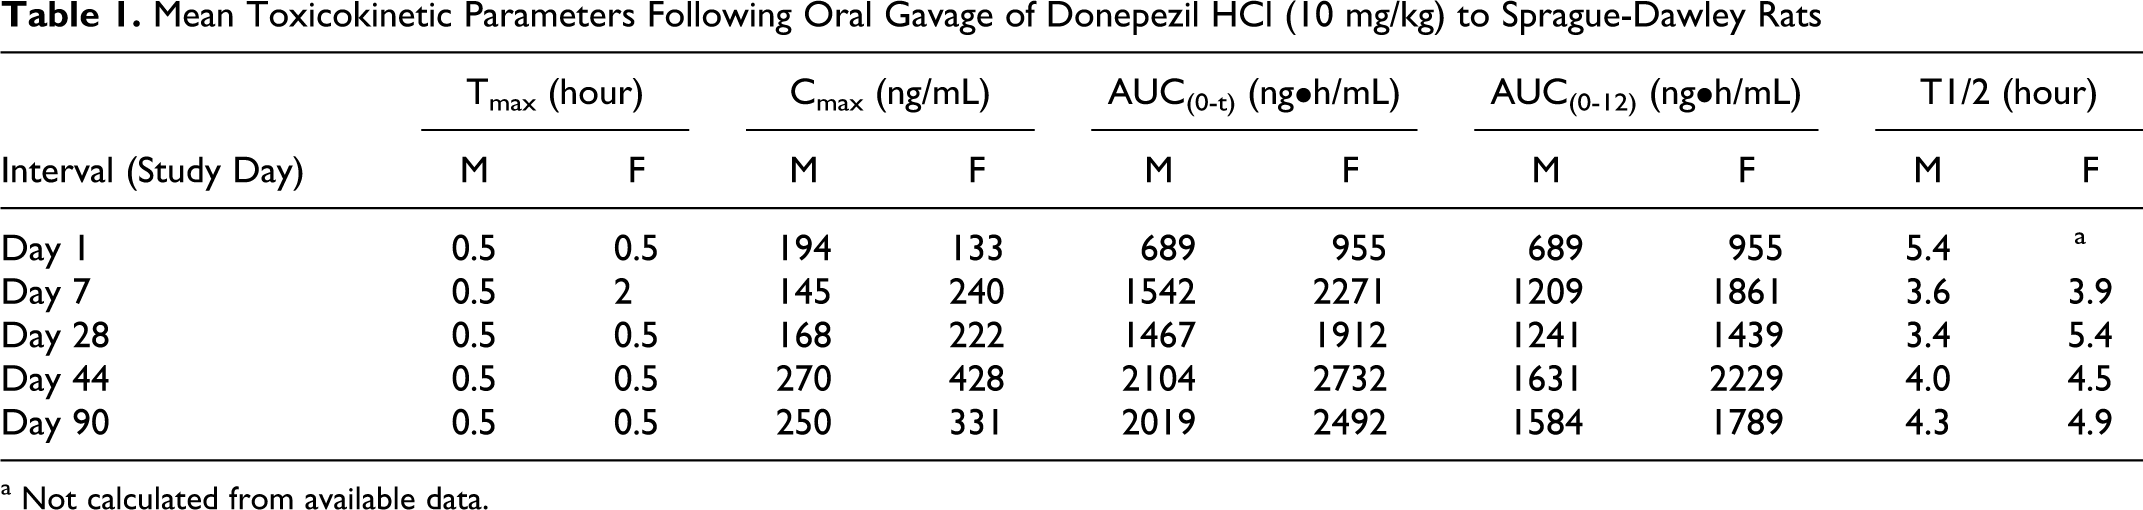
a Not calculated from available data.
Mean Toxicokinetic Parameters Following Repeated Oral Gavage of Donepezil HCl (10 mg/kg) to Rats (NDA 020,690)
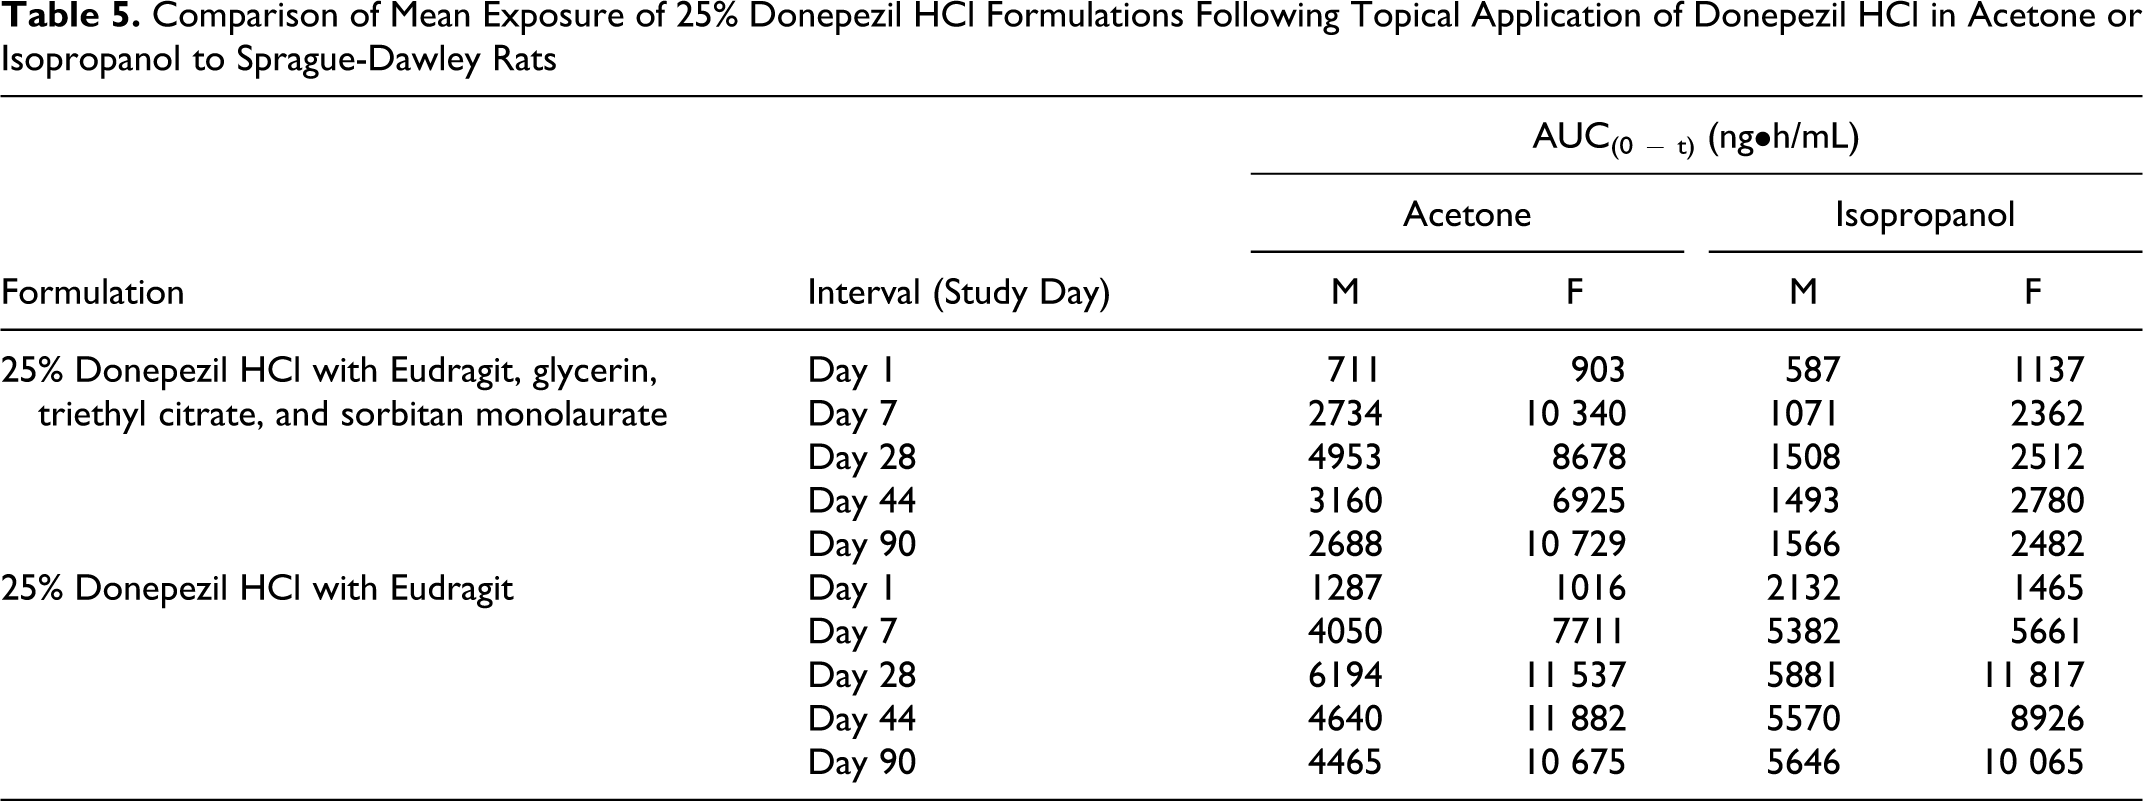
The exposure between the 125 and 250 mg/kg dose groups was similar for both donepezil HCl in acetone and isopropanol, indicating that the increase in applied dose did not increase the blood concentration of donepezil. For the topical application of donepezil HCl in acetone or isopropanol, exposure was generally less than dose proportional between the 50 and 250 mg/kg and between 50 and 125 mg/kg (Tables 3 and 4, Figures 4 and 5). However, comparison between exposures achieved with both the 250 mg/kg dose levels where the formulations comprised of only donepezil HCl and Eudragit, generally showed increased exposure (Table 5). Although, the dose administered orally was at least 25× lower than the doses administered topically, exposure of donepezil corrected for dose was at least 3 to 5× higher in the oral group on all occasions. This observation is consistent with the likely increased oral bioavailability relative to topical application.
Mean Toxicokinetic Parameters a Following Topical Application of Donepezil HCl in Acetone to Sprague-Dawley Rats
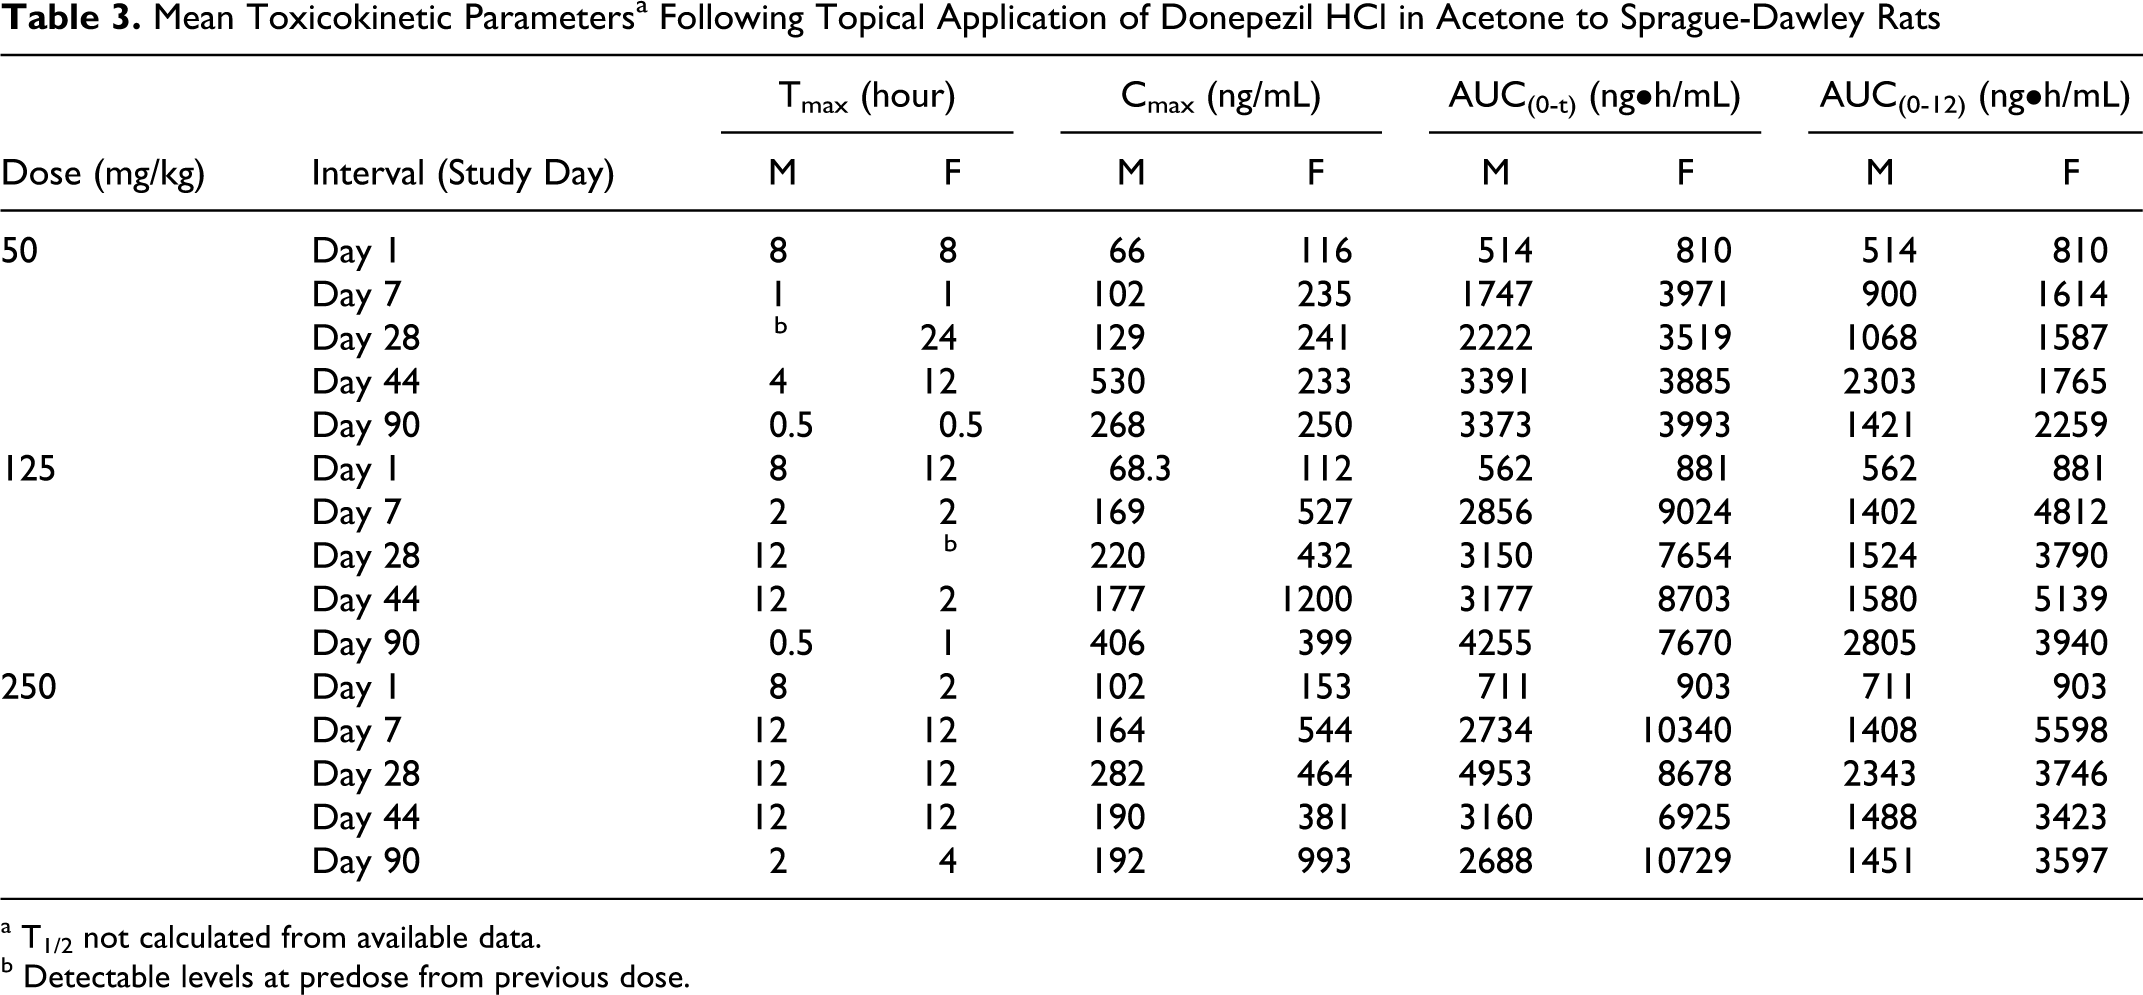
a T1/2 not calculated from available data.
b Detectable levels at predose from previous dose.
Mean Toxicokinetic a Parameters Following Topical Application of Donepezil HCl in Isopropanol to Sprague-Dawley Rats
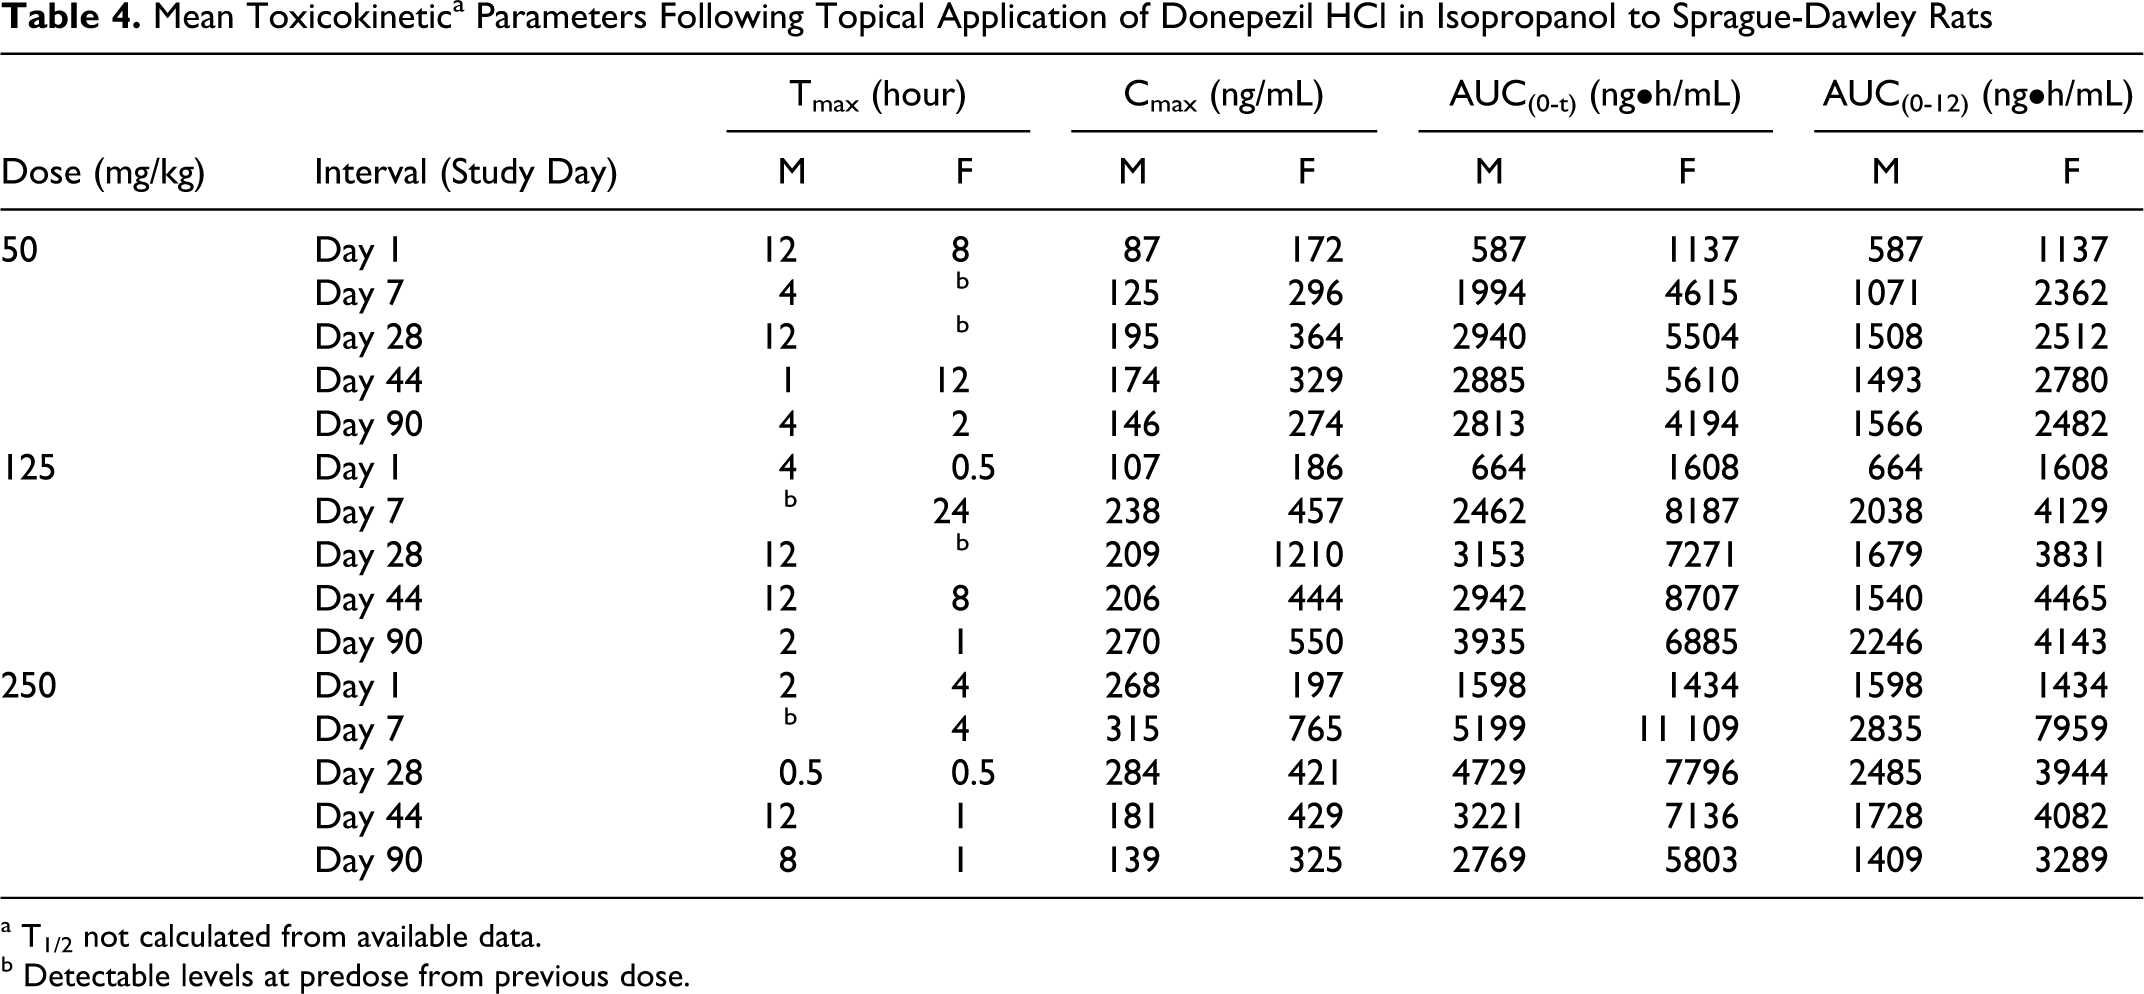
a T1/2 not calculated from available data.
b Detectable levels at predose from previous dose.
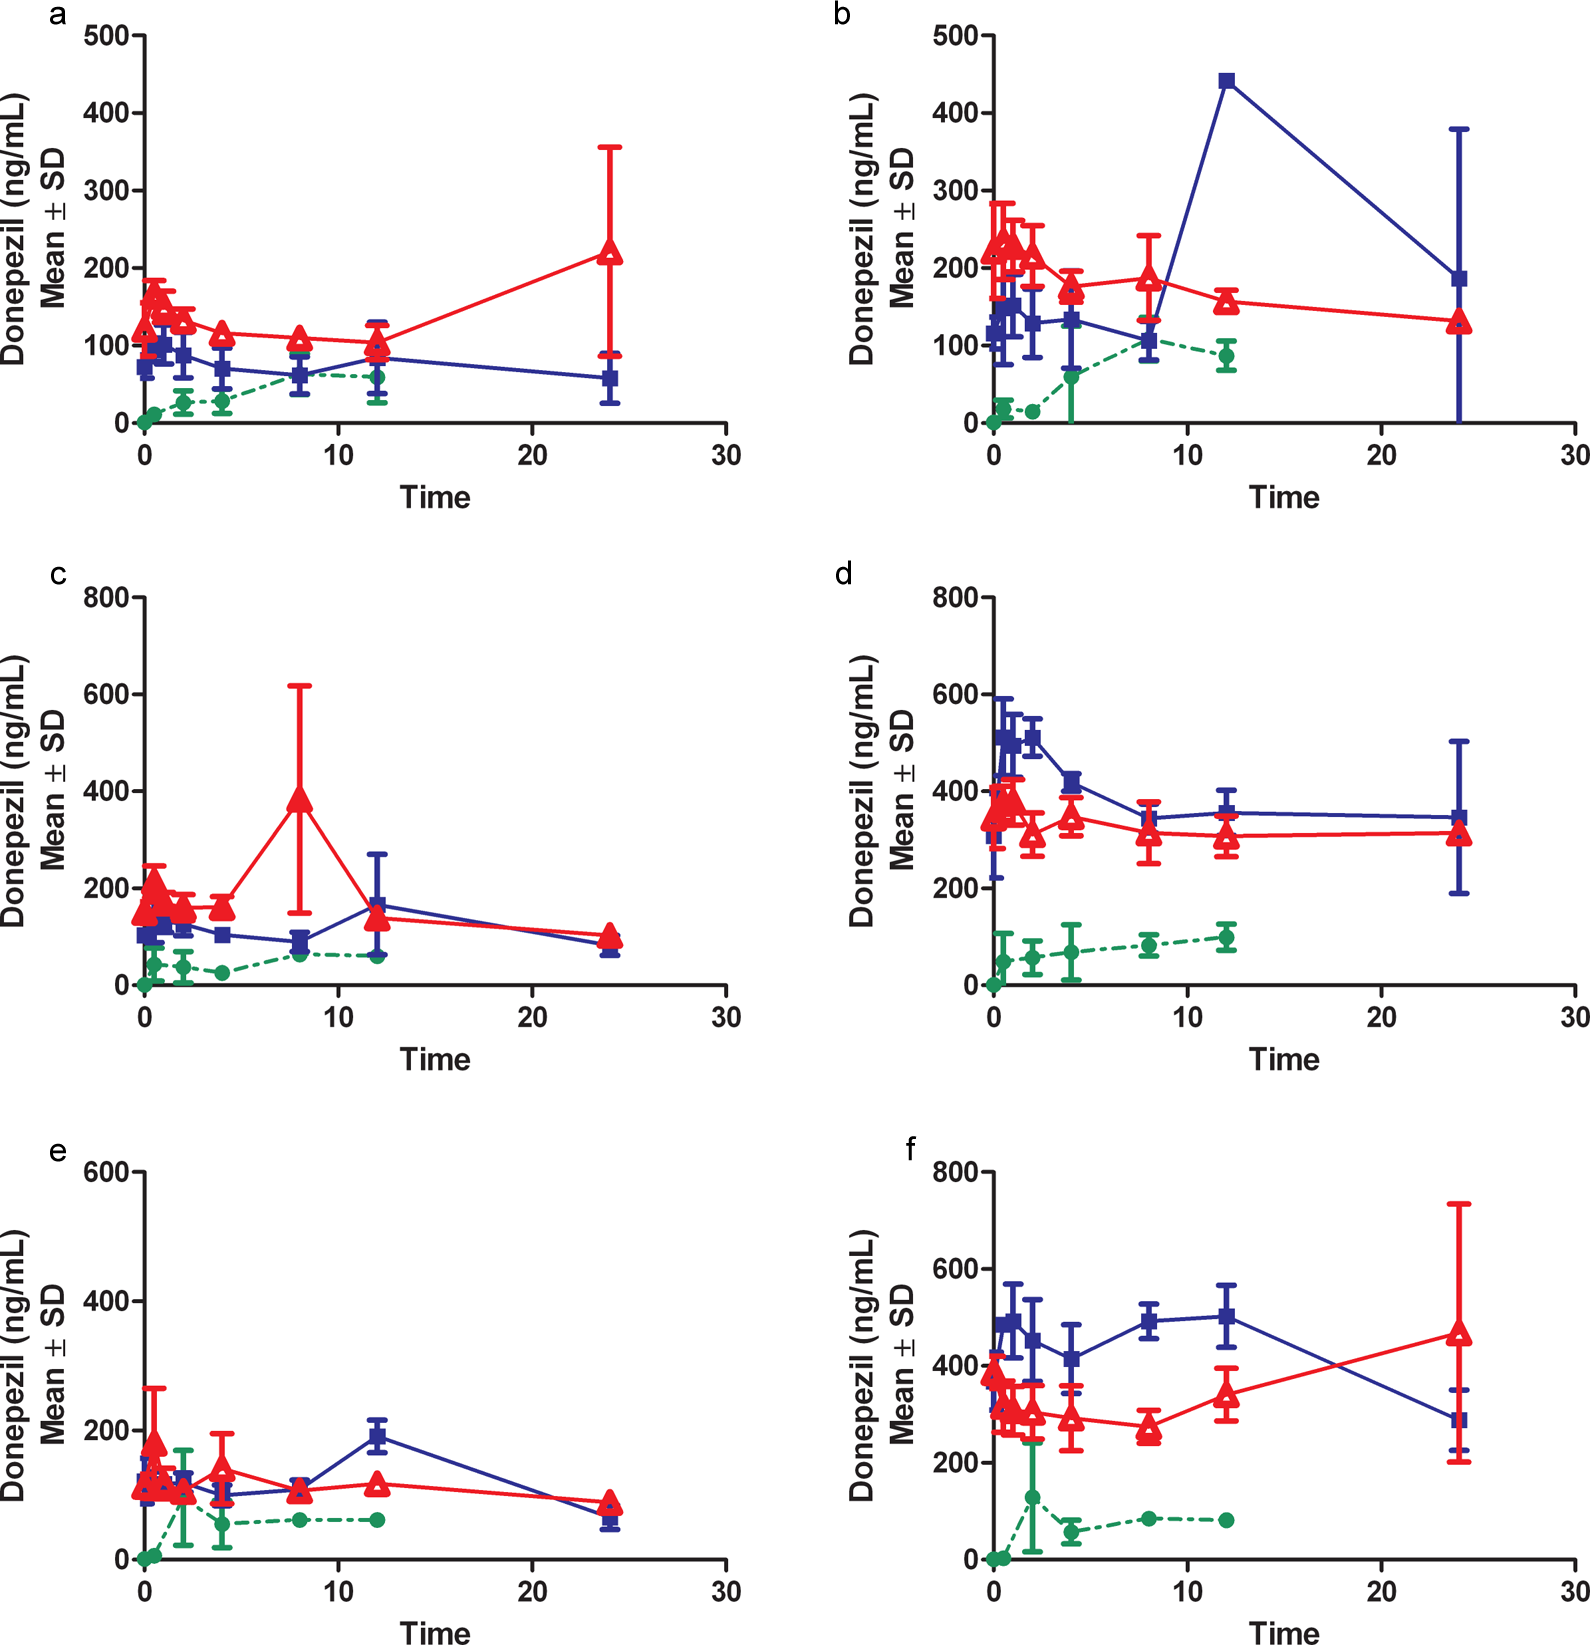
Pharmacokinetic profile from males (A, C, E) and females (B, D, F) after topical administration of 50, 125, and 250 mg/kg, respectively, donepezil HCl dose levels in acetone vehicle on days 1(•), 7 ( ▪ ), and 90 (▵).
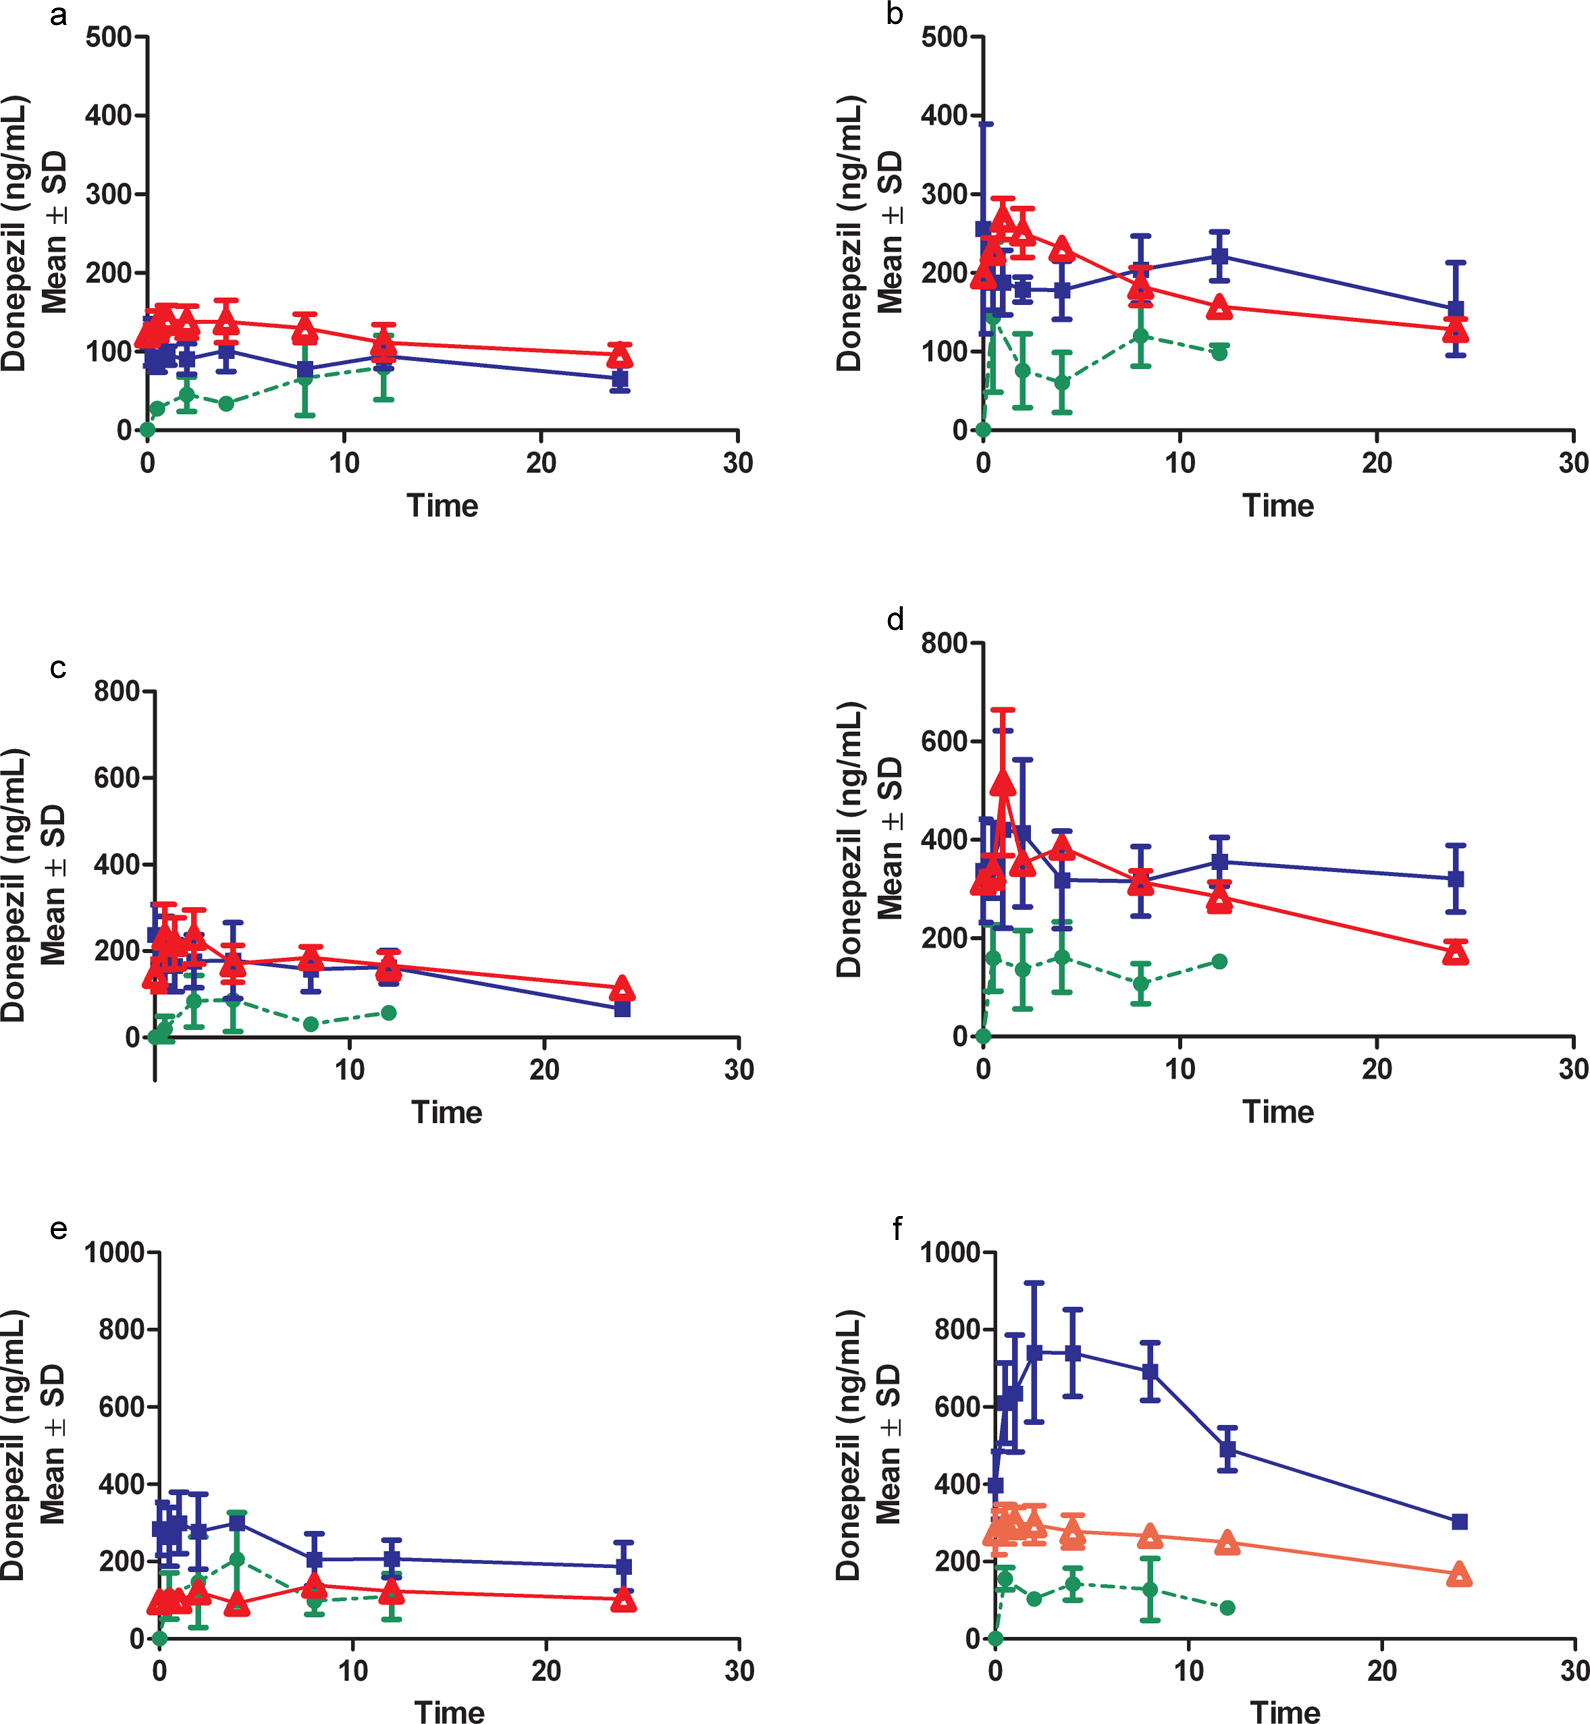
Pharmacokinetic profile from males (A, C, E) and females (B, D, F) after topical administration of 50, 125, and 250 mg/kg, respectively, donepezil HCl dose levels in isopropanol vehicle on days 1(•), 7 ( ▪ ), and 90 (▵).
Comparison of Mean Exposure of 25% Donepezil HCl Formulations Following Topical Application of Donepezil HCl in Acetone or Isopropanol to Sprague-Dawley Rats
There was an increase in exposure from days 1 to 7 but exposure from days 7 to 90 remained relatively constant. Accumulation ratios after oral dosing ranged from 0.744 to 3.22 for Cmax and ranged from 0.842 to 2.93 for AUC (0-12). Accumulation ratios after topical dosing generally decreased with dose in males and ranged from 0.519 to 8.04 for Cmax, whereas females showed an increased trend with dose formulations containing acetone, ranging from 2 to 10.7; and a decreased trend with formulations containing isopropanol, ranging from 1.59 to 6.52. Accumulation ratios for AUC (0-12) showed similar trends for males and females.
Males generally had less exposure relative to females, regardless of dose, duration, or route of administration. The vehicle used in the topical formulations did not affect Tmax or exposure. At the highest concentration of donepezil (25%) formulated with only Eudragit and vehicle, the exposure was generally higher in comparison to the formulation with additional components. This effect was more notable using isopropanol as the vehicle.
Discussion
This GLP nonclinical safety study utilized DBS for the analysis of donepezil concentrations in the blood. Donepezil is a good candidate for the DBS assay since it does not have significant partitioning between blood and plasma. 6,13 The DBS assay had suitable sensitivity, specificity, and reproducibility to support the toxicokinetics for this GLP study. Furthermore, the hematocrit percentages (33%-55%) for Sprague-Dawley rats of the age/weight range used in this study did not impact the assay.
Two routes of administration were compared, oral and topical, after repeated administration for 13 weeks. Oral toxicokinetic values were evaluated against previous reports with the same dose. According to data presented in NDA 020,690, Tmax and Cmax values derived from plasma LC/MS/MS were very similar to the DBS results. The AUC(0 − t) tended to increase utilizing the DBS assay but within the range of physiological variability. A similar pharmacokinetic profile was observed in young and old Lister Hooded rats. 14 Oral donepezil (10 mg/kg) induced ~10% body weight loss in males over the study duration but was not associated with additional abnormalities.
Topical formulations maintained donepezil blood levels consistently throughout the study duration consistent with sustained release formulations. 15 Animals tolerated the topical formulations, however, the formulation consisting of only donepezil HCl, Eudragit E100, and vehicle (acetone or isopropanol) resulted in increased exposure relative to its formulation counterpart that also included glycerin, triethyl citrate, and sorbitan monolaurate. This exposure result suggests that donepezil HCl and Eudragit E100 are the key components required for optimal delivery.
This GLP study identified exposure with varying topical dose levels of donepezil HCl. Dose selection end points according to the Guidance for Industry: Carcinogenicity Study Protocol Submissions (CDER 2002) include toxicity (MTD, body weight decrement, etc), 25× multiple of human exposure, saturation of absorption, maximum feasible dose, limit dose, and pharmacodynamic effects. 16 Based upon the physicochemical properties of donepezil HCl in relevant topical vehicles (acetone, isopropanol), the feasible concentration range was limited to 5% to 25%. Repeated application to rats for 13 weeks induced gender-specific responses, that is, body weight loss in males and enhanced exposure in females that approached the 25× multiple of human exposure. The DBS validated assay is a robust method that allowed donepezil detection in support of the GLP study and dose selection for a future carcinogenicity study.
Footnotes
Acknowledgment
The research presented in this article was funded solely by Teikoku Pharma USA, Inc.
Declaration of Conflicting Interests
The author(s) declared no potential conflicts of interest with respect to the research, authorship, and/or publication of this article other than Teikoku Pharma USA.
Funding
The author(s) received no financial support for the research, authorship, and/or publication of this article other than Teikoku Pharma USA.