
Abstract
Measuring 25-hydroxyvitamin D (25D) can be a challenge in veterinary medicine because of laboratory accessibility and required sample volume. We compared 2 dried-blood-spot (DBS) tests and a lateral flow assay (LFA) to the gold standard, liquid chromatography–tandem mass spectrometry (LC-MS/MS). We hypothesized that there would be good agreement among the tests, within a clinically significant limit of agreement of ± 25 nmol/L. We collected blood from 6 healthy purpose-bred 2-y-old cats at 6 times over 6 wk, and measured 25D concentrations with all 4 tests. Agreement of the 3 candidate tests and LC-MS/MS was evaluated via Bland–Altman analysis, Passing–Bablok regression, and Lin correlation coefficients. Bland–Altman analysis demonstrated that the mean bias was >± 25 nmol/L for all 3 candidate tests in comparison to serum LC-MS/MS concentrations. The 95% CIs for the mean bias did not include zero, further supporting the presence of significant bias among methods. Additionally, all 3 tests had poor agreement with serum LC-MS/MS concentrations when analyzed by Lin correlation coefficient analysis, and bias between methods was further characterized by Passing–Bablok analysis. Based on these results, none of these 3 tests is recommended as an alternative to LC-MS/MS testing for 25D measurement in cats.
Vitamin D deficiency, defined as low serum 25-hydroxyvitamin D (25D) concentration, has been documented to affect cats with a variety of ailments, including intestinal disease (e.g., inflammatory bowel disease, lymphoma), infectious disease (e.g., mycobacteriosis, feline immunodeficiency virus), and critical illness.6,7,12,13 Although it is well-established that vitamin D plays a role in a wide variety of disease states, it can be challenging to measure serum 25D outside of a controlled research setting, especially given the volume of blood required for testing, specifically in clinically ill feline patients (~1 mL of whole blood in order to obtain 0.5 mL of serum).
Despite the clear clinical relevance and potential impact of hypovitaminosis D to feline health and disease, our understanding of the subject remains limited. Although it has been well-established that vitamin D plays a role in a wide variety of disease states, the immediate practical, clinical benefits of supplementation in most scenarios has yet to be established. 10 There is a need for a low blood volume, easily accessible, convenient, and simple test for measuring blood 25D concentrations in cats. Such a test would improve our ability to gather essential information about the prevalence and severity of hypovitaminosis D in cats, and ultimately, determine which patients may benefit from vitamin D supplementation.
Several types of assays are available for measurement of 25D, with the current gold standard considered to be liquid chromatography–tandem mass spectrometry (LC-MS/MS). The gold standard method requires submission to specific reference laboratories and can be prohibitively expensive. Both factors may discourage testing and emphasize the need for a low-cost test for 25D that can provide real-time results. 10 Unfortunately, no accurate, low blood volume, bedside tests have been evaluated for accuracy in veterinary medicine to assess 25D status in cats. This testing challenge affects our ability to effectively measure 25D status in client-owned cats and cats in a research setting.
Several tests to measure 25D concentrations are available commercially; however, they have not been evaluated for agreement with LC-MS/MS testing in cats. Two options include dried-blood-spot (DBS) testing and lateral flow assays (LFAs). DBS testing has been utilized in human medicine for nearly a century and is commonly used in resource-limited situations. 3 DBS testing of 25D has been demonstrated to have excellent agreement with LC-MS/MS testing in sloths. 4 DBS testing requires only ~0.3–0.4 mL of whole blood (as little as 3–4 drops of blood), compared to 0.5 mL of serum or plasma for LC-MS/MS; stored human 25D DBS samples can remain stable for up to 25 y at room temperature. 16
LFAs are generally cost effective, provide rapid results, and are considered simple to use. 5 A 25D LFA is a newer testing option in human medicine that provides a more convenient quantitative measurement of 25D. 15 We used an LFA that had been validated in human patients with inflammatory bowel disease and demonstrated good agreement with 25D measurements obtained via LC-MS/MS. 2 This LFA requires 0.1 mL of whole blood and provides results in ~15 min.
Our objectives were to compare results from 3 commercial, low sample volume, point-of-care tests (2 DBS tests and 1 LFA test) to serum 25D concentrations measured via LC-MS/MS. We hypothesized that these test results would show good agreement with the serum LC-MS/MS concentrations.
Materials and methods
Animals
Six healthy purpose-bred 2-y-old research cats (3 castrated male, 3 spayed female) were enrolled prospectively in our study, which was approved by the Institutional Animal Care and Use Committee (The Ohio State University Veterinary Medical Center; IACUC 2021A00000001). All cats had a routine physical examination and minimum database screening performed within 6 mo of the study start date, consisting of CBC, serum chemistry panel, urinalysis, and fecal testing. All cats were fed the same commercial feline laboratory diet.
Serum 25-hydroxyvitamin D analysis
Blood was sampled at 6 times over 6 wk for 25D. At each time, 1.0 mL of whole blood was collected for serum 25D analysis via LC-MS/MS (Heartland Assays). After 45–60 min, samples were spun at 343 × g for 10 min; serum samples were stored at −80°C and submitted as a batch upon completion of our study. Both 25D3 (derived from cholecalciferol) and 25D2 (derived from ergocalciferol) concentrations were measured; however, because the 25D2 concentrations were below the limit of quantification, we are reporting only the 25D3 concentrations.
Dried-blood-spot testing
DBS testing was performed at external laboratories (DBS1 test, Heartland Assays; DBS2 test, ZRT Laboratory) according to the manufacturers’ instructions. In brief, ≥ 4 drops of whole blood (~50 µL per drop) were spotted onto filter paper cards (PerkinElmer) immediately after venous sampling. Each test was performed in duplicate. The cards were air-dried for ≥ 4 h and sealed in a plastic bag with desiccant. Samples were stored at −80°C and submitted to Heartland Assays and ZRT Laboratory as batches for analysis upon completion of our study. Extraction and isolation of 25D from the DBS card was completed by the 2 reference laboratories, followed by measurement of 25D concentrations via LC-MS/MS.
Lateral flow assay
We used an LFA (Preventis SmarTest vitamin D LFA; Immundiagnostik) in conjunction with a proprietary smartphone-based analyzer (SmarTest Pro vitamin D phone app; Immundiagnostik). The LFA is a colorimetric assay that provides a quantitative result based on the signal intensity of the test and control lines. We performed testing according to the manufacturer’s instructions. Immediately after venous sampling, the capillary tube provided with the test kit was filled with 1 drop of whole blood that was then mixed with the provided buffer. Three drops of this mixture were placed in the test sample well, and after a 15-min incubation period, the Preventis phone app was used to read and record the results (within 2 min). Testing was performed in duplicate at each time and measured using a smartphone (iPhone 11; Apple).
Statistical analysis
Descriptive statistics are reported for the entire dataset by method of assessment of 25D concentrations (LC-MS/MS, DBS1, DBS2, LFA). Data were tested for normality using the Shapiro–Wilk test. Normally distributed data were reported as x̄ and SD; non-normally distributed data were reported as median and range. Data from each method were plotted against the LC-MS/MS result to visually assess the degree of agreement among 25D methods. Bland–Altman plots were constructed, and limits of agreement analysis were performed to further assess the relationships among 25D methods. Bland–Altman analyses were also performed to assess each method individually for inter-test agreement and to determine the limits of agreement between duplicate test results at each time. A priori, we established that differences between 25D methods of < 25 nmol/L would be considered clinically irrelevant. Passing–Bablok regression and the Lin concordance correlation coefficient was performed for statistical assessment of agreement between each of the candidate 25D methods and serum LC-MS/MS. 9 For all analyses, p ≤ 0.05 was considered significant.
Results
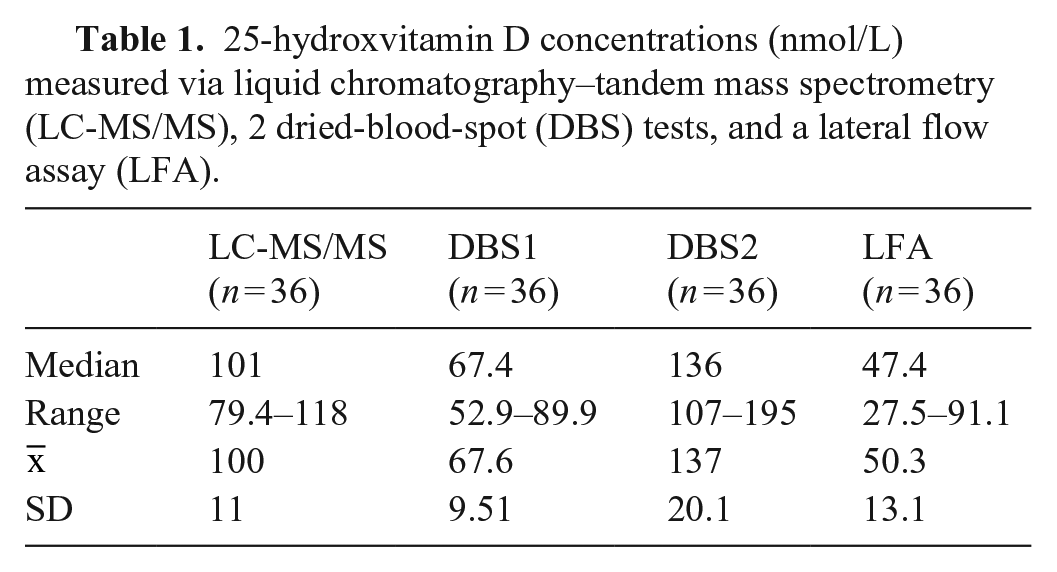
All 25D results were initially reported as ng/mL. Using a standard conversion factor of 2.496, results were converted to SI units (nmol/L; Table 1). By Bland–Altman analysis of duplicate test results within each of the 3 candidate tests (Suppl. Table 1), inter-test agreement was excellent, with a mean bias < 10 nmol/L for all 3 tests (Suppl. Table 2). When results from LC-MS/MS testing were compared to the results of each of the candidate tests in line-of-equality graphs (Fig. 1), the DBS1 and LFA results were consistently lower than the LC-MS/MS concentration; the DBS2 results, with the exception of one result, were consistently higher than the LC-MS/MS concentration.
25-hydroxvitamin D concentrations (nmol/L) measured via liquid chromatography–tandem mass spectrometry (LC-MS/MS), 2 dried-blood-spot (DBS) tests, and a lateral flow assay (LFA).
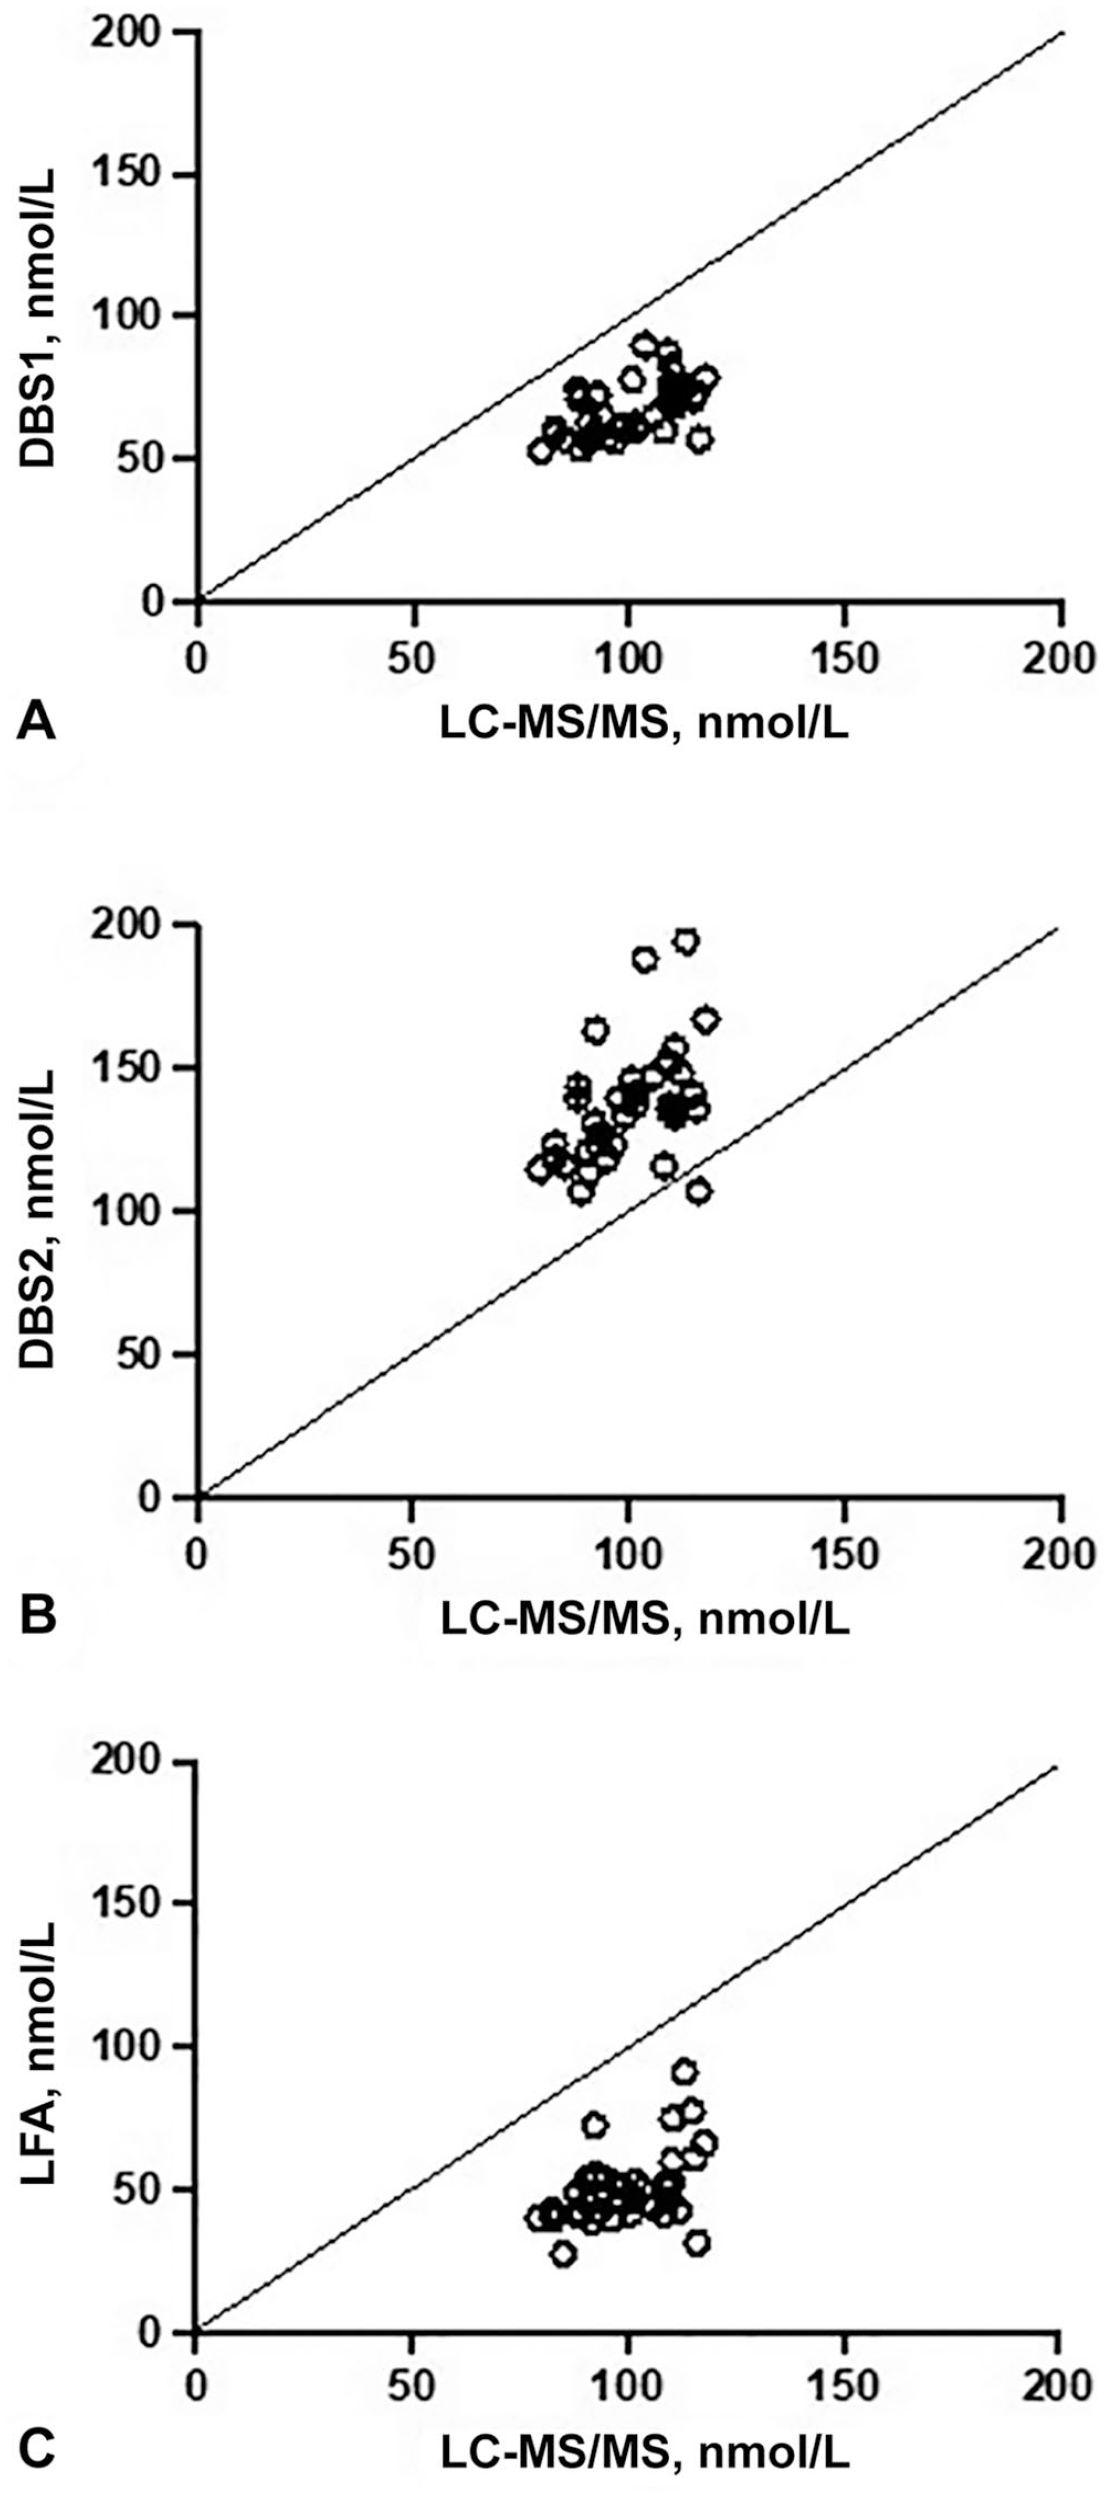
Line-of-equality graphs comparing 25-hydroxvitamin D concentrations between liquid chromatography–tandem mass spectrometry (LC-MS/MS) and candidate tests (dried-blood-spot [DBS] tests, lateral flow assay [LFA]) for visual comparison of agreement. Solid line represents the line of equality.
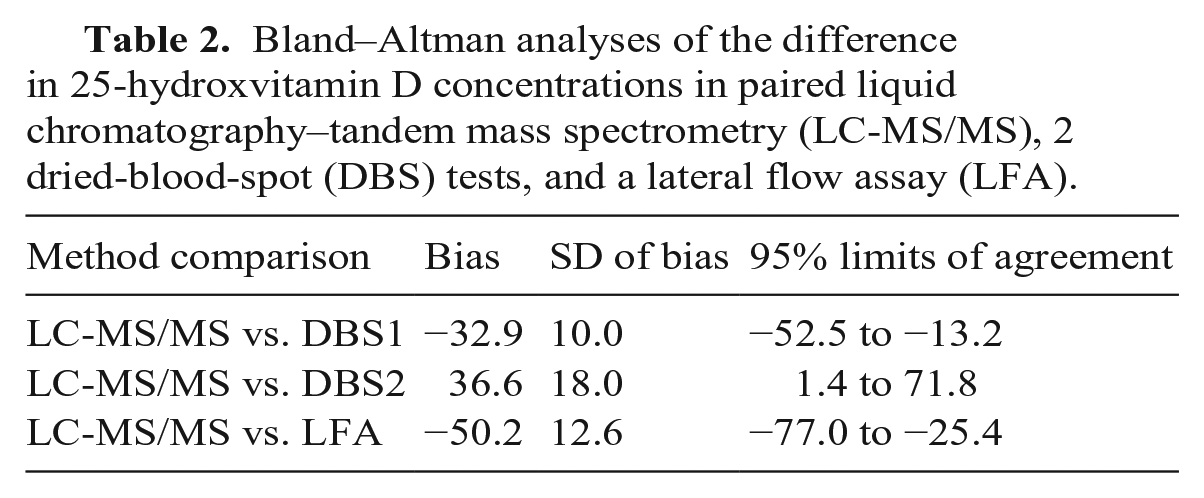
Bland–Altman plots demonstrated poor agreement between LC-MS/MS and all 3 candidate tests (Table 2; Fig. 2). In all instances, several data points fell outside the limit of 2SD, which was greater than the pre-set clinically significant limit of agreement of ± 25 nmol/L. The 95% CIs for the mean bias did not include zero, further supporting the presence of significant bias between the tests. The DBS1 test performed best of the 3 methods, with the smallest mean difference (−33 nmol/L) and narrowest SD of the bias (9.78 nmol/L). A negative bias was observed when the LC-MS/MS results were compared to the DBS1 and LFA results (Table 2). Conversely, a positive bias was observed when the LC-MS/MS result was compared to the DBS2 result (Table 2).
Bland–Altman analyses of the difference in 25-hydroxvitamin D concentrations in paired liquid chromatography–tandem mass spectrometry (LC-MS/MS), 2 dried-blood-spot (DBS) tests, and a lateral flow assay (LFA).
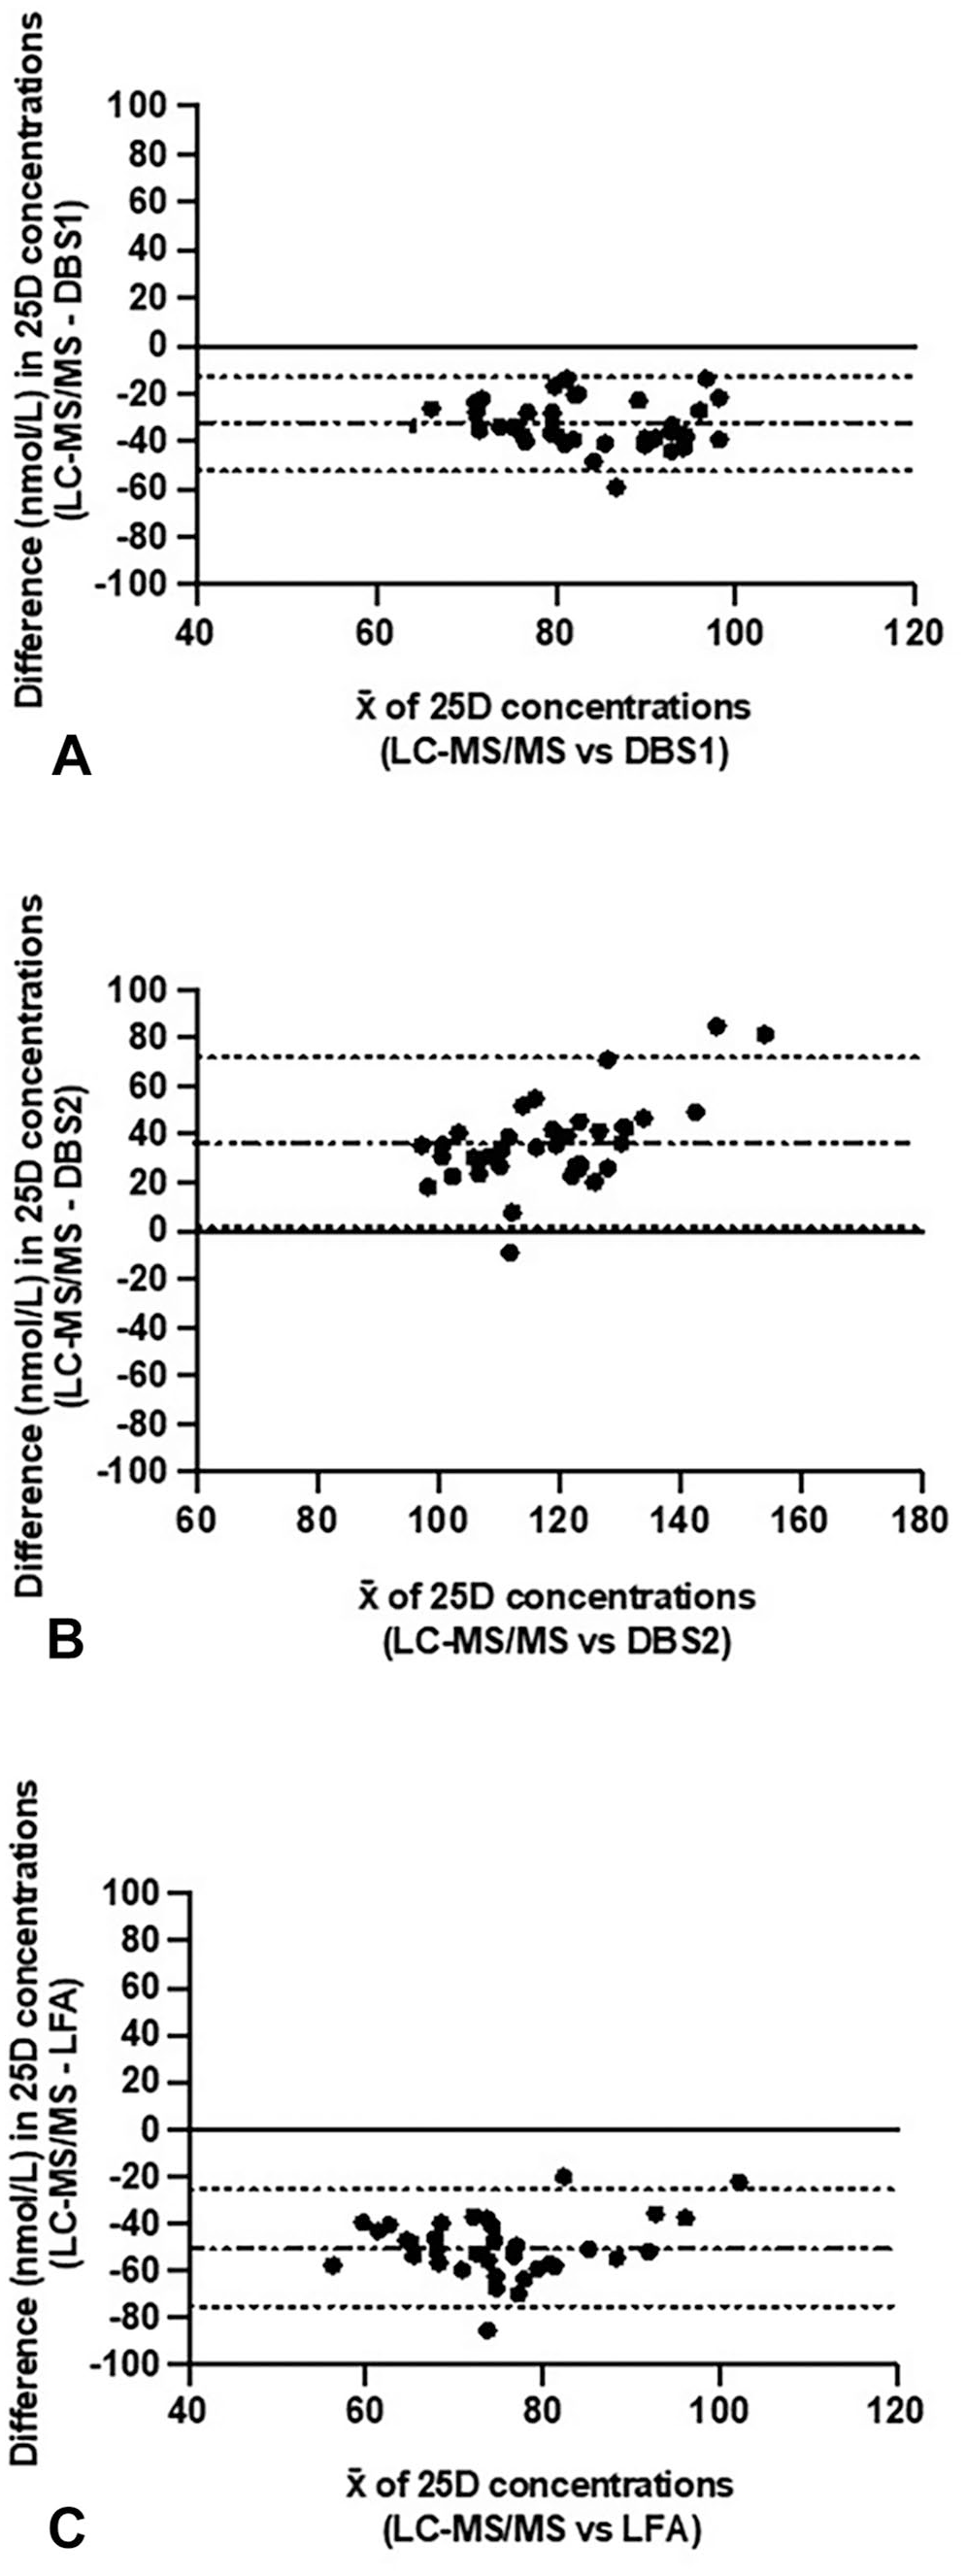
Bland–Altman plot difference in 25-hydroxvitamin D (25D) concentrations in paired liquid chromatography–tandem mass spectrometry (LC-MS/MS) and
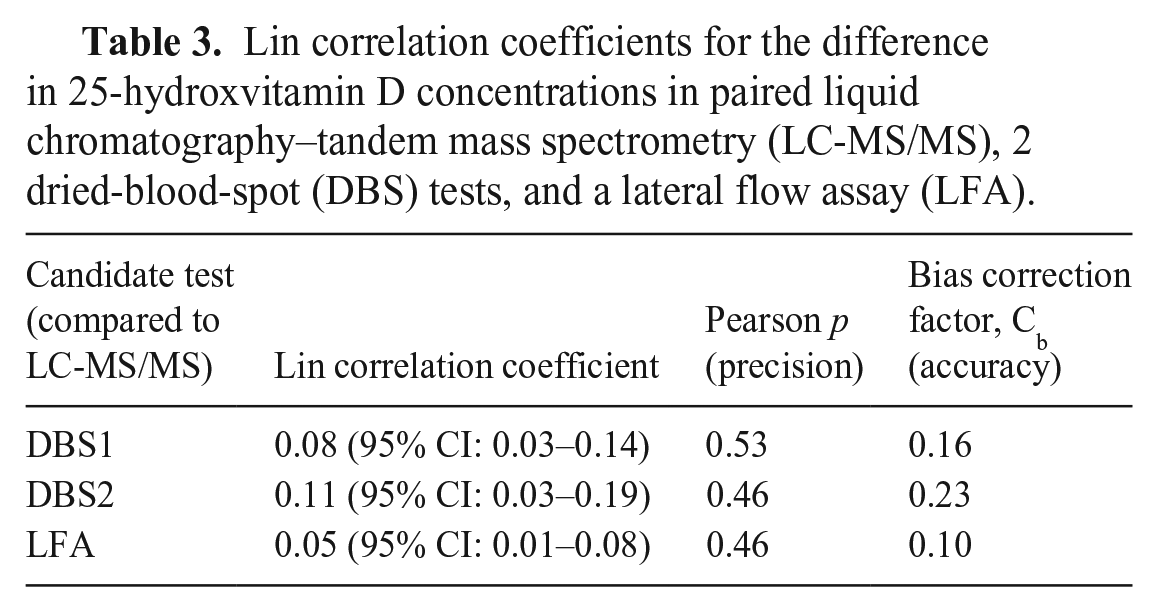
Lin correlation coefficients also indicated poor agreement between all methodologies compared to the LC-MS/MS (Table 3). The bias correction factor indicated poor accuracy between all methodologies compared to the LC-MS/MS gold standard. The Pearson p coefficient demonstrated variable degrees of precision when comparing the 3 candidate tests to the LC-MS/MS. The highest level of precision was identified between DBS1 and LC-MS/MS results.
Lin correlation coefficients for the difference in 25-hydroxvitamin D concentrations in paired liquid chromatography–tandem mass spectrometry (LC-MS/MS), 2 dried-blood-spot (DBS) tests, and a lateral flow assay (LFA).
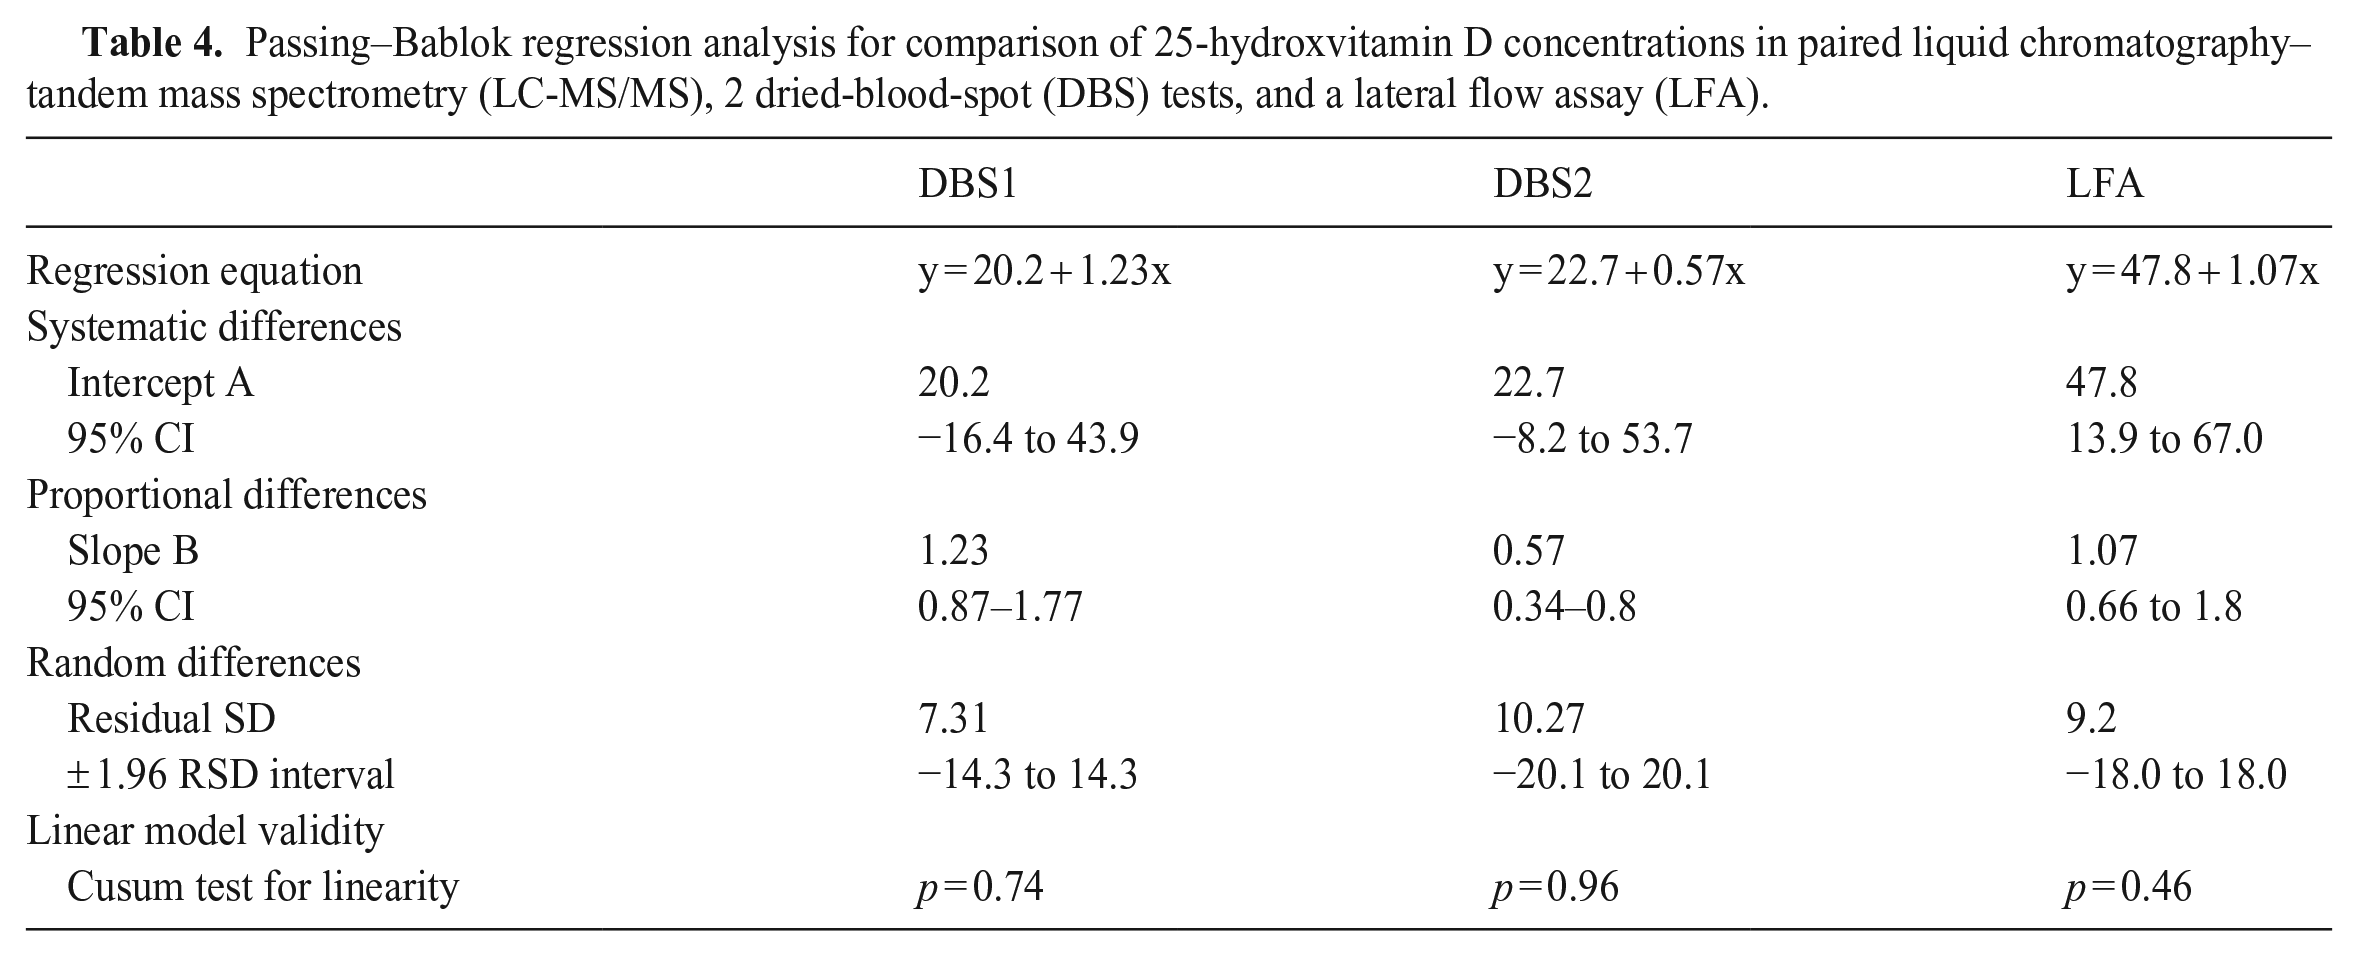
Passing–Bablok regression analysis further supports these findings (Table 4). A Cusum test for linearity indicated that the Passing–Bablok regression analysis was applicable in all assay comparisons. Passing–Bablok regression analysis of the DBS1 results compared to the LC-MS/MS results, demonstrated that neither proportional nor constant bias was present. Passing–Bablok regression analysis of the DBS2 and LC-MS/MS results revealed a slope statistically different from one, indicating significant proportional bias. There was no constant bias observed between DBS2 and LC-MS/MS results. Passing–Bablok regression analysis of the LFA and LC-MS/MS results exhibited no significant proportional bias. However, the intercept was statistically different from zero, indicating a significant constant bias. The magnitude of the residual SD in all comparisons further supports poor agreement between tests. The smallest residual SD was observed between LC-MS/MS and DBS1 results, further indicating the strongest agreement between these 2 methods.
Passing–Bablok regression analysis for comparison of 25-hydroxvitamin D concentrations in paired liquid chromatography–tandem mass spectrometry (LC-MS/MS), 2 dried-blood-spot (DBS) tests, and a lateral flow assay (LFA).
Discussion
We were unable to demonstrate good agreement of 25D concentrations between any of the low-volume blood tests assessed compared to the serum LC-MS/MS test. Although the DBS1 test performed best of the 3 tests, with the highest level of precision, and smallest mean difference (−33 nmol/L), all tests ultimately performed poorly, indicating that none of the tests was consistently comparable to the serum LC-MS/MS standard. Therefore, we cannot recommend these novel tests as alternative testing options for 25D concentration in cats at this time.
None of the tests that we studied is designed for or has been validated for use in cats. It is unknown how the 3-C, β-epimer of 25D affects results. The previously unrecognized C-3 epimer has been described in healthy cats and has been shown to be present in circulation in high amounts compared to other species. The 3-C epimeric pathway contributes significantly to 25D concentrations in cats, and therefore, measurement of 3-C epimer concentrations is recommended when evaluating vitamin D status in cats. 11 We were able to measure the 3-C epimer in serum via LC-MS/MS in these cats at 4 of the times, and it accounted for ~50% of the total 25D concentration (unpublished data). The standard serum LC-MS/MS and DBS1 tests utilized in our study do separate out and include the 3-C epimer in their 25D measurements. It is unknown whether the DBS2 test measurement includes the 3-C epimer because this was not disclosed by the manufacturer. The LFA is specifically reported to have no cross-reactivity with the 3-C epimer, which, based on our results, would potentially result in a falsely decreased 25D measurement of up to 50% in cats. Interestingly, the median LFA result was ~50% of the median serum LC-MS/MS result. Clearly, this is a crucial metabolic variable to consider. It is possible that another unknown metabolic difference in cats could have also affected the test results in our study.
Another potential reason for the discrepancy in test results could be related to species variability in Hct. The issue of Hct-bias is well-established within the DBS literature; specifically, given the difference in viscosity, blood with a higher Hct will spread less and cover less surface area on the filter paper than blood with a lower Hct. 14 The difference in spreading can lead to a difference in DBS punch diameter, and a secondary difference in sample proportions. Various successful strategies have been developed and reported in the human literature to account for the influence of patient Hct concentrations in DBS serum concentration calculations. A widely accepted solution to this potential issue is to use average Hct value in DBS serum calculations, although other methods have been proposed.8,14 Many human laboratories use an average Hct of 40–45% in their calculations; however, this does not account for species differences or variation in Hct in disease states or hydration status. The normal RI for feline Hct at our institution is 27–45%, and in our healthy research cats the range was 28–47%. Only Heartland Assays requested the cats’ Hct values for their DBS calculations, and this may account for why the Heartland DBS 25D concentrations result (DBS1) came closest to the 25D concentrations measured by LC-MS/MS. However, a human study reported better correlation between measured DBS concentration of 25D compared to plasma concentrations without correcting for Hct, and proposed that it is unnecessary to correct for Hct for hormones that are present in the plasma compartment. 1 Ultimately, the difference in average feline Hct (vs. human) appears less likely to be the cause of the discordant test results; however, it cannot be ruled out.
Limitations of our study include the fact that only healthy research cats were used, with a relatively narrow range of 25D concentrations (79.4–118 nmol/L). There are few studies reporting normal feline 25D concentrations; the range based on these studies is rather wide (37.2–207 nmol/L), with a median range of 112–122 nmol/L. 10 It is unknown how these tests would perform in a population of clinically ill cats or at very high or very low 25D concentrations. Although our pilot study had a relatively small number of cats, by evaluating 25D concentrations at several times, we were able to achieve a more robust sample size (n = 36) and thereby reduce the likelihood of a type II error. We attempted to control for the possibility of user error by performing all tests in duplicate and having the same person perform the tests at every time. Additionally, we utilized the same smartphone camera for every LFA to minimize variability. For accurate DBS measurements, it is essential that the dried blood spot be an appropriate size (i.e., adequate sample volume to provide a 4–6 mm punch); therefore at least 4 spots are submitted per filter paper to guarantee an adequate sample (even though only 1–2 spots are needed for analysis).
Unfortunately, based on the results of our study, none of the 3 evaluated tests is an acceptable substitute for the current gold standard LC-MS/MS test to measure 25D blood concentrations in healthy cats. The DBS1 performed the best of the candidate tests with the highest precision and accuracy, and smallest mean difference and SD of the difference. DBS1 analysis also did not reveal any significant proportional bias. Given these findings, the DBS1 test is most likely to be able to be converted using the regression equation. However, this was not our aim, and would require further investigation, ideally over a larger range of 25D concentrations. Further investigation is needed to determine whether these methods could be validated individually, and establish separate, normal feline RIs.
Supplemental Material
sj-pdf-1-vdi-10.1177_10406387231158106 – Supplemental material for Measuring 25-hydroxyvitamin D in cats: comparison of a whole-blood lateral flow assay, 2 dried-blood-spot tests, and serum LC-MS/MS
Supplemental material, sj-pdf-1-vdi-10.1177_10406387231158106 for Measuring 25-hydroxyvitamin D in cats: comparison of a whole-blood lateral flow assay, 2 dried-blood-spot tests, and serum LC-MS/MS by Hannah Brodlie, Jessica Quimby, Adam J. Rudinsky, Rene E. Paschall, Katelyn Brusach, Hannah Klein, Jenessa A. Winston and Valerie J. Parker in Journal of Veterinary Diagnostic Investigation
Footnotes
Acknowledgements
We thank Drs. Huw Evans, Phillip Lerche, and Daniel Gordon, as well as Ms. Gabriella Kratzer, for their assistance with sample collection.
Declaration of conflicting interests
The authors declared no potential conflicts of interest with respect to the research, authorship, and/or publication of this article.
Funding
The authors received funding for this research from a Purina Resident Research Grant.
Supplemental material
Supplemental material for this article is available online.
References
Supplementary Material
Please find the following supplemental material available below.
For Open Access articles published under a Creative Commons License, all supplemental material carries the same license as the article it is associated with.
For non-Open Access articles published, all supplemental material carries a non-exclusive license, and permission requests for re-use of supplemental material or any part of supplemental material shall be sent directly to the copyright owner as specified in the copyright notice associated with the article.